This report was recently updated on April 11 2024 with the latest and most recent
market numbers
Global Space Debris Removal Market Size, Trends & Analysis - Forecasts to 2029 By Debris Size Range (1mm to 1cm Debris Size, 1cm to 10cm Debris Size, and Greater than 10cm), By Orbit Type (Low Earth Orbit (LEO) and Geostationary Earth Orbit (GEO)), By End User (Commercial and Government), and By Region (North America, Asia Pacific, Central and South America, Europe, and Middle East and Africa), Competitive Landscape, Company Market Share Analysis, and End User Analysis
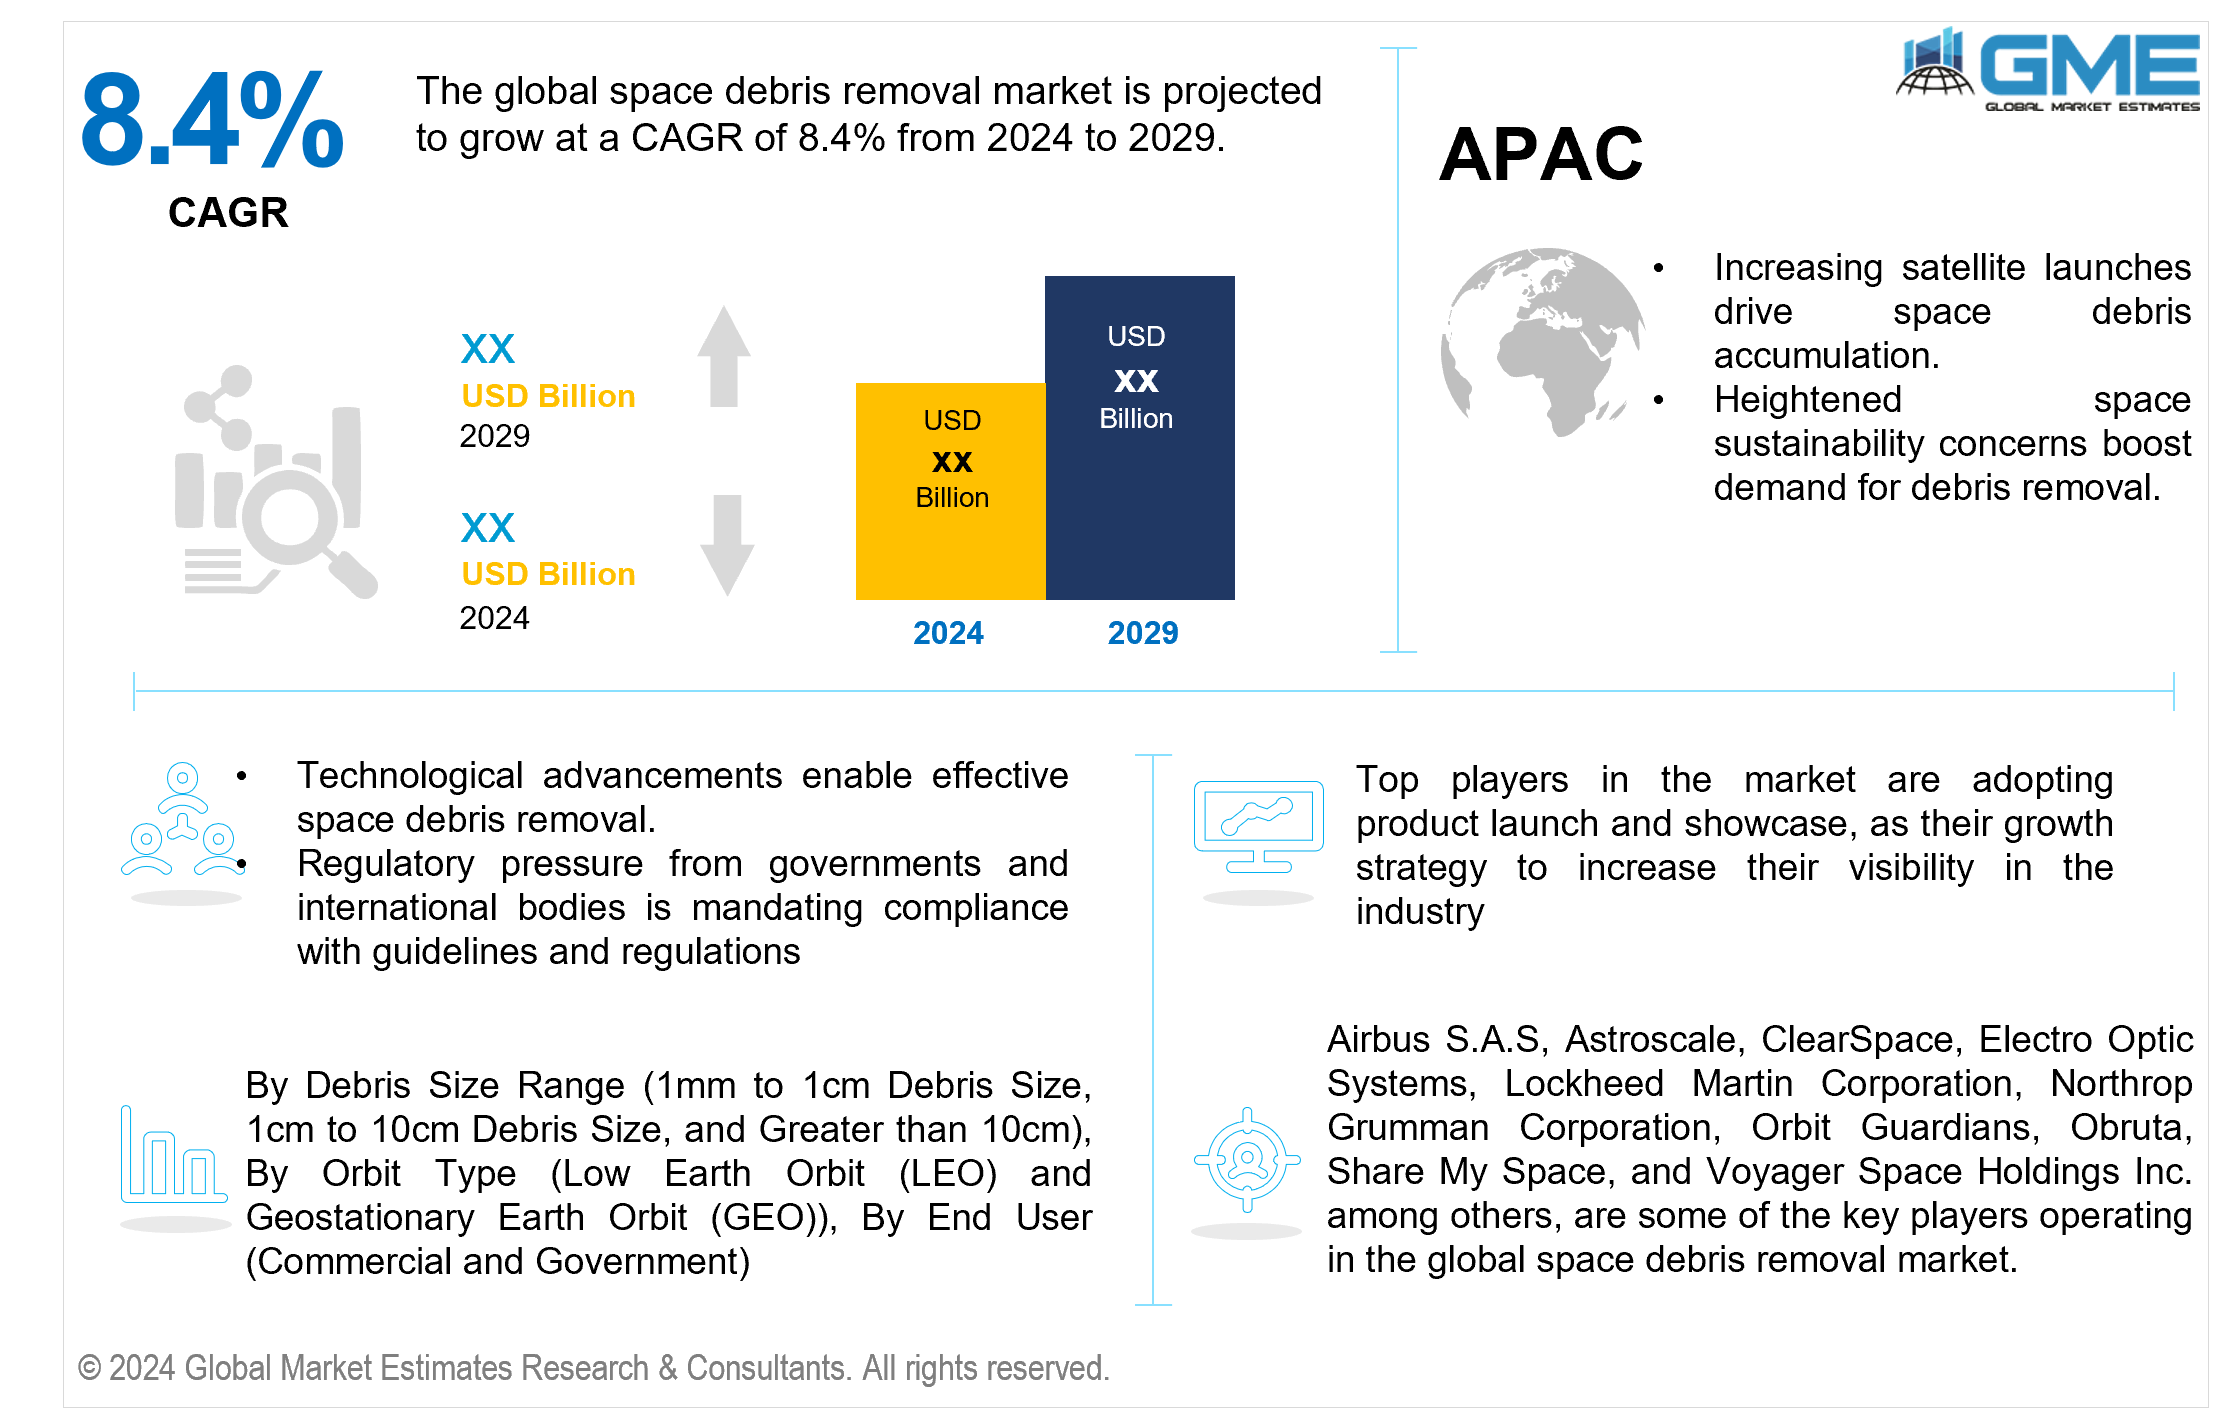
The global space debris removal market is projected to grow at a CAGR of 8.4% from 2024 to 2029.
There is an urgent need for practical solutions for managing and removing space debris due to the increase in satellite launches for various reasons. The escalation of space debris presents a threat to satellites in operation and upcoming space missions, underscoring the pressing necessity of tackling the problem with inventive approaches and technologies. According to the Space Debris Environment Report, issued by ESA's Space Debris Office, the seventh edition of the report, which was released on December 6, 2023, states that approximately 6,500 rocket launches have occurred since the start of the space age in 1957, excluding failures. Additionally, approximately 11,500 satellites are still in space. Out of the active satellites, about 9,000 are still functioning.
Governments, space agencies, and international organizations have emphasized the importance of space sustainability. There is a growing consensus that space debris poses a risk to operational satellites and future space missions, which has resulted in greater investment and effort in space debris removal systems.
Robotics, artificial intelligence, and autonomous systems have made it possible to create and deploy space debris cleanup techniques. These developments have made it simpler for businesses to enter the space debris cleanup market, resulting in increased competition and innovation in the sector.
Space organizations, governments, and commercial enterprises are increasingly working on space debris clearance efforts. Collaborative efforts allow for pooling resources, experience, and technology, resulting in more effective space debris removal solutions. For instance, in March 2021, NASA and SpaceX entered into a joint agreement aimed at enhancing space safety by sharing information and coordinating efforts. The agreement focuses on avoiding collisions between NASA spacecraft and SpaceX's Starlink satellites and other rideshare missions. SpaceX's Starlink satellites are equipped with systems that enable autonomous or manual maneuvers to avoid potential collisions. Both parties benefit from enhanced interaction by ensuring awareness of spacecraft locations and debris in orbit.
The 1mm to 1cm debris size segment is expected to hold the largest share in the market. The need for debris removal of 1mm to 1cm debris size is due to its high abundance and potential for causing critical damage. As a result, there is a greater emphasis on eliminating this piece of trash to reduce threats to operational satellites and vehicles. As of January 2021, data from the US Space Surveillance Network indicated the presence of 21,901 artificial objects circling the Earth, of which nearly 4,500 were operational satellites. However, these figures only represent trackable objects. It is estimated that there are over 128 million debris fragments smaller than 1cm, exceeding 900,000 pieces ranging from 1cm to 10cm, and approximately 34,000 fragments larger than 10cm in orbit.
The greater than 10cm segment is expected to be the fastest-growing segment in the market from 2024 to 2029. There is increasing demand for the removal of debris greater than 10cm, as it has the potential to cause catastrophic collisions with operational satellites and spacecraft. As awareness of the risks posed by larger debris increases, there is a growing demand for effective removal solutions, contributing to the segment growth to ensure space sustainability and safety.
The Geostationary Earth Orbit (GEO) segment is anticipated to be the fastest-growing segment in the market from 2024-2029. The need for debris removal is increasing in GEO due to the increasing congestion of satellites in this orbit. With more satellites being deployed for communication and broadcasting, there is a greater need to handle space trash in GEO to maintain operational integrity and avoid collisions.
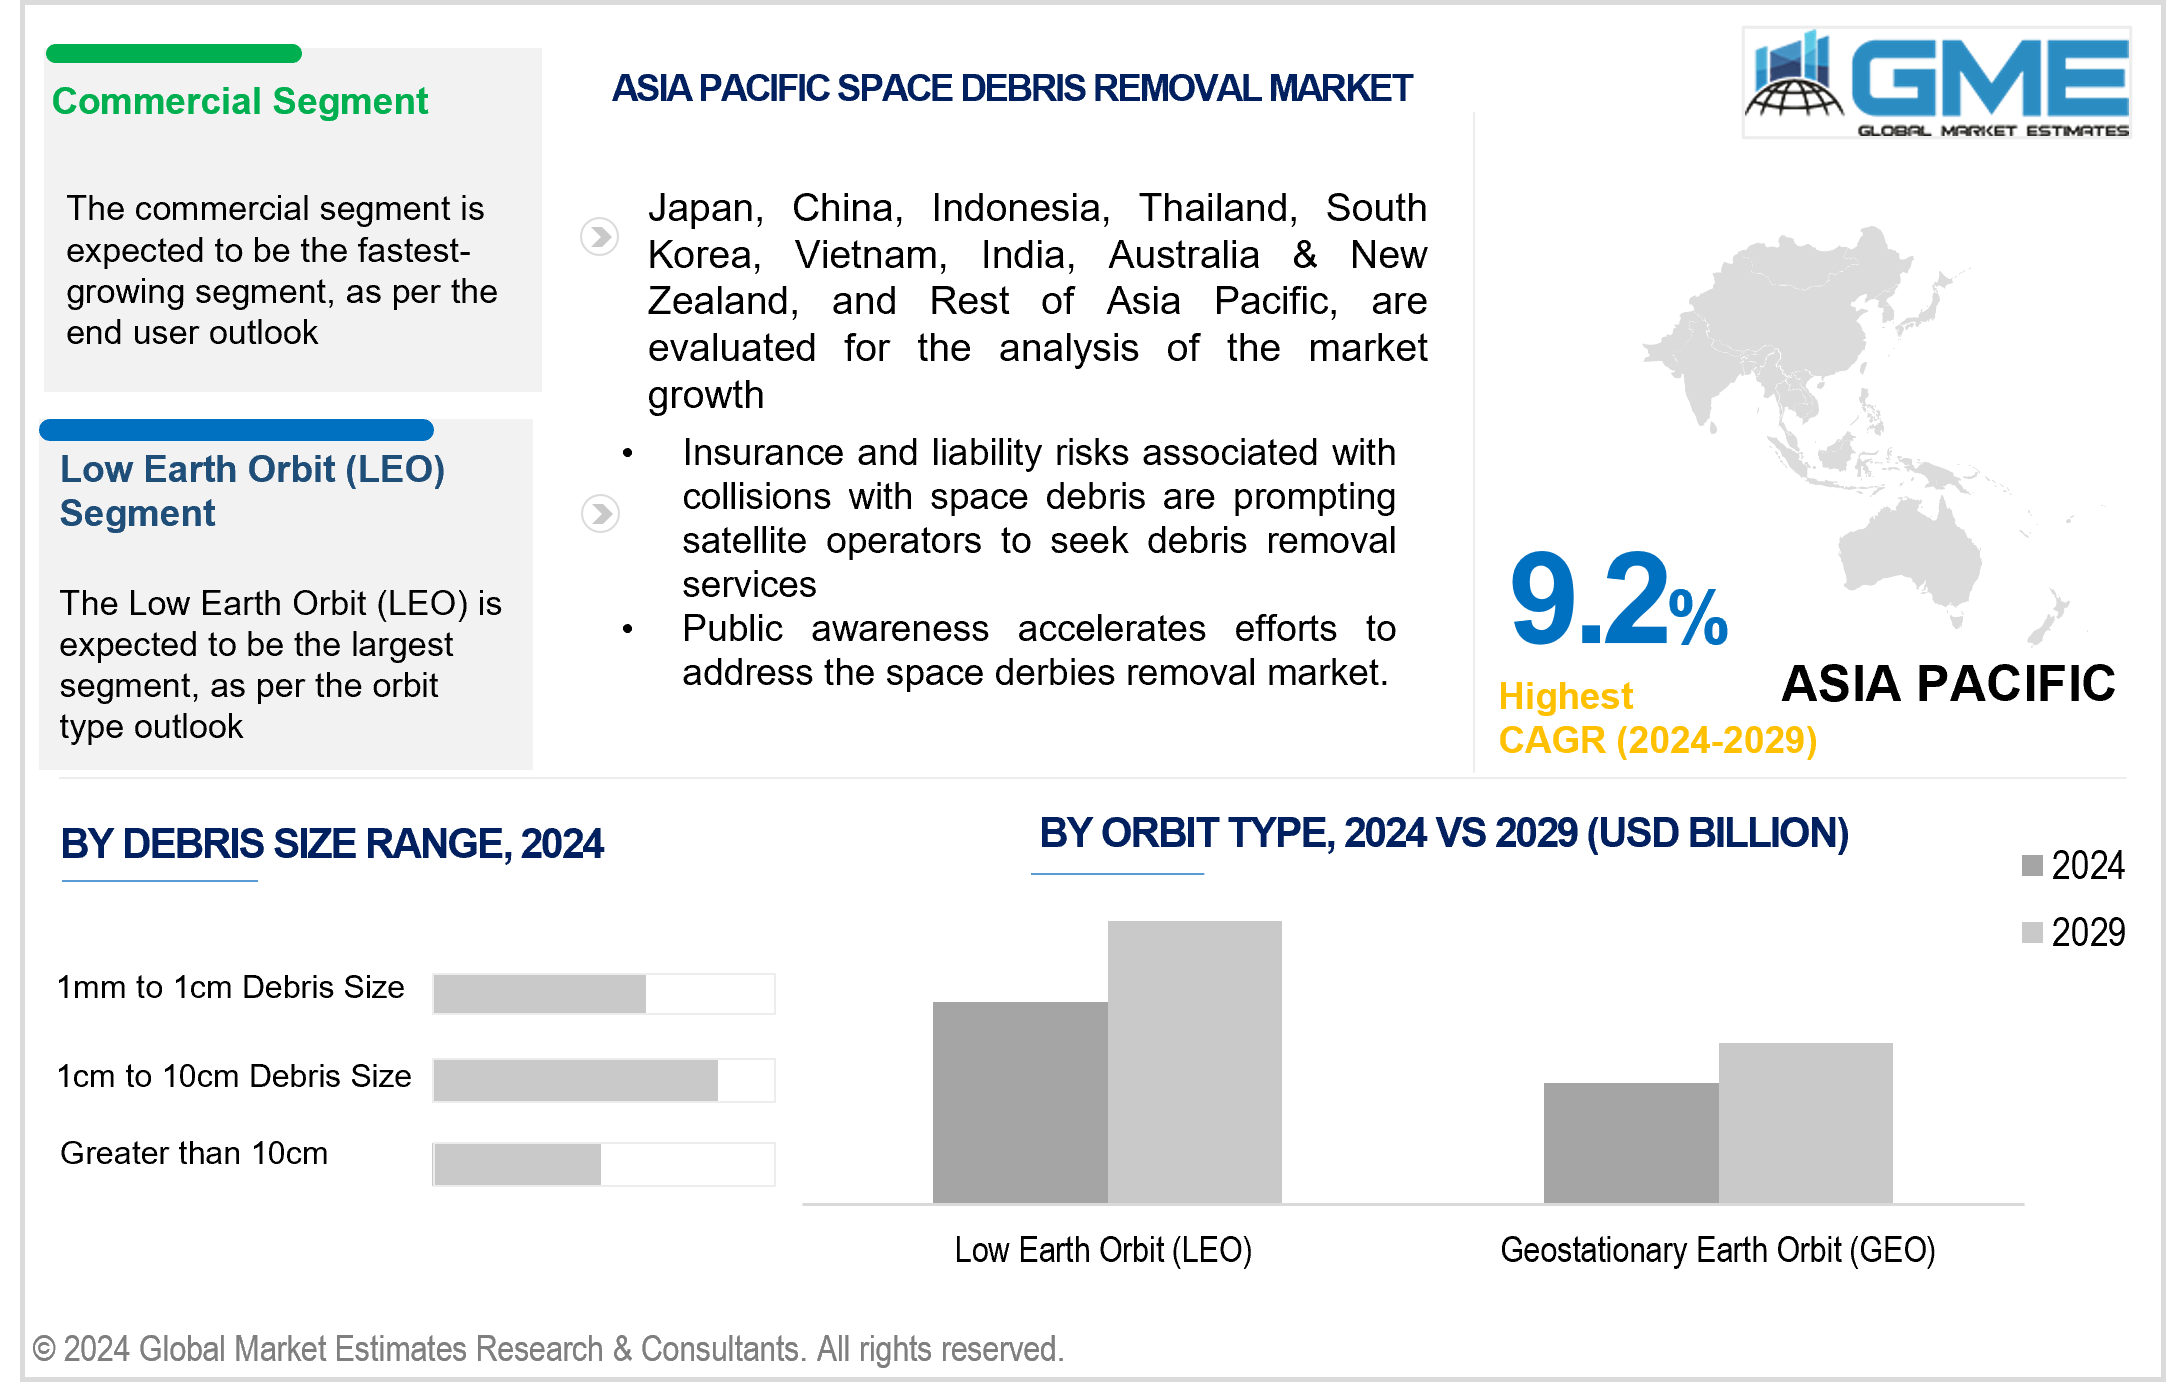
The Low Earth Orbit (LEO) segment is expected to hold the largest share of the market. This orbit is nearest to Earth, making it the most accessible in terms of energy and propulsion requirements for spacecraft. Earth observation and scientific research are crucial to maintaining a clean and safe orbital environment. Additionally, the lower altitudes of LEO facilitate easier access for debris removal missions compared to higher orbits, driving the segment's market share.
The commercial segment is anticipated to be the fastest-growing segment in the market from 2024 to 2029. This growth is attributed to increased commercialization of space activities. As more firms launch satellites for communication, Earth observation, and other uses, there is a greater need to manage space trash. Commercial companies are investing in debris removal services to protect their assets and maintain the long-term viability of their activities in space.
The government segment holds the largest share of the market. This is due to their responsibility for safeguarding national interests and space assets. Governments make significant investments in space debris clean-up to protect their satellites, space missions, and essential infrastructure. Furthermore, government agencies frequently lead cooperation activities with private entities, strengthening their market position.
North America is expected to be the largest region in the market. The primary reasons boosting market growth in this region include robust space infrastructure, which includes multiple satellite operators, space agencies, and commercial firms, such as Boeing Company, Northrop Grumman Corporation, and Altius Space, among others. The region's great technological capabilities, massive investment in space exploration, and solid regulatory frameworks all contribute to the region's dominance.
Asia Pacific is predicted to witness rapid growth during the forecast period. The regional market growth is attributed to countries like China, India, and Japan, which are boosting their investments in space exploration and satellite technology. Furthermore, the region's increasing commercial space industry, together with supporting government measures and rising awareness of space sustainability, is likely to fuel market growth in Asia Pacific.
Airbus S.A.S, Astroscale, ClearSpace, Electro Optic Systems, Lockheed Martin Corporation, Northrop Grumman Corporation, Orbit Guardians, Obruta, Share My Space, and Voyager Space Holdings Inc., among others, are some of the key players operating in the global space debris removal market.
Please note: This is not an exhaustive list of companies profiled in the report.
In February 2024, Astroscale Japan Inc. launched ADRAS-J, the world's first debris inspection spacecraft. Launched from Rocket Lab's Launch Complex 1 in New Zealand, ADRAS-J aims to approach, characterize, and survey a large debris piece through Rendezvous and Proximity Operations (RPO).
In October 2023, EOS Space Systems, known for its optical surveillance capabilities for space situational awareness, signed a Memorandum of Understanding (MoU) with EX-Fusion, a Japan-based start-up specializing in laser fusion technology. The collaboration aims to address the growing issue of space debris by exploring the use of high-power laser technologies to track and clear debris orbiting the Earth.
1 STRATEGIC INSIGHTS ON NEW REVENUE POCKETS
1.1 Strategic Opportunity & Attractiveness Analysis
1.1.1 Hot Revenue Pockets
1.1.2 Market Attractiveness Score
1.1.3 Revenue Impacting Opportunity
1.1.4 High Growing Region/Country
1.1.5 Competitor Analysis
1.1.6 Consumer Analysis
1.2 Global Market Estimates' View
1.3 Strategic Insights across Business Functions
1.3.1 For Chief Executive Officers
1.3.2 For Chief Marketing Officers
1.3.3 For Chief Strategy Officers
1.4 Evaluate the Potential of your Existing Business Lines vs. New Lines to Enter Into
2 TECHNOLOGICAL TRENDS
2.1 Technological Adoption Rate
2.2 Current Trend Impact Analysis
2.3 Future Trend Impact Analysis
3 GLOBAL MARKET OUTLOOK
3.1 Market Pyramid Analysis
3.1.1 Introduction
3.1.2 Adjacent Market Opportunities
3.1.3 Ancillary Market Opportunities
3.2 Demand Side Analysis
3.2.1 Market Drivers: Impact Analysis
3.2.2 Market Restraints: Impact Analysis
3.2.3 Market Opportunities: Impact Analysis
3.2.4 Market Challenges: Impact Analysis
3.3 Supply Side Analysis
3.3.1 Porter’s Five Forces Analysis
3.3.1.1 Threat of New Entrants
3.3.1.2 Threat of New Substitutes
3.3.1.3 Bargaining Power of Suppliers
3.3.1.4 Bargaining Power of Buyers
3.3.1.5 Intensity of Competitive Rivalry
3.3.2 SWOT Analysis; By Factor (Political & Legal, Economic, and Technological)
3.3.2.1 Political Landscape
3.3.2.2 Economic Landscape
3.3.2.3 Social Landscape
3.3.2.4 Technology Landscape
3.3.3 Value Chain Analysis
3.3.4 Trend Analysis
3.3.5 Gap Analysis
3.3.6 Cost Analysis
4 GLOBAL SPACE DEBRIS REMOVAL MARKET, BY DEBRIS SIZE RANGE
4.1 Introduction
4.2 Space Debris Removal Market: Debris Size Range Scope Key Takeaways
4.3 Revenue Growth Analysis, 2023 & 2029
4.4 1mm to 1cm Debris Size
4.4.1 1mm to 1cm Debris Size Market Estimates and Forecast, 2021-2029 (USD Million)
4.5 1cm to 10cm Debris Size
4.5.1 1cm to 10cm Debris Size Market Estimates and Forecast, 2021-2029 (USD Million)
4.6 Greater than 10cm
4.6.1 Greater than 10cm Market Estimates and Forecast, 2021-2029 (USD Million)
5 GLOBAL SPACE DEBRIS REMOVAL MARKET, BY ORBIT TYPE
5.1 Introduction
5.2 Space Debris Removal Market: Orbit Type Scope Key Takeaways
5.3 Revenue Growth Analysis, 2023 & 2029
5.4 Low Earth Orbit (LEO)
5.4.1 Low Earth Orbit (LEO) Market Estimates and Forecast, 2021-2029 (USD Million)
5.5 Geostationary Earth Orbit (GEO)
5.5.1 Geostationary Earth Orbit (GEO) Market Estimates and Forecast, 2021-2029 (USD Million)
6 GLOBAL SPACE DEBRIS REMOVAL MARKET, BY END USER
6.1 Introduction
6.2 Space Debris Removal Market: End User Scope Key Takeaways
6.3 Revenue Growth Analysis, 2023 & 2029
6.4 Commercial
6.4.1 Commercial Market Estimates and Forecast, 2021-2029 (USD Million)
6.5 Government
6.5.1 Government Market Estimates and Forecast, 2021-2029 (USD Million)
7 GLOBAL SPACE DEBRIS REMOVAL MARKET, BY REGION
7.1 Introduction
7.2 North America Space Debris Removal Market Estimates and Forecast, 2021-2029 (USD Million)
7.2.1 By Debris Size Range
7.2.2 By Orbit Type
7.2.3 By End User
7.2.4 By Country
7.2.4.1 U.S. Space Debris Removal Market Estimates and Forecast, 2021-2029 (USD Millin)
7.2.4.1.1 By Debris Size Range
7.2.4.1.2 By Orbit Type
7.2.4.1.3 By End User
7.2.4.2 Canada Space Debris Removal Market Estimates and Forecast, 2021-2029 (USD Million)
7.2.4.2.1 By Debris Size Range
7.2.4.2.2 By Orbit Type
7.2.4.2.3 By End User
7.2.4.3 Mexico Space Debris Removal Market Estimates and Forecast, 2021-2029 (USD Million)
7.2.4.3.1 By Debris Size Range
7.2.4.3.2 By Orbit Type
7.2.4.3.3 By End User
7.3 Europe Space Debris Removal Market Estimates and Forecast, 2021-2029 (USD Million)
7.3.1 By Debris Size Range
7.3.2 By Orbit Type
7.3.3 By End User
7.3.4 By Country
7.3.4.1 Germany Space Debris Removal Market Estimates and Forecast, 2021-2029 (USD Million)
7.3.4.1.1 By Debris Size Range
7.3.4.1.2 By Orbit Type
7.3.4.1.3 By End User
7.3.4.2 U.K. Space Debris Removal Market Estimates and Forecast, 2021-2029 (USD Million)
7.3.4.2.1 By Debris Size Range
7.3.4.2.2 By Orbit Type
7.3.4.2.3 By End User
7.3.4.3 France Space Debris Removal Market Estimates and Forecast, 2021-2029 (USD Million)
7.3.4.3.1 By Debris Size Range
7.3.4.3.2 By Orbit Type
7.3.4.3.3 By End User
7.3.4.4 Italy Space Debris Removal Market Estimates and Forecast, 2021-2029 (USD Million)
7.3.4.4.1 By Debris Size Range
7.3.4.4.2 By Orbit Type
7.2.4.4.3 By End User
7.3.4.5 Spain Space Debris Removal Market Estimates and Forecast, 2021-2029 (USD Million)
7.3.4.5.1 By Debris Size Range
7.3.4.5.2 By Orbit Type
7.2.4.5.3 By End User
7.3.4.6 Netherlands Space Debris Removal Market Estimates and Forecast, 2021-2029 (USD Million)
7.3.4.6.1 By Debris Size Range
7.3.4.6.2 By Orbit Type
7.2.4.6.3 By End User
7.3.4.7 Rest of Europe Space Debris Removal Market Estimates and Forecast, 2021-2029 (USD Million)
7.3.4.7.1 By Debris Size Range
7.3.4.7.2 By Orbit Type
7.2.4.7.3 By End User
7.4 Asia Pacific Space Debris Removal Market Estimates and Forecast, 2021-2029 (USD Million)
7.4.1 By Debris Size Range
7.4.2 By Orbit Type
7.4.3 By End User
7.4.4 By Country
7.4.4.1 China Space Debris Removal Market Estimates and Forecast, 2021-2029 (USD Million)
7.4.4.1.1 By Debris Size Range
7.4.4.1.2 By Orbit Type
7.4.4.1.3 By End User
7.4.4.2 Japan Space Debris Removal Market Estimates and Forecast, 2021-2029 (USD Million)
7.4.4.2.1 By Debris Size Range
7.4.4.2.2 By Orbit Type
7.4.4.2.3 By End User
7.4.4.3 India Space Debris Removal Market Estimates and Forecast, 2021-2029 (USD Million)
7.4.4.3.1 By Debris Size Range
7.4.4.3.2 By Orbit Type
7.4.4.3.3 By End User
7.4.4.4 South Korea Space Debris Removal Market Estimates and Forecast, 2021-2029 (USD Million)
7.4.4.4.1 By Debris Size Range
7.4.4.4.2 By Orbit Type
7.4.4.4.3 By End User
7.4.4.5 Singapore Space Debris Removal Market Estimates and Forecast, 2021-2029 (USD Million)
7.4.4.5.1 By Debris Size Range
7.4.4.5.2 By Orbit Type
7.4.4.5.3 By End User
7.4.4.6 Malaysia Space Debris Removal Market Estimates and Forecast, 2021-2029 (USD Million)
7.4.4.6.1 By Debris Size Range
7.4.4.6.2 By Orbit Type
7.4.4.6.3 By End User
7.4.4.7 Thailand Space Debris Removal Market Estimates and Forecast, 2021-2029 (USD Million)
7.4.4.7.1 By Debris Size Range
7.4.4.7.2 By Orbit Type
7.4.4.7.3 By End User
7.4.4.8 Indonesia Space Debris Removal Market Estimates and Forecast, 2021-2029 (USD Million)
7.4.4.8.1 By Debris Size Range
7.4.4.8.2 By Orbit Type
7.4.4.8.3 By End User
7.4.4.9 Vietnam Space Debris Removal Market Estimates and Forecast, 2021-2029 (USD Million)
7.4.4.9.1 By Debris Size Range
7.4.4.9.2 By Orbit Type
7.4.4.9.3 By End User
7.4.4.10 Taiwan Space Debris Removal Market Estimates and Forecast, 2021-2029 (USD Million)
7.4.4.10.1 By Debris Size Range
7.4.4.10.2 By Orbit Type
7.4.4.10.3 By End User
7.4.4.11 Rest of Asia Pacific Space Debris Removal Market Estimates and Forecast, 2021-2029 (USD Million)
7.4.4.11.1 By Debris Size Range
7.4.4.11.2 By Orbit Type
7.4.4.11.3 By End User
7.5 Middle East and Africa Space Debris Removal Market Estimates and Forecast, 2021-2029 (USD Million)
7.5.1 By Debris Size Range
7.5.2 By Orbit Type
7.5.3 By End User
7.5.4 By Country
7.5.4.1 Saudi Arabia Space Debris Removal Market Estimates and Forecast, 2021-2029 (USD Million)
7.5.4.1.1 By Debris Size Range
7.5.4.1.2 By Orbit Type
7.5.4.1.3 By End User
7.5.4.2 U.A.E. Space Debris Removal Market Estimates and Forecast, 2021-2029 (USD Million)
7.5.4.2.1 By Debris Size Range
7.5.4.2.2 By Orbit Type
7.5.4.2.3 By End User
7.5.4.3 Israel Space Debris Removal Market Estimates and Forecast, 2021-2029 (USD Million)
7.5.4.3.1 By Debris Size Range
7.5.4.3.2 By Orbit Type
7.5.4.3.3 By End User
7.5.4.4 South Africa Space Debris Removal Market Estimates and Forecast, 2021-2029 (USD Million)
7.5.4.4.1 By Debris Size Range
7.5.4.4.2 By Orbit Type
7.5.4.4.3 By End User
7.5.4.5 Rest of Middle East and Africa Space Debris Removal Market Estimates and Forecast, 2021-2029 (USD Million)
7.5.4.5.1 By Debris Size Range
7.5.4.5.2 By Orbit Type
7.5.4.5.2 By End User
7.6 Central and South America Space Debris Removal Market Estimates and Forecast, 2021-2029 (USD Million)
7.6.1 By Debris Size Range
7.6.2 By Orbit Type
7.6.3 By End User
7.6.4 By Country
7.6.4.1 Brazil Space Debris Removal Market Estimates and Forecast, 2021-2029 (USD Million)
7.6.4.1.1 By Debris Size Range
7.6.4.1.2 By Orbit Type
7.6.4.1.3 By End User
7.6.4.2 Argentina Eaporative Air Cooler Market Estimates and Forecast, 2021-2029 (USD Million)
7.6.4.2.1 By Debris Size Range
7.6.4.2.2 By Orbit Type
7.6.4.2.3 By End User
7.6.4.3 Chile Space Debris Removal Market Estimates and Forecast, 2021-2029 (USD Million)
7.6.4.3.1 By Debris Size Range
7.6.4.3.2 By Orbit Type
7.6.4.3.3 By End User
7.6.4.4 Rest of Central and South America Space Debris Removal Market Estimates and Forecast, 2021-2029 (USD Million)
7.6.4.4.1 By Debris Size Range
7.6.4.4.2 By Orbit Type
7.6.4.4.3 By End User
8 COMPETITIVE LANDCAPE
8.1 Company Market Share Analysis
8.2 Four Quadrant Positioning Matrix
8.2.1 Market Leaders
8.2.2 Market Visionaries
8.2.3 Market Challengers
8.2.4 Niche Market Players
8.3 Vendor Landscape
8.3.1 North America
8.3.2 Europe
8.3.3 Asia Pacific
8.3.4 Rest of the World
8.4 Company Profiles
8.4.1 Airbus S.A.S
8.4.1.1 Business Description & Financial Analysis
8.4.1.2 SWOT Analysis
8.4.1.3 Products & Services Offered
8.4.1.4 Strategic Alliances between Business Partners
8.4.2 Astroscale
8.4.2.1 Business Description & Financial Analysis
8.4.2.2 SWOT Analysis
8.4.2.3 Products & Services Offered
8.4.2.4 Strategic Alliances between Business Partners
8.4.3 Electro Optic Systems
8.4.3.1 Business Description & Financial Analysis
8.4.3.2 SWOT Analysis
8.4.3.3 Products & Services Offered
8.4.3.4 Strategic Alliances between Business Partners
8.4.4 ClearSpace
8.4.4.1 Business Description & Financial Analysis
8.4.4.2 SWOT Analysis
8.4.4.3 Products & Services Offered
8.4.4.4 Strategic Alliances between Business Partners
8.4.5 Lockheed Martin Corporation
8.4.5.1 Business Description & Financial Analysis
8.4.5.2 SWOT Analysis
8.4.5.3 Products & Services Offered
8.4.5.4 Strategic Alliances between Business Partners
8.4.6 Northrop Grumman Corporation
8.4.6.1 Business Description & Financial Analysis
8.4.6.2 SWOT Analysis
8.4.6.3 Products & Services Offered
8.4.6.4 Strategic Alliances between Business Partners
8.4.7 Orbit Guardians
8.4.7.1 Business Description & Financial Analysis
8.4.7.2 SWOT Analysis
8.4.7.3 Products & Services Offered
8.4.8.4 Strategic Alliances between Business Partners
8.4.8 Obruta
8.4.8.1 Business Description & Financial Analysis
8.4.8.2 SWOT Analysis
8.4.8.3 Products & Services Offered
8.4.8.4 Strategic Alliances between Business Partners
8.4.9 Share My Space
8.4.9.1 Business Description & Financial Analysis
8.4.9.2 SWOT Analysis
8.4.9.3 Products & Services Offered
8.4.9.4 Strategic Alliances between Business Partners
8.4.10 Voyager Space Holdings Inc.
8.4.10.1 Business Description & Financial Analysis
8.4.10.2 SWOT Analysis
8.4.10.3 Products & Services Offered
8.4.10.4 Strategic Alliances between Business Partners
8.4.11 Other Companies
8.4.11.1 Business Description & Financial Analysis
8.4.11.2 SWOT Analysis
8.4.11.3 Products & Services Offered
8.4.11.4 Strategic Alliances between Business Partners
9 RESEARCH METHODOLOGY
9.1 Market Introduction
9.1.1 Market Definition
9.1.2 Market Scope & Segmentation
9.2 Information Procurement
9.2.1 Secondary Research
9.2.1.1 Purchased Databases
9.2.1.2 GMEs Internal Data Repository
9.2.1.3 Secondary Resources & Third Party Perspectives
9.2.1.4 Company Information Sources
9.2.2 Primary Research
9.2.2.1 Various Types of Respondents for Primary Interviews
9.2.2.2 Number of Interviews Conducted throughout the Research Process
9.2.2.3 Primary Stakeholders
9.2.2.4 Discussion Guide for Primary Participants
9.2.3 Expert Panels
9.2.3.1 Expert Panels Across 30+ Industry
9.2.4 Paid Local Experts
9.2.4.1 Paid Local Experts Across 30+ Industry Across each Region
9.3 Market Estimation
9.3.1 Top-Down Approach
9.3.1.1 Macro-Economic Indicators Considered
9.3.1.2 Micro-Economic Indicators Considered
9.3.2 Bottom Up Approach
9.3.2.1 Company Share Analysis Approach
9.3.2.2 Estimation of Potential Product Sales
9.4 Data Triangulation
9.4.1 Data Collection
9.4.2 Time Series, Cross Sectional & Panel Data Analysis
9.4.3 Cluster Analysis
9.5 Analysis and Output
9.5.1 Inhouse AI Based Real Time Analytics Tool
9.5.2 Output From Desk & Primary Research
9.6 Research Assumptions & Limitations
9.7.1 Research Assumptions
9.7.2 Research Limitations
LIST OF TABLES
1 Global Space Debris Removal Market, By Debris Size Range , 2021-2029 (USD Mllion)
2 1mm to 1cm Debris Size Market, By Region, 2021-2029 (USD Mllion)
3 1cm to 10cm Debris Size Market, By Region, 2021-2029 (USD Mllion)
4 Greater than 10cm Market, By Region, 2021-2029 (USD Mllion)
5 Global Space Debris Removal Market, By Orbit Type, 2021-2029 (USD Mllion)
6 Low Earth Orbit (LEO) Market, By Region, 2021-2029 (USD Mllion)
7 Geostationary Earth Orbit (GEO) Market, By Region, 2021-2029 (USD Mllion)
8 Global Space Debris Removal Market, By End User, 2021-2029 (USD Mllion)
9 Commercial Market, By Region, 2021-2029 (USD Mllion
10 Government Market, By Region, 2021-2029 (USD Mllion)
11 Regional Analysis, 2021-2029 (USD Mllion)
12 North America Space Debris Removal Market, By Debris Size Range , 2021-2029 (USD Million)
13 North America Space Debris Removal Market, By Orbit Type, 2021-2029 (USD Million)
14 North America Space Debris Removal Market, By End User, 2021-2029 (USD Million)
15 North America Space Debris Removal Market, By Country, 2021-2029 (USD Million)
16 U.S. Space Debris Removal Market, By Debris Size Range , 2021-2029 (USD Million)
17 U.S. Space Debris Removal Market, By Orbit Type, 2021-2029 (USD Million)
18 U.S. Space Debris Removal Market, By End User, 2021-2029 (USD Million)
19 Canada Space Debris Removal Market, By Debris Size Range , 2021-2029 (USD Million)
20 Canada Space Debris Removal Market, By Orbit Type, 2021-2029 (USD Million)
21 Canada Space Debris Removal Market, By End User, 2021-2029 (USD Million)
22 Mexico Space Debris Removal Market, By Debris Size Range , 2021-2029 (USD Million)
23 Mexico Space Debris Removal Market, By Orbit Type, 2021-2029 (USD Million)
24 Mexico Space Debris Removal Market, By End User, 2021-2029 (USD Million)
25 Europe Space Debris Removal Market, By Debris Size Range , 2021-2029 (USD Million)
26 Europe Space Debris Removal Market, By Orbit Type, 2021-2029 (USD Million)
27 Europe Space Debris Removal Market, By End User, 2021-2029 (USD Million)
28 Europe Space Debris Removal Market, By country, 2021-2029 (USD Million)
29 Germany Space Debris Removal Market, By Debris Size Range , 2021-2029 (USD Million)
30 Germany Space Debris Removal Market, By Orbit Type, 2021-2029 (USD Million)
31 Germany Space Debris Removal Market, By End User, 2021-2029 (USD Million)
32 U.K. Space Debris Removal Market, By Debris Size Range , 2021-2029 (USD Million)
33 U.K. Space Debris Removal Market, By Orbit Type, 2021-2029 (USD Million)
34 U.K. Space Debris Removal Market, By End User, 2021-2029 (USD Million)
35 France Space Debris Removal Market, By Debris Size Range , 2021-2029 (USD Million)
36 France Space Debris Removal Market, By Orbit Type, 2021-2029 (USD Million)
37 France Space Debris Removal Market, By End User, 2021-2029 (USD Million)
38 Italy Space Debris Removal Market, By Debris Size Range , 2021-2029 (USD Million)
39 Italy Space Debris Removal Market, By End Use , 2021-2029 (USD Million)
40 Italy Space Debris Removal Market, By End User, 2021-2029 (USD Million)
41 Spain Space Debris Removal Market, By Debris Size Range , 2021-2029 (USD Million)
42 Spain Space Debris Removal Market, By Orbit Type, 2021-2029 (USD Million)
43 Spain Space Debris Removal Market, By End User, 2021-2029 (USD Million)
44 Rest Of Europe Space Debris Removal Market, By Debris Size Range , 2021-2029 (USD Million)
45 Rest Of Europe Space Debris Removal Market, By Orbit Type, 2021-2029 (USD Million)
46 Rest of Europe Space Debris Removal Market, By End User, 2021-2029 (USD Million)
47 Asia Pacific Space Debris Removal Market, By Debris Size Range , 2021-2029 (USD Million)
48 Asia Pacific Space Debris Removal Market, By Orbit Type, 2021-2029 (USD Million)
49 Asia Pacific Space Debris Removal Market, By End User, 2021-2029 (USD Million)
50 Asia Pacific Space Debris Removal Market, By Country, 2021-2029 (USD Million)
51 China Space Debris Removal Market, By Debris Size Range , 2021-2029 (USD Million)
52 China Space Debris Removal Market, By Orbit Type, 2021-2029 (USD Million)
53 China Space Debris Removal Market, By End User, 2021-2029 (USD Million)
54 India Space Debris Removal Market, By Debris Size Range , 2021-2029 (USD Million)
55 India Space Debris Removal Market, By Orbit Type, 2021-2029 (USD Million)
56 India Space Debris Removal Market, By End User, 2021-2029 (USD Million)
57 Japan Space Debris Removal Market, By Debris Size Range , 2021-2029 (USD Million)
58 Japan Space Debris Removal Market, By Orbit Type, 2021-2029 (USD Million)
59 Japan Space Debris Removal Market, By End User, 2021-2029 (USD Million)
60 South Korea Space Debris Removal Market, By Debris Size Range , 2021-2029 (USD Million)
61 South Korea Space Debris Removal Market, By Orbit Type, 2021-2029 (USD Million)
62 South Korea Space Debris Removal Market, By End User, 2021-2029 (USD Million)
63 Singapore Space Debris Removal Market, By Debris Size Range , 2021-2029 (USD Million)
64 Singapore Space Debris Removal Market, By Orbit Type, 2021-2029 (USD Million)
65 Singapore Space Debris Removal Market, By End User, 2021-2029 (USD Million)
66 Malaysia Space Debris Removal Market, By Debris Size Range , 2021-2029 (USD Million)
67 Malaysia Space Debris Removal Market, By Orbit Type, 2021-2029 (USD Million)
68 Malaysia Space Debris Removal Market, By End User, 2021-2029 (USD Million)
69 Thailand Space Debris Removal Market, By Debris Size Range , 2021-2029 (USD Million)
70 Thailand Space Debris Removal Market, By Orbit Type, 2021-2029 (USD Million)
71 Thailand Space Debris Removal Market, By End User, 2021-2029 (USD Million)
72 Indonesia Space Debris Removal Market, By Debris Size Range , 2021-2029 (USD Million)
73 Indonesia Space Debris Removal Market, By Orbit Type, 2021-2029 (USD Million)
74 Indonesia Space Debris Removal Market, By End User, 2021-2029 (USD Million)
75 Vietnam Space Debris Removal Market, By Debris Size Range , 2021-2029 (USD Million)
76 Vietnam Space Debris Removal Market, By Orbit Type, 2021-2029 (USD Million)
77 Vietnam Space Debris Removal Market, By End User, 2021-2029 (USD Million)
78 Taiwan Space Debris Removal Market, By Debris Size Range , 2021-2029 (USD Million)
79 Taiwan Space Debris Removal Market, By Orbit Type, 2021-2029 (USD Million)
80 Taiwan Space Debris Removal Market, By End User, 2021-2029 (USD Million)
81 Rest of Asia Pacific Space Debris Removal Market, By Debris Size Range , 2021-2029 (USD Million)
82 Rest of Asia Pacific Space Debris Removal Market, By Orbit Type, 2021-2029 (USD Million)
83 Rest of Asia Pacific Space Debris Removal Market, By End User, 2021-2029 (USD Million)
84 Middle East and Africa Space Debris Removal Market, By Debris Size Range , 2021-2029 (USD Million)
85 Middle East and Africa Space Debris Removal Market, By Orbit Type, 2021-2029 (USD Million)
86 Middle East and Africa Space Debris Removal Market, By End User, 2021-2029 (USD Million)
87 Middle East and Africa Space Debris Removal Market, By Country, 2021-2029 (USD Million)
88 Saudi Arabia Space Debris Removal Market, By Debris Size Range , 2021-2029 (USD Million)
89 Saudi Arabia Space Debris Removal Market, By Orbit Type, 2021-2029 (USD Million)
90 Saudi Arabia Space Debris Removal Market, By End User, 2021-2029 (USD Million)
91 UAE Space Debris Removal Market, By Debris Size Range , 2021-2029 (USD Million)
92 UAE Space Debris Removal Market, By Orbit Type, 2021-2029 (USD Million)
93 UAE Space Debris Removal Market, By End User, 2021-2029 (USD Million)
94 Israel Space Debris Removal Market, By Debris Size Range , 2021-2029 (USD Million)
95 Israel Space Debris Removal Market, By Orbit Type, 2021-2029 (USD Million)
96 Israel Space Debris Removal Market, By End User, 2021-2029 (USD Million)
97 South Africa Space Debris Removal Market, By Debris Size Range , 2021-2029 (USD Million)
98 South Africa Space Debris Removal Market, By Orbit Type, 2021-2029 (USD Million)
99 South Africa Space Debris Removal Market, By End User, 2021-2029 (USD Million)
100 Rest of Middle East and Africa Space Debris Removal Market, By Debris Size Range , 2021-2029 (USD Million)
101 Rest of Middle East and Africa Space Debris Removal Market, By Orbit Type, 2021-2029 (USD Million)
102 Rest of Middle East and Africa Space Debris Removal Market, By End User, 2021-2029 (USD Million)
103 Central and South America Space Debris Removal Market, By Debris Size Range , 2021-2029 (USD Million)
104 Central and South America Space Debris Removal Market, By Orbit Type, 2021-2029 (USD Million)
105 Central and South America Space Debris Removal Market, By End User, 2021-2029 (USD Million)
106 Central and South America Space Debris Removal Market, By Country, 2021-2029 (USD Million)
107 Brazil Space Debris Removal Market, By Debris Size Range , 2021-2029 (USD Million)
108 Brazil Space Debris Removal Market, By Orbit Type, 2021-2029 (USD Million)
109 Brazil Space Debris Removal Market, By End User, 2021-2029 (USD Million)
110 Argentina Space Debris Removal Market, By Debris Size Range , 2021-2029 (USD Million)
111 Argentina Space Debris Removal Market, By Orbit Type, 2021-2029 (USD Million)
112 Argentina Space Debris Removal Market, By End User, 2021-2029 (USD Million)
113 Chile Space Debris Removal Market, By Debris Size Range , 2021-2029 (USD Million)
114 Chile Space Debris Removal Market, By Orbit Type, 2021-2029 (USD Million)
115 Chile Space Debris Removal Market, By End User, 2021-2029 (USD Million)
116 Rest of Central and South America Space Debris Removal Market, By Debris Size Range , 2021-2029 (USD Million)
117 Rest of Central and South America Space Debris Removal Market, By Orbit Type, 2021-2029 (USD Million)
118 Rest of Central and South America Space Debris Removal Market, By End User, 2021-2029 (USD Million)
119 Airbus S.A.S : Products & Services Offering
120 Astroscale: Products & Services Offering
121 ELECTRO OPTIC SYSTEMS: Products & Services Offering
122 ClearSpace: Products & Services Offering
123 Lockheed Martin Corporation: Products & Services Offering
124 NORTHROP GRUMMAN CORPORATION: Products & Services Offering
125 ORBIT GUARDIANS : Products & Services Offering
126 Obruta: Products & Services Offering
127 Share My Space, Inc: Products & Services Offering
128 Voyager Space Holdings Inc.: Products & Services Offering
129 Other Companies: Products & Services Offering
LIST OF FIGURES
1 Global Space Debris Removal Market Overview
2 Global Space Debris Removal Market Value From 2021-2029 (USD Mllion)
3 Global Space Debris Removal Market Share, By Debris Size Range (2022)
4 Global Space Debris Removal Market Share, By Orbit Type (2023)
5 Global Space Debris Removal Market Share, By End User (2023
6 Global Space Debris Removal Market, By Region (Asia Pacific Market)
7 Technological Trends In Global Space Debris Removal Market
8 Four Quadrant Competitor Positioning Matrix
9 Impact Of Macro & Micro Indicators On The Market
10 Impact Of Key Drivers On The Global Space Debris Removal Market
11 Impact Of Challenges On The Global Space Debris Removal Market
12 Porter’s Five Forces Analysis
13 Global Space Debris Removal Market: By Debris Size Range Scope Key Takeaways
14 Global Space Debris Removal Market, By Debris Size Range Segment: Revenue Growth Analysis
15 1mm to 1cm Debris Size Market, By Region, 2021-2029 (USD Mllion)
16 1cm to 10cm Debris Size Market, By Region, 2021-2029 (USD Mllion)
17 Greater than 10cm Market, By Region, 2021-2029 (USD Mllion)
18 Global Space Debris Removal Market: By Orbit Type Scope Key Takeaways
19 Global Space Debris Removal Market, By Orbit Type Segment: Revenue Growth Analysis
20 Low Earth Orbit (LEO) Market, By Region, 2021-2029 (USD Mllion)
21 Geostationary Earth Orbit (GEO) Market, By Region, 2021-2029 (USD Mllion)
22 Global Space Debris Removal Market: By End User Scope Key Takeaways
23 Global Space Debris Removal Market, By End User Segment: Revenue Growth Analysis
24 Commercial Market, By Region, 2021-2029 (USD Mllion)
25 Government Market, By Region, 2021-2029 (USD Mllion)
26 Regional Segment: Revenue Growth Analysis
27 Global Space Debris Removal Market: Regional Analysis
28 North America Space Debris Removal Market Overview
29 North America Space Debris Removal Market, By Debris Size Range
30 North America Space Debris Removal Market, By Orbit Type
31 North America Space Debris Removal Market, By End User
32 North America Space Debris Removal Market, By Country
33 U.S. Space Debris Removal Market, By Debris Size Range
34 U.S. Space Debris Removal Market, By Orbit Type
35 U.S. Space Debris Removal Market, By End User
36 Canada Space Debris Removal Market, By Debris Size Range
37 Canada Space Debris Removal Market, By Orbit Type
38 Canada Space Debris Removal Market, By End User
39 Mexico Space Debris Removal Market, By Debris Size Range
40 Mexico Space Debris Removal Market, By Orbit Type
41 Mexico Space Debris Removal Market, By End User
42 Four Quadrant Positioning Matrix
43 Company Market Share Analysis
44 Airbus S.A.S : Company Snapshot
45 Airbus S.A.S : SWOT Analysis
46 Airbus S.A.S : Geographic Presence
47 Astroscale: Company Snapshot
48 Astroscale: SWOT Analysis
49 Astroscale: Geographic Presence
50 Electro Optic Systems: Company Snapshot
51 Electro Optic Systems: SWOT Analysis
52 Electro Optic Systems: Geographic Presence
53 ClearSpace: Company Snapshot
54 ClearSpace: Swot Analysis
55 ClearSpace: Geographic Presence
56 Lockheed Martin Corporation: Company Snapshot
57 Lockheed Martin Corporation: SWOT Analysis
58 Lockheed Martin Corporation: Geographic Presence
59 Northrop Grumman Corporation: Company Snapshot
60 Northrop Grumman Corporation: SWOT Analysis
61 Northrop Grumman Corporation: Geographic Presence
62 Orbit Guardians : Company Snapshot
63 Orbit Guardians : SWOT Analysis
64 Orbit Guardians : Geographic Presence
65 Obruta: Company Snapshot
66 Obruta: SWOT Analysis
67 Obruta: Geographic Presence
68 Share My Space, Inc.: Company Snapshot
69 Share My Space, Inc.: SWOT Analysis
70 Share My Space, Inc.: Geographic Presence
71 Voyager Space Holdings Inc.: Company Snapshot
72 Voyager Space Holdings Inc.: SWOT Analysis
73 Voyager Space Holdings Inc.: Geographic Presence
74 Other Companies: Company Snapshot
75 Other Companies: SWOT Analysis
76 Other Companies: Geographic Presence
The Global Space Debris Removal Market has been studied from the year 2019 till 2029. However, the CAGR provided in the report is from the year 2024 to 2029. The research methodology involved three stages: Desk research, Primary research, and Analysis & Output from the entire research process.

The desk research involved a robust background study which meant referring to paid and unpaid databases to understand the market dynamics; mapping contracts from press releases; identifying the key players in the market, studying their product portfolio, competition level, annual reports/SEC filings & investor presentations; and learning the demand and supply-side analysis for the Space Debris Removal Market.

The primary research activity included telephonic conversations with more than 50 tier 1 industry consultants, distributors, and end-use product manufacturers.

Finally, based on the above thorough research process, an in-depth analysis was carried out considering the following aspects: market attractiveness, current & future market trends, market share analysis, SWOT analysis of the company and customer analytics.

Frequently Asked Questions

This FREE sample includes market data points, ranging from trend analyses to market estimates & forecasts. See for yourself.
Or view our licence options:
Tailor made solutions just for you
80% of our clients seek made-to-order reports. How do you want us to tailor yours?
OUR CLIENTS


