This report was recently updated on April 12 2024 with the latest and most recent
market numbers
Global Gas Turbine Market Size, Trends & Analysis - Forecasts to 2028 By Capacity (Less than or Equal to 200 MW and >200 MW), By Technology (Open Cycle and Combined Cycle), By End-use (Power & Utility and Industrial), and By Region (North America, Asia Pacific, Central and South America, Europe, and Middle East and Africa), Competitive Landscape, Company Market Share Analysis, and End User Analysis
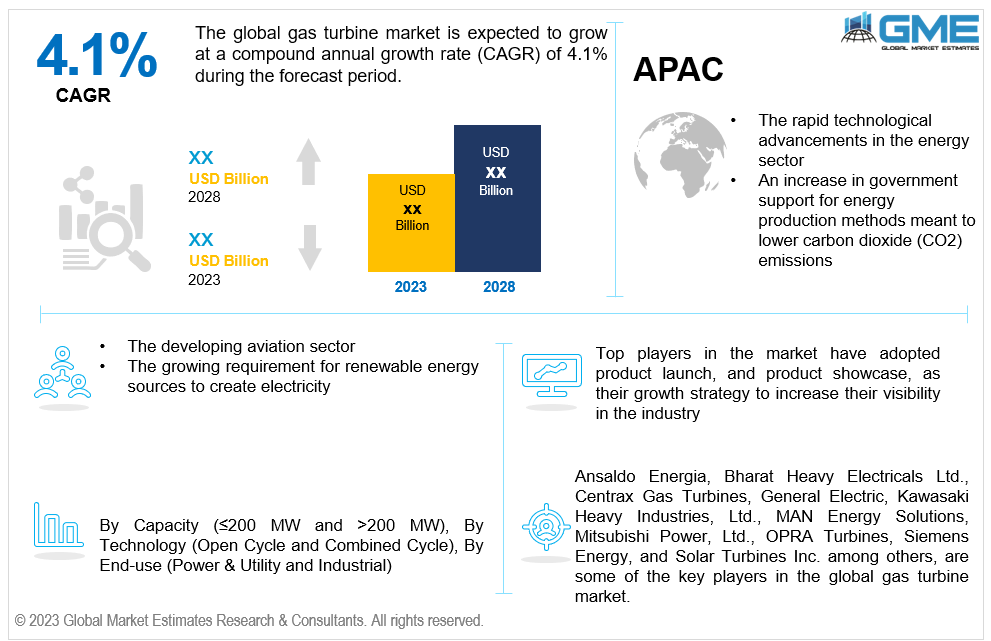
The global gas turbine market is estimated to exhibit a CAGR of 4.1% from 2023 to 2028.
The primary factors propelling the market growth are the rapid technological advancements in the energy sector and an increase in government support for energy production methods meant to lower carbon dioxide (CO2) emissions. As more sustainable technologies are developed, governments consider natural gas as a bridge or transitional fuel that can assist lower CO2 emissions when compared to coal or oil. Due to their widespread usage in natural gas power plants, gas turbines are essential in shifting to a lower-carbon energy mix. To tackle climate change, several countries also established emission reduction objectives. These goals align with increased government support for cleaner energy generation, which can also promote investments in gas turbine technology and other technologies that cut emissions overall. For instance, natural gas was the leading source of electricity generation in the United States in 2020 and the second-leading source globally, accounting for 40.5% of U.S. power generation and 23.4% of global power generation, according to the BP Statistical Review of World Energy 2021.
The developing aviation sector and the growing requirement for renewable energy sources to create electricity are expected to promote market growth during the projected period. Natural variables like sunlight and wind speed determine how much electricity is produced by intermittent renewable energy sources like solar and wind. Gas turbines can be swiftly turned on or off to offset variations in renewable energy output. This makes them useful for keeping the grid balanced and supplying a steady electricity supply even if renewable sources fluctuate. Peaking power plants, or establishments that run at times of high energy demand, frequently employ gas turbines. Peak demand cannot always be met by renewable energy sources alone, mainly when renewable energy output is low. Gas turbines can provide more power as needed, reacting swiftly to peaks in demand. For instance, according to the International Energy Agency (IEA), the percentage of renewable energy in the world's electrical generation increased from 27% in 2019 to 29% in 2020.
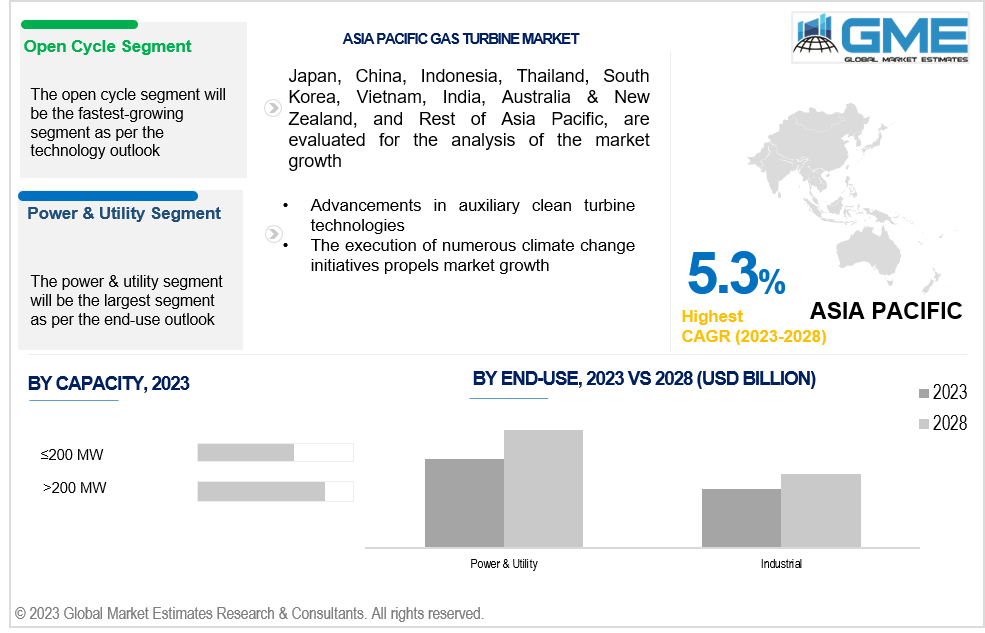
Advancements in auxiliary clean turbine technologies and the execution of numerous climate change initiatives propel market growth. Gas turbines can run on a greater variety of fuels, including cleaner and renewable sources, due to advancements in fuel adaptability. To satisfy the evolving energy landscape and the increasing need for sustainable energy solutions, this flexibility is essential. Furthermore, the efficiency of sophisticated combined cycle power plants, which mix steam and gas turbines, has increased. Improved efficiency results in more economical energy output overall and better use of fuel resources.
The integration of gas and steam turbines in combined cycle power plants is becoming increasingly prevalent due to their increased efficiency in turning fuel into energy. Companies engaged in integrated cycle system design, production, and maintenance have opportunities. Moreover, the trend towards decentralized power generation, where smaller-scale power plants are located closer to end users, creates opportunities for gas turbines. The energy security and dependability of these decentralized systems may be improved.
However, the volatile price of natural gas and stringent regulations hinder market growth.
The >200 MW segment is expected to hold the largest share of the market over the forecast period. Utility-scale power plants and other large-scale power production projects usually use gas turbines with a capacity of more than 200 MW. These power plants are essential to supply the increasing energy demand, particularly in emerging countries or regions that are becoming more industrialized. Additionally, great efficiency and adaptability are frequently built into gas turbines in the >200 MW range. Due to this, they can be utilized in various settings, such as combined cycle plants, peaking power plants, and base-load power production, where they can be linked with steam turbines to increase overall efficiency.
The ≤200 MW segment is expected to be the fastest-growing segment in the market from 2023-2028. Peaking units that supplement renewable energy sources like solar and wind power consist of gas turbines with less than 200 MW capacity. To support intermittent renewable energy output and maintain grid stability, these turbines can swiftly ramp up or down to match variations in energy demand. Moreover, decentralized power generation frequently uses smaller gas turbines, such as those with less than 200 MW capacity. These turbines in distributed power production systems can make energy infrastructure more flexible and resilient.
The combined cycle segment is expected to hold the largest share of the market. The need for technology with less of an impact on the environment has risen as a result of the growing worldwide need for cleaner and more sustainable energy sources. As they emit fewer greenhouse gases per unit of energy produced, combined cycle power plants are generally cleaner than conventional fossil fuel power plants. In addition, compared to single-cycle systems, combined-cycle systems can attain better thermal efficiency. They extract more energy from the fuel by employing a steam turbine to create more power using the waste heat from the gas turbine.
The open cycle segment is anticipated to be the fastest-growing segment in the market from 2023-2028. Open-cycle gas turbines are often perceived as cost-effective solutions, especially in specific industrial applications. As they offer a competitive advantage in terms of initial costs and operational expenses, industries can be more inclined to adopt this technology.
The power & utility segment is expected to hold the largest share of the market. In the power production industry, gas turbines are extensively utilized to generate energy. They are renowned for their effectiveness, adaptability, and rapid starting times, which make them appropriate for supplying the fluctuating demand for power. Gas turbines are a common principal component of many power plants, including combined cycle power plants and peaking facilities. To increase efficiency and lower emissions, many older power plants are currently in the process of being upgraded and modernized. These modifications often opt for gas turbines, particularly the more recent and sophisticated models, which fuels the gas turbine market's growth in the power and utility segment.
The industrial segment is anticipated to be the fastest-growing segment in the market from 2023-2028. The degree of industrialization in a region is frequently correlated with the need for gas turbines in the industrial sector. Gas turbines can provide a suitable solution to the rising requirement for dependable and efficient power-generating options as nations continue to industrialize.
North America is expected to be the largest region in the global market. Natural gas output has increased significantly in North America, mostly as a result of developments in extraction processes like hydraulic fracturing. As a result, natural gas resources are abundant, which makes it an affordable and accessible fuel source. For instance, according to the U.S. Energy Information Administration (EIA) in 2019, coal accounts for more than 40% of the U.S. electricity production, while natural gas accounts for around 25%.
Asia Pacific is anticipated to witness rapid growth during the forecast period. The Asia Pacific region's economy grows as a result of rapid industrialization, which raises the amount invested in energy infrastructure.
To promote long-term economic development, governments and companies are expected to invest in cutting-edge and effective power production technology, such as gas turbines. For instance, Shenzhen Energy Group Corporation Co. placed an equipment order for its Guangming combined cycle power plant in the Guangdong province of China's Shenzhen Guangming region in 2022, according to a joint announcement from GE Gas Power and Harbin Electric.
Ansaldo Energia, Bharat Heavy Electricals Ltd., Centrax Gas Turbines, General Electric, Kawasaki Heavy Industries, Ltd., MAN Energy Solutions, Mitsubishi Power, Ltd., OPRA Turbines, Siemens Energy, and Solar Turbines Inc. among others, are some of the key players operating in the global gas turbine market.
Please note: This is not an exhaustive list of companies profiled in the report.
In 2023, a deal was signed by General Electric and Aksa Power Generation to deliver two extremely efficient GE 6F.03 gas turbines for a new CHP power station in the Kyzylorda region of Kazakhstan.
In 2023, For the Talimarjan-2 TPP Project in Uzbekistan, Mitsubishi Power received an order from Uzbekistan for two steam turbines and two M701F gas turbines. Mitsubishi Power will also send technical consultants to the location to oversee the installation and commissioning procedure.
1 STRATEGIC INSIGHTS ON NEW REVENUE POCKETS
1.1 Strategic Opportunity & Attractiveness Analysis
1.1.1 Hot Revenue Pockets
1.1.2 Market Attractiveness Score
1.1.3 Revenue Impacting Opportunity
1.1.4 High Growing Region/Country
1.1.5 Competitor Analysis
1.1.6 Consumer Analysis
1.2 Global Market Estimates' View
1.3 Strategic Insights across Business Functions
1.3.1 For Chief Executive Officers
1.3.2 For Chief Marketing Officers
1.3.3 For Chief Strategy Officers
1.4 Evaluate the Potential of your Existing Business Lines vs. New Lines to Enter Into
2 TECHNOLOGICAL TRENDS
2.1 Technological Adoption Rate
2.2 Current Trend Impact Analysis
2.3 Future Trend Impact Analysis
3 GLOBAL GAS TURBINE MARKET OUTLOOK
3.1 Market Pyramid Analysis
3.1.1 Introduction
3.1.2 Adjacent Market Opportunities
3.1.3 Ancillary Market Opportunities
3.2 Demand Side Analysis
3.2.1 Market Drivers: Impact Analysis
3.2.2 Market Restraints: Impact Analysis
3.2.3 Market Opportunities: Impact Analysis
3.2.4 Market Challenges: Impact Analysis
3.3 Supply Side Analysis
3.3.1 Porter’s Five Forces Analysis
3.3.1.1 Threat of New Entrants
3.3.1.2 Threat of New Substitutes
3.3.1.3 Bargaining Power of Suppliers
3.3.1.4 Bargaining Power of Buyers
3.3.1.5 Intensity of Competitive Rivalry
3.3.2 SWOT Analysis; By Factor (Political & Legal, Economic, and Technological)
3.3.2.1 Political Landscape
3.3.2.2 Economic Landscape
3.3.2.3 Social Landscape
3.3.2.4 End-use Landscape
3.3.3 Value Chain Analysis
3.3.4 Trend Analysis
3.3.5 Gap Analysis
3.3.6 Cost Analysis
4 GLOBAL GAS TURBINE MARKET, BY CAPACITY
4.1 Introduction
4.2 Gas Turbine Market: Capacity Scope Key Takeaways
4.3 Revenue Growth Analysis, 2022 & 2028
4.4 ≤200 MW
4.4.1 ≤200 MW Market Estimates and Forecast, 2020-2028 (USD Million)
4.5 >200 MW
4.5.1 >200 MW Market Estimates and Forecast, 2020-2028 (USD Million)
5 GLOBAL GAS TURBINE MARKET, BY TECHNOLOGY
5.1 Introduction
5.2 Gas Turbine Market: Technology Scope Key Takeaways
5.3 Revenue Growth Analysis, 2022 & 2028
5.4 Open Cycle
5.4.1 Open Cycle Market Estimates and Forecast, 2020-2028 (USD Million)
5.5 Combined Cycle
5.5.1 Combined Cycle Market Estimates and Forecast, 2020-2028 (USD Million)
6 GLOBAL GAS TURBINE MARKET, BY END-USE
6.1 Introduction
6.2 Gas Turbine Market: End-use Scope Key Takeaways
6.3 Revenue Growth Analysis, 2022 & 2028
6.4 Power & Utility
6.4.1 Power & Utility Market Estimates and Forecast, 2020-2028 (USD Million)
6.5 Industrial
6.5.1 Industrial Market Estimates and Forecast, 2020-2028 (USD Million)
7 GLOBAL GAS TURBINE MARKET, BY REGION
7.1 Introduction
7.2 North America Gas Turbine Market Estimates and Forecast, 2020-2028 (USD Million)
7.2.1 By Capacity
7.2.2 By Technology
7.2.3 By End-use
7.2.4 By Country
7.2.4.1 U.S. Gas Turbine Market Estimates and Forecast, 2020-2028 (USD Million)
7.2.4.1.1 By Capacity
7.2.4.1.2 By Technology
7.2.4.1.3 By End-use
7.2.4.2 Canada Gas Turbine Market Estimates and Forecast, 2020-2028 (USD Million)
7.2.4.2.1 By Capacity
7.2.4.2.2 By Technology
7.2.4.2.3 By End-use
7.2.4.3 Mexico Gas Turbine Market Estimates and Forecast, 2020-2028 (USD Million)
7.2.4.3.1 By Capacity
7.2.4.3.2 By Technology
7.2.4.3.3 By End-use
7.3 Europe Gas Turbine Market Estimates and Forecast, 2020-2028 (USD Million)
7.3.1 By Capacity
7.3.2 By Technology
7.3.3 By End-use
7.3.4 By Country
7.3.4.1 Germany Gas Turbine Market Estimates and Forecast, 2020-2028 (USD Million)
7.3.4.1.1 By Capacity
7.3.4.1.2 By Technology
7.3.4.1.3 By End-use
7.3.4.2 U.K. Gas Turbine Market Estimates and Forecast, 2020-2028 (USD Million)
7.3.4.2.1 By Capacity
7.3.4.2.2 By Technology
7.3.4.2.3 By End-use
7.3.4.3 France Gas Turbine Market Estimates and Forecast, 2020-2028 (USD Million)
7.3.4.3.1 By Capacity
7.3.4.3.2 By Technology
7.3.4.3.3 By End-use
7.3.4.4 Italy Gas Turbine Market Estimates and Forecast, 2020-2028 (USD Million)
7.3.4.4.1 By Capacity
7.3.4.4.2 By Technology
7.2.4.4.3 By End-use
7.3.4.5 Spain Gas Turbine Market Estimates and Forecast, 2020-2028 (USD Million)
7.3.4.5.1 By Capacity
7.3.4.5.2 By Technology
7.2.4.5.3 By End-use
7.3.4.6 Netherlands Gas Turbine Market Estimates and Forecast, 2020-2028 (USD Million)
7.3.4.6.1 By Capacity
7.3.4.6.2 By Technology
7.2.4.6.3 By End-use
7.3.4.7 Rest of Europe Gas Turbine Market Estimates and Forecast, 2020-2028 (USD Million)
7.3.4.7.1 By Capacity
7.3.4.7.2 By Technology
7.2.4.7.3 By End-use
7.4 Asia Pacific Gas Turbine Market Estimates and Forecast, 2020-2028 (USD Million)
7.4.1 By Capacity
7.4.2 By Technology
7.4.3 By End-use
7.4.4 By Country
7.4.4.1 China Gas Turbine Market Estimates and Forecast, 2020-2028 (USD Million)
7.4.4.1.1 By Capacity
7.4.4.1.2 By Technology
7.4.4.1.3 By End-use
7.4.4.2 Japan Gas Turbine Market Estimates and Forecast, 2020-2028 (USD Million)
7.4.4.2.1 By Capacity
7.4.4.2.2 By Technology
7.4.4.2.3 By End-use
7.4.4.3 India Gas Turbine Market Estimates and Forecast, 2020-2028 (USD Million)
7.4.4.3.1 By Capacity
7.4.4.3.2 By Technology
7.4.4.3.3 By End-use
7.4.4.4 South Korea Gas Turbine Market Estimates and Forecast, 2020-2028 (USD Million)
7.4.4.4.1 By Capacity
7.4.4.4.2 By Technology
7.4.4.4.3 By End-use
7.4.4.5 Singapore Gas Turbine Market Estimates and Forecast, 2020-2028 (USD Million)
7.4.4.5.1 By Capacity
7.4.4.5.2 By Technology
7.4.4.5.3 By End-use
7.4.4.6 Malaysia Gas Turbine Market Estimates and Forecast, 2020-2028 (USD Million)
7.4.4.6.1 By Capacity
7.4.4.6.2 By Technology
7.4.4.6.3 By End-use
7.4.4.7 Thailand Gas Turbine Market Estimates and Forecast, 2020-2028 (USD Million)
7.4.4.7.1 By Capacity
7.4.4.7.2 By Technology
7.4.4.7.3 By End-use
7.4.4.8 Indonesia Gas Turbine Market Estimates and Forecast, 2020-2028 (USD Million)
7.4.4.8.1 By Capacity
7.4.4.8.2 By Technology
7.4.4.8.3 By End-use
7.4.4.9 Vietnam Gas Turbine Market Estimates and Forecast, 2020-2028 (USD Million)
7.4.4.9.1 By Capacity
7.4.4.9.2 By Technology
7.4.4.9.3 By End-use
7.4.4.10 Taiwan Gas Turbine Market Estimates and Forecast, 2020-2028 (USD Million)
7.4.4.10.1 By Capacity
7.4.4.10.2 By Technology
7.4.4.10.3 By End-use
7.4.4.11 Rest of Asia Pacific Gas Turbine Market Estimates and Forecast, 2020-2028 (USD Million)
7.4.4.11.1 By Capacity
7.4.4.11.2 By Technology
7.4.4.11.3 By End-use
7.5 Middle East and Africa Gas Turbine Market Estimates and Forecast, 2020-2028 (USD Million)
7.5.1 By Capacity
7.5.2 By Technology
7.5.3 By End-use
7.5.4 By Country
7.5.4.1 Saudi Arabia Gas Turbine Market Estimates and Forecast, 2020-2028 (USD Million)
7.5.4.1.1 By Capacity
7.5.4.1.2 By Technology
7.5.4.1.3 By End-use
7.5.4.2 U.A.E. Gas Turbine Market Estimates and Forecast, 2020-2028 (USD Million)
7.5.4.2.1 By Capacity
7.5.4.2.2 By Technology
7.5.4.2.3 By End-use
7.5.4.3 Israel Gas Turbine Market Estimates and Forecast, 2020-2028 (USD Million)
7.5.4.3.1 By Capacity
7.5.4.3.2 By Technology
7.5.4.3.3 By End-use
7.5.4.4 South Africa Gas Turbine Market Estimates and Forecast, 2020-2028 (USD Million)
7.5.4.4.1 By Capacity
7.5.4.4.2 By Technology
7.5.4.4.3 By End-use
7.5.4.5 Rest of Middle East and Africa Gas Turbine Market Estimates and Forecast, 2020-2028 (USD Million)
7.5.4.5.1 By Capacity
7.5.4.5.2 By Technology
7.5.4.5.2 By End-use
7.6 Central and South America Gas Turbine Market Estimates and Forecast, 2020-2028 (USD Million)
7.6.1 By Capacity
7.6.2 By Technology
7.6.3 By End-use
7.6.4 By Country
7.6.4.1 Brazil Gas Turbine Market Estimates and Forecast, 2020-2028 (USD Million)
7.6.4.1.1 By Capacity
7.6.4.1.2 By Technology
7.6.4.1.3 By End-use
7.6.4.2 Argentina Gas Turbine Market Estimates and Forecast, 2020-2028 (USD Million)
7.6.4.2.1 By Capacity
7.6.4.2.2 By Technology
7.6.4.2.3 By End-use
7.6.4.3 Chile Gas Turbine Market Estimates and Forecast, 2020-2028 (USD Million)
7.6.4.3.1 By Capacity
7.6.4.3.2 By Technology
7.6.4.3.3 By End-use
7.6.4.4 Rest of Central and South America Gas Turbine Market Estimates and Forecast, 2020-2028 (USD Million)
7.6.4.4.1 By Capacity
7.6.4.4.2 By Technology
7.6.4.4.3 By End-use
8 COMPETITIVE LANDCAPE
8.1 Company Market Share Analysis
8.2 Four Quadrant Positioning Matrix
8.2.1 Market Leaders
8.2.2 Market Visionaries
8.2.3 Market Challengers
8.2.4 Niche Market Players
8.3 Vendor Landscape
8.3.1 North America
8.3.2 Europe
8.3.3 Asia Pacific
8.3.4 Rest of the World
8.4 Company Profiles
8.4.1 Ansaldo Energia
8.4.1.1 Business Description & Financial Analysis
8.4.1.2 SWOT Analysis
8.4.1.3 Products & Services Offered
8.4.1.4 Strategic Alliances between Business Partners
8.4.2 Bharat Heavy Electricals Ltd.
8.4.2.1 Business Description & Financial Analysis
8.4.2.2 SWOT Analysis
8.4.2.3 Products & Services Offered
8.4.2.4 Strategic Alliances between Business Partners
8.4.3 Centrax Gas Turbines
8.4.3.1 Business Description & Financial Analysis
8.4.3.2 SWOT Analysis
8.4.3.3 Products & Services Offered
8.4.3.4 Strategic Alliances between Business Partners
8.4.4 General Electric
8.4.4.1 Business Description & Financial Analysis
8.4.4.2 SWOT Analysis
8.4.4.3 Products & Services Offered
8.4.4.4 Strategic Alliances between Business Partners
8.4.5 Kawasaki Heavy Industries, Ltd.
8.4.5.1 Business Description & Financial Analysis
8.4.5.2 SWOT Analysis
8.4.5.3 Products & Services Offered
8.4.5.4 Strategic Alliances between Business Partners
8.4.6 MAN ENERGY SOLUTIONS
8.4.6.1 Business Description & Financial Analysis
8.4.6.2 SWOT Analysis
8.4.6.3 Products & Services Offered
8.4.6.4 Strategic Alliances between Business Partners
8.4.7 Mitsubishi Power, Ltd.
8.4.7.1 Business Description & Financial Analysis
8.4.7.2 SWOT Analysis
8.4.7.3 Products & Services Offered
8.4.8.4 Strategic Alliances between Business Partners
8.4.8 OPRA Turbines
8.4.8.1 Business Description & Financial Analysis
8.4.8.2 SWOT Analysis
8.4.8.3 Products & Services Offered
8.4.8.4 Strategic Alliances between Business Partners
8.4.9 Siemens Energy
8.4.9.1 Business Description & Financial Analysis
8.4.9.2 SWOT Analysis
8.4.9.3 Products & Services Offered
8.4.9.4 Strategic Alliances between Business Partners
8.4.10 Solar Turbines Inc.
8.4.10.1 Business Description & Financial Analysis
8.4.10.2 SWOT Analysis
8.4.10.3 Products & Services Offered
8.4.10.4 Strategic Alliances between Business Partners
8.4.11 Other Companies
8.4.11.1 Business Description & Financial Analysis
8.4.11.2 SWOT Analysis
8.4.11.3 Products & Services Offered
8.4.11.4 Strategic Alliances between Business Partners
9 RESEARCH METHODOLOGY
9.1 Market Introduction
9.1.1 Market Definition
9.1.2 Market Scope & Segmentation
9.2 Information Procurement
9.2.1 Secondary Research
9.2.1.1 Purchased Databases
9.2.1.2 GMEs Internal Data Repository
9.2.1.3 Secondary Resources & Third Party Perspectives
9.2.1.4 Company Information Sources
9.2.2 Primary Research
9.2.2.1 Various Types of Respondents for Primary Interviews
9.2.2.2 Number of Interviews Conducted throughout the Research Process
9.2.2.3 Primary Stakeholders
9.2.2.4 Discussion Guide for Primary Participants
9.2.3 Expert Panels
9.2.3.1 Expert Panels Across 30+ Industry
9.2.4 Paid Local Experts
9.2.4.1 Paid Local Experts Across 30+ Industry Across each Region
9.3 Market Estimation
9.3.1 Top-Down Approach
9.3.1.1 Macro-Economic Indicators Considered
9.3.1.2 Micro-Economic Indicators Considered
9.3.2 Bottom Up Approach
9.3.2.1 Company Share Analysis Approach
9.3.2.2 Estimation of Potential Capacity Sales
9.4 Data Triangulation
9.4.1 Data Collection
9.4.2 Time Series, Cross Sectional & Panel Data Analysis
9.4.3 Cluster Analysis
9.5 Analysis and Output
9.5.1 Inhouse AI Based Real Time Analytics Tool
9.5.2 Output From Desk & Primary Research
9.6 Research Assumptions & Limitations
9.7.1 Research Assumptions
9.7.2 Research Limitations
LIST OF TABLES
1 Global Gas Turbine Market, By Capacity, 2020-2028 (USD Mllion)
2 ≤200 MW Market, By Region, 2020-2028 (USD Mllion)
3 >200 MW Market, By Region, 2020-2028 (USD Mllion)
4 Global Gas Turbine Market, By Technology, 2020-2028 (USD Mllion)
5 Open Cycle Market, By Region, 2020-2028 (USD Mllion)
6 Combined Cycle Market, By Region, 2020-2028 (USD Mllion)
7 Global Gas Turbine Market, By End-use, 2020-2028 (USD Mllion)
8 Power & Utility Market, By Region, 2020-2028 (USD Mllion)
9 Industrial Market, By Region, 2020-2028 (USD Mllion)
10 Regional Analysis, 2020-2028 (USD Mllion)
11 North America Gas Turbine Market, By Capacity, 2020-2028 (USD Million)
12 North America Gas Turbine Market, By Technology, 2020-2028 (USD Million)
13 North America Gas Turbine Market, By End-use, 2020-2028 (USD Million)
14 North America Gas Turbine Market, By Country, 2020-2028 (USD Million)
15 U.S Gas Turbine Market, By Capacity, 2020-2028 (USD Million)
16 U.S Gas Turbine Market, By Technology, 2020-2028 (USD Million)
17 U.S Gas Turbine Market, By End-use, 2020-2028 (USD Million)
18 Canada Gas Turbine Market, By Capacity, 2020-2028 (USD Million)
19 Canada Gas Turbine Market, By Technology, 2020-2028 (USD Million)
20 Canada Gas Turbine Market, By End-use, 2020-2028 (USD Million)
21 Mexico Gas Turbine Market, By Capacity, 2020-2028 (USD Million)
22 Mexico Gas Turbine Market, By Technology, 2020-2028 (USD Million)
23 Mexico Gas Turbine Market, By End-use, 2020-2028 (USD Million)
24 Europe Gas Turbine Market, By Capacity, 2020-2028 (USD Million)
25 Europe Gas Turbine Market, By Technology, 2020-2028 (USD Million)
26 Europe Gas Turbine Market, By End-use, 2020-2028 (USD Million)
27 Europe Gas Turbine Market, By Country 2020-2028 (USD Million)
28 Germany Gas Turbine Market, By Capacity, 2020-2028 (USD Million)
29 Germany Gas Turbine Market, By Technology, 2020-2028 (USD Million)
30 Germany Gas Turbine Market, By End-use, 2020-2028 (USD Million)
31 U.K Gas Turbine Market, By Capacity, 2020-2028 (USD Million)
32 U.K Gas Turbine Market, By Technology, 2020-2028 (USD Million)
33 U.K Gas Turbine Market, By End-use, 2020-2028 (USD Million)
34 France Gas Turbine Market, By Capacity, 2020-2028 (USD Million)
35 France Gas Turbine Market, By Technology, 2020-2028 (USD Million)
36 France Gas Turbine Market, By End-use, 2020-2028 (USD Million)
37 Italy Gas Turbine Market, By Capacity, 2020-2028 (USD Million)
38 Italy Gas Turbine Market, By Technology, 2020-2028 (USD Million)
39 Italy Gas Turbine Market, By End-use, 2020-2028 (USD Million)
40 Spain Gas Turbine Market, By Capacity, 2020-2028 (USD Million)
41 Spain Gas Turbine Market, By Technology, 2020-2028 (USD Million)
42 Spain Gas Turbine Market, By End-use, 2020-2028 (USD Million)
43 Netherlands Gas Turbine Market, By Capacity, 2020-2028 (USD Million)
44 Netherlands Gas Turbine Market, By Technology, 2020-2028 (USD Million)
45 Netherlands Gas Turbine Market, By End-use, 2020-2028 (USD Million)
46 Rest Of Europe Gas Turbine Market, By Capacity, 2020-2028 (USD Million)
47 Rest Of Europe Gas Turbine Market, By Technology, 2020-2028 (USD Million)
48 Rest of Europe Gas Turbine Market, By End-use, 2020-2028 (USD Million)
49 Asia Pacific Gas Turbine Market, By Capacity, 2020-2028 (USD Million)
50 Asia Pacific Gas Turbine Market, By Technology, 2020-2028 (USD Million)
51 Asia Pacific Gas Turbine Market, By End-use, 2020-2028 (USD Million)
52 Asia Pacific Gas Turbine Market, By Country, 2020-2028 (USD Million)
53 China Gas Turbine Market, By Capacity, 2020-2028 (USD Million)
54 China Gas Turbine Market, By Technology, 2020-2028 (USD Million)
55 China Gas Turbine Market, By End-use, 2020-2028 (USD Million)
56 India Gas Turbine Market, By Capacity, 2020-2028 (USD Million)
57 India Gas Turbine Market, By Technology, 2020-2028 (USD Million)
58 India Gas Turbine Market, By End-use, 2020-2028 (USD Million)
59 Japan Gas Turbine Market, By Capacity, 2020-2028 (USD Million)
60 Japan Gas Turbine Market, By Technology, 2020-2028 (USD Million)
61 Japan Gas Turbine Market, By End-use, 2020-2028 (USD Million)
62 South Korea Gas Turbine Market, By Capacity, 2020-2028 (USD Million)
63 South Korea Gas Turbine Market, By Technology, 2020-2028 (USD Million)
64 South Korea Gas Turbine Market, By End-use, 2020-2028 (USD Million)
65 malaysia Gas Turbine Market, By Capacity, 2020-2028 (USD Million)
66 malaysia Gas Turbine Market, By Technology, 2020-2028 (USD Million)
67 malaysia Gas Turbine Market, By End-use, 2020-2028 (USD Million)
68 Thailand Gas Turbine Market, By Capacity, 2020-2028 (USD Million)
69 Thailand Gas Turbine Market, By Technology, 2020-2028 (USD Million)
70 Thailand Gas Turbine Market, By End-use, 2020-2028 (USD Million)
71 Indonesia Gas Turbine Market, By Capacity, 2020-2028 (USD Million)
72 Indonesia Gas Turbine Market, By Technology, 2020-2028 (USD Million)
73 Indonesia Gas Turbine Market, By End-use, 2020-2028 (USD Million)
74 Vietnam Gas Turbine Market, By Capacity, 2020-2028 (USD Million)
75 Vietnam Gas Turbine Market, By Technology, 2020-2028 (USD Million)
76 Vietnam Gas Turbine Market, By End-use, 2020-2028 (USD Million)
77 Taiwan Gas Turbine Market, By Capacity, 2020-2028 (USD Million)
78 Taiwan Gas Turbine Market, By Technology, 2020-2028 (USD Million)
79 Taiwan Gas Turbine Market, By End-use, 2020-2028 (USD Million)
80 Rest of Asia Pacific Gas Turbine Market, By Capacity, 2020-2028 (USD Million)
81 Rest of Asia Pacific Gas Turbine Market, By Technology, 2020-2028 (USD Million)
82 Rest of Asia Pacific Gas Turbine Market, By End-use, 2020-2028 (USD Million)
83 Middle East and Africa Gas Turbine Market, By Capacity, 2020-2028 (USD Million)
84 Middle East and Africa Gas Turbine Market, By Technology, 2020-2028 (USD Million)
85 Middle East and Africa Gas Turbine Market, By End-use, 2020-2028 (USD Million)
86 Middle East and Africa Gas Turbine Market, By Country, 2020-2028 (USD Million)
87 Saudi Arabia Gas Turbine Market, By Capacity, 2020-2028 (USD Million)
88 Saudi Arabia Gas Turbine Market, By Technology, 2020-2028 (USD Million)
89 Saudi Arabia Gas Turbine Market, By End-use, 2020-2028 (USD Million)
90 UAE Gas Turbine Market, By Capacity, 2020-2028 (USD Million)
91 UAE Gas Turbine Market, By Technology, 2020-2028 (USD Million)
92 UAE Gas Turbine Market, By End-use, 2020-2028 (USD Million)
93 Israel Gas Turbine Market, By Capacity, 2020-2028 (USD Million)
94 Israel Gas Turbine Market, By Technology, 2020-2028 (USD Million)
95 Israel Gas Turbine Market, By End-use, 2020-2028 (USD Million)
96 South Africa Gas Turbine Market, By Capacity, 2020-2028 (USD Million)
97 South Africa Gas Turbine Market, By Technology, 2020-2028 (USD Million)
98 South Africa Gas Turbine Market, By End-use, 2020-2028 (USD Million)
99 Rest of Middle East and Africa Gas Turbine Market, By Capacity, 2020-2028 (USD Million)
100 Rest of Middle East and Africa Gas Turbine Market, By Technology, 2020-2028 (USD Million)
101 Rest of Middle East and Africa Gas Turbine Market, By End-use, 2020-2028 (USD Million)
102 Central and South America Gas Turbine Market, By Capacity, 2020-2028 (USD Million)
103 Central and South America Gas Turbine Market, By Technology, 2020-2028 (USD Million)
104 Central and South America Gas Turbine Market, By End-use, 2020-2028 (USD Million)
105 Central and South America Gas Turbine Market, By Country, 2020-2028 (USD Million)
106 Brazil Gas Turbine Market, By Capacity, 2020-2028 (USD Million)
107 Brazil Gas Turbine Market, By Technology, 2020-2028 (USD Million)
108 Brazil Gas Turbine Market, By End-use, 2020-2028 (USD Million)
109 Argentina Gas Turbine Market, By Capacity, 2020-2028 (USD Million)
110 Argentina Gas Turbine Market, By Technology, 2020-2028 (USD Million)
111 Argentina Gas Turbine Market, By End-use, 2020-2028 (USD Million)
112 Chile Gas Turbine Market, By Capacity, 2020-2028 (USD Million)
113 Chile Gas Turbine Market, By Technology, 2020-2028 (USD Million)
114 Chile Gas Turbine Market, By End-use, 2020-2028 (USD Million)
115 Rest of Central and South America Gas Turbine Market, By Capacity, 2020-2028 (USD Million)
116 Rest of Central and South America Gas Turbine Market, By Technology, 2020-2028 (USD Million)
117 Rest of Central and South America Gas Turbine Market, By End-use, 2020-2028 (USD Million)
118 Ansaldo Energia: Products & Services Offering
119 Bharat Heavy Electricals Ltd.: Products & Services Offering
120 Centrax Gas Turbines: Products & Services Offering
121 General Electric: Products & Services Offering
122 Kawasaki Heavy Industries, Ltd.: Products & Services Offering
123 MAN ENERGY SOLUTIONS: Products & Services Offering
124 Mitsubishi Power, Ltd. : Products & Services Offering
125 OPRA Turbines: Products & Services Offering
126 Siemens Energy, Inc: Products & Services Offering
127 Solar Turbines Inc.: Products & Services Offering
128 Other Companies: Products & Services Offering
LIST OF FIGURES
1 Global Gas Turbine Market Overview
2 Global Gas Turbine Market Value From 2020-2028 (USD Mllion)
3 Global Gas Turbine Market Share, By Capacity (2022)
4 Global Gas Turbine Market Share, By Technology (2022)
5 Global Gas Turbine Market Share, By End-use (2022)
6 Global Gas Turbine Market, By Region (Asia Pacific Market)
7 Technological Trends In Global Gas Turbine Market
8 Four Quadrant Competitor Positioning Matrix
9 Impact Of Macro & Micro Indicators On The Market
10 Impact Of Key Drivers On The Global Gas Turbine Market
11 Impact Of Challenges On The Global Gas Turbine Market
12 Porter’s Five Forces Analysis
13 Global Gas Turbine Market: By Capacity Scope Key Takeaways
14 Global Gas Turbine Market, By Capacity Segment: Revenue Growth Analysis
15 ≤200 MW Market, By Region, 2020-2028 (USD Mllion)
16 >200 MW Market, By Region, 2020-2028 (USD Mllion)
17 Global Gas Turbine Market: By Technology Scope Key Takeaways
18 Global Gas Turbine Market, By Technology Segment: Revenue Growth Analysis
19 Open Cycle Market, By Region, 2020-2028 (USD Mllion)
20 Combined Cycle Market, By Region, 2020-2028 (USD Mllion)
21 Global Gas Turbine Market: By End-use Scope Key Takeaways
22 Global Gas Turbine Market, By End-use Segment: Revenue Growth Analysis
23 Power & Utility Market, By Region, 2020-2028 (USD Mllion)
24 Industrial Market, By Region, 2020-2028 (USD Mllion)
25 Regional Segment: Revenue Growth Analysis
26 Global Gas Turbine Market: Regional Analysis
27 North America Gas Turbine Market Overview
28 North America Gas Turbine Market, By Capacity
29 North America Gas Turbine Market, By Technology
30 North America Gas Turbine Market, By End-use
31 North America Gas Turbine Market, By Country
32 U.S. Gas Turbine Market, By Capacity
33 U.S. Gas Turbine Market, By Technology
34 U.S. Gas Turbine Market, By End-use
35 Canada Gas Turbine Market, By Capacity
36 Canada Gas Turbine Market, By Technology
37 Canada Gas Turbine Market, By End-use
38 Mexico Gas Turbine Market, By Capacity
39 Mexico Gas Turbine Market, By Technology
40 Mexico Gas Turbine Market, By End-use
41 Four Quadrant Positioning Matrix
42 Company Market Share Analysis
43 Ansaldo Energia: Company Snapshot
44 Ansaldo Energia: SWOT Analysis
45 Ansaldo Energia: Geographic Presence
46 Bharat Heavy Electricals Ltd.: Company Snapshot
47 Bharat Heavy Electricals Ltd.: SWOT Analysis
48 Bharat Heavy Electricals Ltd.: Geographic Presence
49 Centrax Gas Turbines: Company Snapshot
50 Centrax Gas Turbines: SWOT Analysis
51 Centrax Gas Turbines: Geographic Presence
52 General Electric: Company Snapshot
53 General Electric: Swot Analysis
54 General Electric: Geographic Presence
55 Kawasaki Heavy Industries, Ltd.: Company Snapshot
56 Kawasaki Heavy Industries, Ltd.: SWOT Analysis
57 Kawasaki Heavy Industries, Ltd.: Geographic Presence
58 MAN ENERGY SOLUTIONS: Company Snapshot
59 MAN ENERGY SOLUTIONS: SWOT Analysis
60 MAN ENERGY SOLUTIONS: Geographic Presence
61 Mitsubishi Power, Ltd. : Company Snapshot
62 Mitsubishi Power, Ltd. : SWOT Analysis
63 Mitsubishi Power, Ltd. : Geographic Presence
64 OPRA Turbines: Company Snapshot
65 OPRA Turbines: SWOT Analysis
66 OPRA Turbines: Geographic Presence
67 Siemens Energy, Inc.: Company Snapshot
68 Siemens Energy, Inc.: SWOT Analysis
69 Siemens Energy, Inc.: Geographic Presence
70 Solar Turbines Inc.: Company Snapshot
71 Solar Turbines Inc.: SWOT Analysis
72 Solar Turbines Inc.: Geographic Presence
73 Other Companies: Company Snapshot
74 Other Companies: SWOT Analysis
75 Other Companies: Geographic Presence
The Global Gas Turbine Market has been studied from the year 2019 till 2028. However, the CAGR provided in the report is from the year 2023 to 2028. The research methodology involved three stages: Desk research, Primary research, and Analysis & Output from the entire research process.

The desk research involved a robust background study which meant referring to paid and unpaid databases to understand the market dynamics; mapping contracts from press releases; identifying the key players in the market, studying their product portfolio, competition level, annual reports/SEC filings & investor presentations; and learning the demand and supply-side analysis for the Gas Turbine Market.

The primary research activity included telephonic conversations with more than 50 tier 1 industry consultants, distributors, and end-use product manufacturers.

Finally, based on the above thorough research process, an in-depth analysis was carried out considering the following aspects: market attractiveness, current & future market trends, market share analysis, SWOT analysis of the company and customer analytics.

Frequently Asked Questions

This FREE sample includes market data points, ranging from trend analyses to market estimates & forecasts. See for yourself.
Or view our licence options:
Tailor made solutions just for you
80% of our clients seek made-to-order reports. How do you want us to tailor yours?
OUR CLIENTS


