This report was recently updated on April 12 2024 with the latest and most recent
market numbers
Global Sustainable Seafood Market Size, Trends & Analysis - Forecasts to 2028 By Product Type (Bivalves and Other Molluscs and Aquatic Invertebrates, Cephalopods, Crustaceans, Flatfish, Freshwater Fish, Groundfish, Salmonids, Small Pelagics, Tuna and Tuna-like Species, and Others), By Form (Chilled, Frozen, Canned, and Others), By Distribution Channel (Hypermarkets, Supermarkets, Convenience Stores, Specialty Stores, Online, and Others), and By Region (North America, Asia Pacific, Central and South America, Europe, and Middle East and Africa), Competitive Landscape, Company Market Share Analysis, and End User Analysis
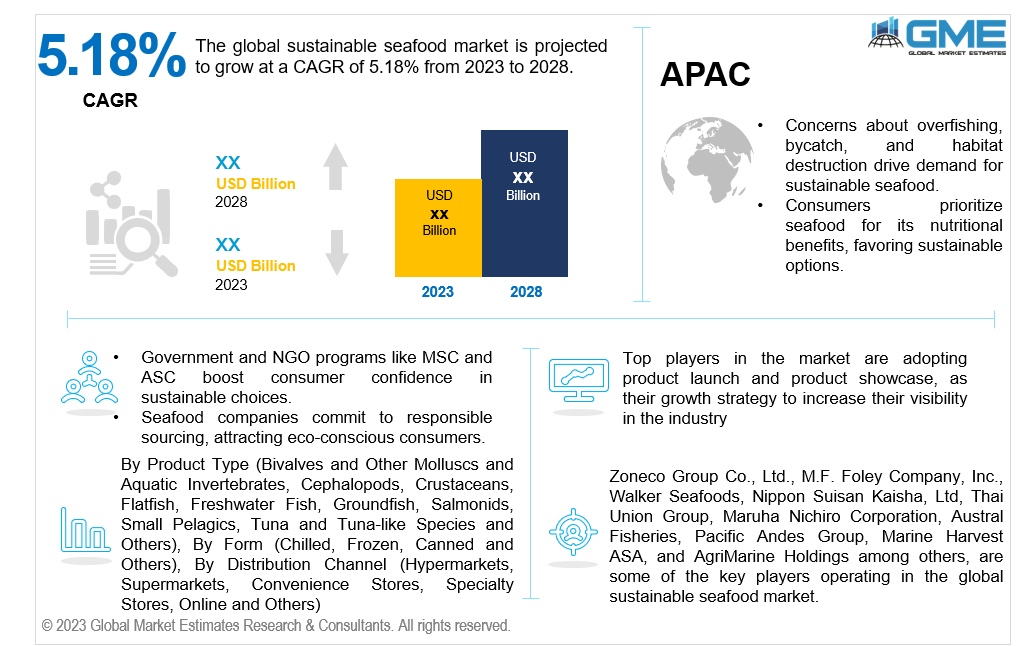
The global sustainable seafood market is projected to grow at a CAGR of 5.18% from 2023 to 2028.
Heightened consumer awareness of the importance of responsible and eco-friendly fishing practices has increased demand for sustainable seafood products. Regulations that promote responsible and sustainable fishing and sustainable aquaculture practices have a significant impact on the industry's growth, ensuring that seafood products meet specific standards. Growing environmental concerns, such as overfishing and habitat destruction, contribute to the market's growth as consumers seek to support sustainable, ethical seafood choices that mitigate these issues.
Industry certifications like the Marine Stewardship Council (MSC) provide a clear and recognizable sustainable seafood label. Major sustainable seafood supply chains like McDonald's, Starbucks, Subway, and others are actively incorporating sustainable seafood into their menus, thereby contributing to the expansion of the sustainable seafood market.
Companies operating in the sustainable seafood industry are increasingly adopting sustainable sourcing practices and promoting eco-friendly fishing methods. Their efforts have expanded the availability of sustainable seafood products. Advances in fishing technologies and aquaculture practices are facilitating responsible seafood sourcing, improving traceability, and enhancing overall sustainability, further stimulating market growth.
The market faces certain restraints. Implementing and maintaining sustainable fishing and aquaculture practices can be more expensive than traditional, less sustainable methods. This can put financial pressure on industry participants and result in higher prices for sustainable seafood products. Climate change can disrupt marine ecosystems, impacting the availability of sustainable seafood. Changing water temperatures and ocean acidification can threaten fish stocks and habitats.
Bivalves and other molluscs and aquatic invertebrates segment is expected to hold the largest share of the market during the forecast period. This category includes seafood such as clams, mussels, oysters, and other shellfish, as well as aquatic invertebrates like sea urchins. They are often considered sustainable because their farming practices have a lower environmental impact, and they are filter feeders that help improve water quality.
Crustacean’s segment is expected to be the fastest-growing segment in the market from 2023-2028. This growth is due to increasing consumer demand for responsibly sourced seafood, as well as improved aquaculture and fishing practices. Crustaceans, including shrimp and lobster, are popular seafood choices worldwide. Consumers increasingly seek responsibly sourced and sustainably harvested or farmed crustaceans due to environmental and ethical concerns. Additionally, certification bodies like the Aquaculture Stewardship Council (ASC) have developed standards for responsible crustacean aquaculture, promoting the growth of sustainably farmed shrimp and other crustaceans.
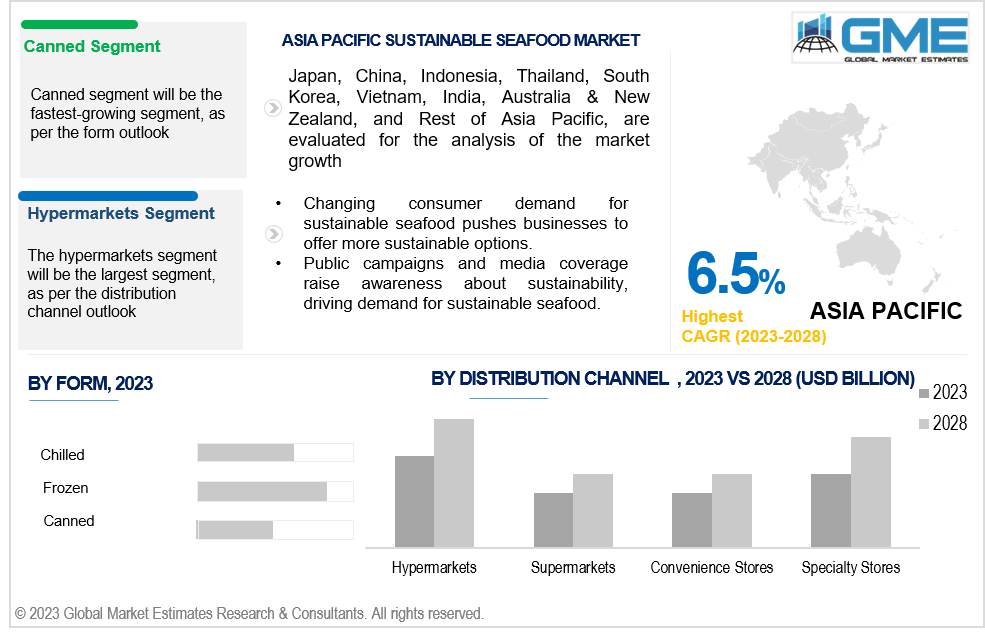
Canned segment is anticipated to be the fastest-growing segment in the market from 2023-2028. Canned seafood products are convenient and have a longer shelf life, making them attractive to consumers seeking easy meal solutions. They are also less perishable than fresh or chilled seafood, which can contribute to their popularity.
The chilled segment is expected to hold the largest share of the market. Chilled seafood is highly valued for its freshness and superior quality. Many consumers prefer seafood that has not been frozen, as freezing can sometimes affect the taste and texture of the product. Chilled seafood, when handled and stored correctly, maintains its flavor and texture, making it a preferred choice for consumers seeking high-quality seafood.
The online segment is anticipated to be the fastest-growing segment in the market from 2023-2028. Sustainable seafood is increasingly available through online retailers and e-commerce platforms. This gives consumers the convenience of ordering sustainable seafood products for home delivery.
The hypermarkets segment is expected to hold the largest share of the market. The growth is attributed to the consumer's increasing interest in purchasing sustainable and responsibly sourced seafood. Hypermarkets aim to meet this demand by offering various products, including sustainable seafood options. Hypermarkets, in particular, are known for providing a vast range of products within one place. This "one-stop shopping" concept allows consumers to conveniently purchase not only groceries but also a variety of other items, including sustainable seafood.
North America is expected to be the largest region in the market. The primary reasons boosting the market growth in this region include increasing preference towards sustainably sourced seafood products. This preference is fuelled by a heightened awareness of the environmental and social challenges linked to the seafood industry. Consumers in the region are not only aware but also willing to pay more for seafood products that adhere to sustainability standards. This increasing sustainable seafood consumption has prompted retailers and restaurants to incorporate these products in their offerings.
Asia Pacific is predicted to witness rapid growth during the forecast period. The region is witnessing a surge in the popularity of seafood, mainly due to the increasing partnerships, innovative products, and the growing appeal of seafood cuisines. For instance, in 2021, collaborations between Pacific Seafood and Amazon Go, with the introduction of value-added seafood products, highlight a trend of innovation and investment in the seafood market. Amazon's commitment to offering numerous value-added seafood items each quarter indicates a strong demand for such products.
Zoneco Group Co., Ltd., M.F. Foley Company, Inc., Walker Seafoods, Nippon Suisan Kaisha, Ltd, Thai Union Group, Maruha Nichiro Corporation,Austral Fisheries, Pacific Andes Group, Marine Harvest ASA, and AgriMarine Holdings among others, are some of the key players operating in the global sustainable seafood market.
Please note: This is not an exhaustive list of companies profiled in the report.
In March 2023, Nissui Corporation announced the commencement of its land-based aquaculture business for whiteleg shrimp (Litopenaeus vannamei).
In March 2022, Thai Union Group, a major seafood company, partnered with Sustainable Fisheries Partnership (SFP) to enhance transparency in its supply chains and promote biodiversity conservation.
1 STRATEGIC INSIGHTS ON NEW REVENUE POCKETS
1.1 Strategic Opportunity & Attractiveness Analysis
1.1.1 Hot Revenue Pockets
1.1.2 Market Attractiveness Score
1.1.3 Revenue Impacting Opportunity
1.1.4 High Growing Region/Country
1.1.5 Competitor Analysis
1.1.6 Consumer Analysis
1.2 Global Market Estimates' View
1.3 Strategic Insights across Business Functions
1.3.1 For Chief Executive Officers
1.3.2 For Chief Marketing Officers
1.3.3 For Chief Strategy Officers
1.4 Evaluate the Potential of your Existing Business Lines vs. New Lines to Enter Into
2 TECHNOLOGICAL TRENDS
2.1 Technological Adoption Rate
2.2 Current Trend Impact Analysis
2.3 Future Trend Impact Analysis
3 GLOBAL SUSTAINABLE SEAFOOD MARKET OUTLOOK
3.1 Market Pyramid Analysis
3.1.1 Introduction
3.1.2 Adjacent Market Opportunities
3.1.3 Ancillary Market Opportunities
3.2 Demand Side Analysis
3.2.1 Market Drivers: Impact Analysis
3.2.2 Market Restraints: Impact Analysis
3.2.3 Market Opportunities: Impact Analysis
3.2.4 Market Challenges: Impact Analysis
3.3 Supply Side Analysis
3.3.1 Porter’s Five Forces Analysis
3.3.1.1 Threat of New Entrants
3.3.1.2 Threat of New Substitutes
3.3.1.3 Bargaining Power of Suppliers
3.3.1.4 Bargaining Power of Buyers
3.3.1.5 Intensity of Competitive Rivalry
3.3.2 SWOT Analysis; By Factor (Political & Legal, Economic, and Technological)
3.3.2.1 Political Landscape
3.3.2.2 Economic Landscape
3.3.2.3 Social Landscape
3.3.2.4 Technology Landscape
3.3.3 Value Chain Analysis
3.3.4 Trend Analysis
3.3.5 Gap Analysis
3.3.6 Cost Analysis
4 GLOBAL SUSTAINABLE SEAFOOD MARKET, BY PRODUCT TYPE
4.1 Introduction
4.2 Sustainable Seafood Market: Product Type Scope Key Takeaways
4.3 Revenue Growth Analysis, 2022 & 2028
4.4 Bivalves and Other Molluscs and Aquatic Invertebrates
4.4.1 Bivalves and Other Molluscs and Aquatic Invertebrates Market Estimates and Forecast, 2020-2028 (USD Million)
4.5 Cephalopods
4.5.1 Cephalopods Market Estimates and Forecast, 2020-2028 (USD Million)
4.6 Crustaceans
4.6.1 Crustaceans Market Estimates and Forecast, 2020-2028 (USD Million)
4.7 Flatfish
4.7.1 Flatfish Market Estimates and Forecast, 2020-2028 (USD Million)
4.8 Freshwater Fish
4.8.1 Freshwater Fish Market Estimates and Forecast, 2020-2028 (USD Million)
4.9 Groundfish
4.9.1 Groundfish Market Estimates and Forecast, 2020-2028 (USD Million)
4.10 Salmonids
4.10.1 Salmonids Market Estimates and Forecast, 2020-2028 (USD Million)
4.11 Small Pelagics
4.11.1 Small Pelagics Market Estimates and Forecast, 2020-2028 (USD Million)
4.12 Tuna and Tuna-like Species
4.12.1 Tuna and Tuna-like Species Market Estimates and Forecast, 2020-2028 (USD Million)
4.13 Others
4.13.1 Others Market Estimates and Forecast, 2020-2028 (USD Million)
5 GLOBAL SUSTAINABLE SEAFOOD MARKET, BY FORM
5.1 Introduction
5.2 Sustainable Seafood Market: Form Scope Key Takeaways
5.3 Revenue Growth Analysis, 2022 & 2028
5.4 Chilled
5.4.1 Chilled Market Estimates and Forecast, 2020-2028 (USD Million)
5.5 Frozen
5.5.1 Frozen Market Estimates and Forecast, 2020-2028 (USD Million)
5.6 Canned
5.6.1 Canned Market Estimates and Forecast, 2020-2028 (USD Million)
5.7 Others
5.7.1 Others Market Estimates and Forecast, 2020-2028 (USD Million)
6 GLOBAL SUSTAINABLE SEAFOOD MARKET, BY DISTRIBUTION CHANNEL
6.1 Introduction
6.2 Sustainable Seafood Market: Distribution Channel Scope Key Takeaways
6.3 Revenue Growth Analysis, 2022 & 2028
6.4 Hypermarkets
6.4.1 Hypermarkets Market Estimates and Forecast, 2020-2028 (USD Million)
6.5 Supermarkets
6.5.1 Supermarkets Market Estimates and Forecast, 2020-2028 (USD Million)
6.6 Convenience Stores
6.6.1 Convenience Stores Market Estimates and Forecast, 2020-2028 (USD Million)
6.7 Specialty Stores
6.7.1 Specialty Stores Market Estimates and Forecast, 2020-2028 (USD Million)
6.8 Online
6.8.1 Online Market Estimates and Forecast, 2020-2028 (USD Million)
6.9 Others
6.9.1 Others Market Estimates and Forecast, 2020-2028 (USD Million)
7 GLOBAL SUSTAINABLE SEAFOOD MARKET, BY REGION
7.1 Introduction
7.2 North America Sustainable Seafood Market Estimates and Forecast, 2020-2028 (USD Million)
7.2.1 By Product Type
7.2.2 By Form
7.2.3 By Distribution Channel
7.2.4 By Country
7.2.4.1 U.S. Sustainable Seafood Market Estimates and Forecast, 2020-2028 (USD Million)
7.2.4.1.1 By Product Type
7.2.4.1.2 By Form
7.2.4.1.3 By Distribution Channel
7.2.4.2 Canada Sustainable Seafood Market Estimates and Forecast, 2020-2028 (USD Million)
7.2.4.2.1 By Product Type
7.2.4.2.2 By Form
7.2.4.2.3 By Distribution Channel
7.2.4.3 Mexico Sustainable Seafood Market Estimates and Forecast, 2020-2028 (USD Million)
7.2.4.3.1 By Product Type
7.2.4.3.2 By Form
7.2.4.3.3 By Distribution Channel
7.3 Europe Sustainable Seafood Market Estimates and Forecast, 2020-2028 (USD Million)
7.3.1 By Product Type
7.3.2 By Form
7.3.3 By Distribution Channel
7.3.4 By Country
7.3.4.1 Germany Sustainable Seafood Market Estimates and Forecast, 2020-2028 (USD Million)
7.3.4.1.1 By Product Type
7.3.4.1.2 By Form
7.3.4.1.3 By Distribution Channel
7.3.4.2 U.K. Sustainable Seafood Market Estimates and Forecast, 2020-2028 (USD Million)
7.3.4.2.1 By Product Type
7.3.4.2.2 By Form
7.3.4.2.3 By Distribution Channel
7.3.4.3 France Sustainable Seafood Market Estimates and Forecast, 2020-2028 (USD Million)
7.3.4.3.1 By Product Type
7.3.4.3.2 By Form
7.3.4.3.3 By Distribution Channel
7.3.4.4 Italy Sustainable Seafood Market Estimates and Forecast, 2020-2028 (USD Million)
7.3.4.4.1 By Product Type
7.3.4.4.2 By Form
7.2.4.4.3 By Distribution Channel
7.3.4.5 Spain Sustainable Seafood Market Estimates and Forecast, 2020-2028 (USD Million)
7.3.4.5.1 By Product Type
7.3.4.5.2 By Form
7.2.4.5.3 By Distribution Channel
7.3.4.6 Netherlands Sustainable Seafood Market Estimates and Forecast, 2020-2028 (USD Million)
7.3.4.6.1 By Product Type
7.3.4.6.2 By Form
7.2.4.6.3 By Distribution Channel
7.3.4.7 Rest of Europe Sustainable Seafood Market Estimates and Forecast, 2020-2028 (USD Million)
7.3.4.7.1 By Product Type
7.3.4.7.2 By Form
7.2.4.7.3 By Distribution Channel
7.4 Asia Pacific Sustainable Seafood Market Estimates and Forecast, 2020-2028 (USD Million)
7.4.1 By Product Type
7.4.2 By Form
7.4.3 By Distribution Channel
7.4.4 By Country
7.4.4.1 China Sustainable Seafood Market Estimates and Forecast, 2020-2028 (USD Million)
7.4.4.1.1 By Product Type
7.4.4.1.2 By Form
7.4.4.1.3 By Distribution Channel
7.4.4.2 Japan Sustainable Seafood Market Estimates and Forecast, 2020-2028 (USD Million)
7.4.4.2.1 By Product Type
7.4.4.2.2 By Form
7.4.4.2.3 By Distribution Channel
7.4.4.3 India Sustainable Seafood Market Estimates and Forecast, 2020-2028 (USD Million)
7.4.4.3.1 By Product Type
7.4.4.3.2 By Form
7.4.4.3.3 By Distribution Channel
7.4.4.4 South Korea Sustainable Seafood Market Estimates and Forecast, 2020-2028 (USD Million)
7.4.4.4.1 By Product Type
7.4.4.4.2 By Form
7.4.4.4.3 By Distribution Channel
7.4.4.5 Singapore Sustainable Seafood Market Estimates and Forecast, 2020-2028 (USD Million)
7.4.4.5.1 By Product Type
7.4.4.5.2 By Form
7.4.4.5.3 By Distribution Channel
7.4.4.6 Malaysia Sustainable Seafood Market Estimates and Forecast, 2020-2028 (USD Million)
7.4.4.6.1 By Product Type
7.4.4.6.2 By Form
7.4.4.6.3 By Distribution Channel
7.4.4.7 Thailand Sustainable Seafood Market Estimates and Forecast, 2020-2028 (USD Million)
7.4.4.7.1 By Product Type
7.4.4.7.2 By Form
7.4.4.7.3 By Distribution Channel
7.4.4.8 Indonesia Sustainable Seafood Market Estimates and Forecast, 2020-2028 (USD Million)
7.4.4.8.1 By Product Type
7.4.4.8.2 By Form
7.4.4.8.3 By Distribution Channel
7.4.4.9 Vietnam Sustainable Seafood Market Estimates and Forecast, 2020-2028 (USD Million)
7.4.4.9.1 By Product Type
7.4.4.9.2 By Form
7.4.4.9.3 By Distribution Channel
7.4.4.10 Taiwan Sustainable Seafood Market Estimates and Forecast, 2020-2028 (USD Million)
7.4.4.10.1 By Product Type
7.4.4.10.2 By Form
7.4.4.10.3 By Distribution Channel
7.4.4.11 Rest of Asia Pacific Sustainable Seafood Market Estimates and Forecast, 2020-2028 (USD Million)
7.4.4.11.1 By Product Type
7.4.4.11.2 By Form
7.4.4.11.3 By Distribution Channel
7.5 Middle East and Africa Sustainable Seafood Market Estimates and Forecast, 2020-2028 (USD Million)
7.5.1 By Product Type
7.5.2 By Form
7.5.3 By Distribution Channel
7.5.4 By Country
7.5.4.1 Saudi Arabia Sustainable Seafood Market Estimates and Forecast, 2020-2028 (USD Million)
7.5.4.1.1 By Product Type
7.5.4.1.2 By Form
7.5.4.1.3 By Distribution Channel
7.5.4.2 U.A.E. Sustainable Seafood Market Estimates and Forecast, 2020-2028 (USD Million)
7.5.4.2.1 By Product Type
7.5.4.2.2 By Form
7.5.4.2.3 By Distribution Channel
7.5.4.3 Israel Sustainable Seafood Market Estimates and Forecast, 2020-2028 (USD Million)
7.5.4.3.1 By Product Type
7.5.4.3.2 By Form
7.5.4.3.3 By Distribution Channel
7.5.4.4 South Africa Sustainable Seafood Market Estimates and Forecast, 2020-2028 (USD Million)
7.5.4.4.1 By Product Type
7.5.4.4.2 By Form
7.5.4.4.3 By Distribution Channel
7.5.4.5 Rest of Middle East and Africa Sustainable Seafood Market Estimates and Forecast, 2020-2028 (USD Million)
7.5.4.5.1 By Product Type
7.5.4.5.2 By Form
7.5.4.5.2 By Distribution Channel
7.6 Central and South America Sustainable Seafood Market Estimates and Forecast, 2020-2028 (USD Million)
7.6.1 By Product Type
7.6.2 By Form
7.6.3 By Distribution Channel
7.6.4 By Country
7.6.4.1 Brazil Sustainable Seafood Market Estimates and Forecast, 2020-2028 (USD Million)
7.6.4.1.1 By Product Type
7.6.4.1.2 By Form
7.6.4.1.3 By Distribution Channel
7.6.4.2 Argentina Sustainable Seafood Market Estimates and Forecast, 2020-2028 (USD Million)
7.6.4.2.1 By Product Type
7.6.4.2.2 By Form
7.6.4.2.3 By Distribution Channel
7.6.4.3 Chile Sustainable Seafood Market Estimates and Forecast, 2020-2028 (USD Million)
7.6.4.3.1 By Product Type
7.6.4.3.2 By Form
7.6.4.3.3 By Distribution Channel
7.6.4.4 Rest of Central and South America Sustainable Seafood Market Estimates and Forecast, 2020-2028 (USD Million)
7.6.4.4.1 By Product Type
7.6.4.4.2 By Form
7.6.4.4.3 By Distribution Channel
8 COMPETITIVE LANDCAPE
8.1 Company Market Share Analysis
8.2 Four Quadrant Positioning Matrix
8.2.1 Market Leaders
8.2.2 Market Visionaries
8.2.3 Market Challengers
8.2.4 Niche Market Players
8.3 Vendor Landscape
8.3.1 North America
8.3.2 Europe
8.3.3 Asia Pacific
8.3.4 Rest of the World
8.4 Company Profiles
8.4.1 Zoneco Group Co., Ltd.
8.4.1.1 Business Description & Financial Analysis
8.4.1.2 SWOT Analysis
8.4.1.3 Products & Services Offered
8.4.1.4 Strategic Alliances between Business Partners
8.4.2 M.F. Foley Company, Inc.
8.4.2.1 Business Description & Financial Analysis
8.4.2.2 SWOT Analysis
8.4.2.3 Products & Services Offered
8.4.2.4 Strategic Alliances between Business Partners
8.4.3 Walker Seafoods
8.4.3.1 Business Description & Financial Analysis
8.4.3.2 SWOT Analysis
8.4.3.3 Products & Services Offered
8.4.3.4 Strategic Alliances between Business Partners
8.4.4 Nippon Suisan Kaisha, Ltd
8.4.4.1 Business Description & Financial Analysis
8.4.4.2 SWOT Analysis
8.4.4.3 Products & Services Offered
8.4.4.4 Strategic Alliances between Business Partners
8.4.5 Thai Union Group
8.4.5.1 Business Description & Financial Analysis
8.4.5.2 SWOT Analysis
8.4.5.3 Products & Services Offered
8.4.5.4 Strategic Alliances between Business Partners
8.4.6 Maruha Nichiro Corporation
8.4.6.1 Business Description & Financial Analysis
8.4.6.2 SWOT Analysis
8.4.6.3 Products & Services Offered
8.4.6.4 Strategic Alliances between Business Partners
8.4.7 Austral Fisheries
8.4.7.1 Business Description & Financial Analysis
8.4.7.2 SWOT Analysis
8.4.7.3 Products & Services Offered
8.4.8.4 Strategic Alliances between Business Partners
8.4.8 Pacific Andes Group
8.4.8.1 Business Description & Financial Analysis
8.4.8.2 SWOT Analysis
8.4.8.3 Products & Services Offered
8.4.8.4 Strategic Alliances between Business Partners
8.4.9 Marine Harvest ASA
8.4.9.1 Business Description & Financial Analysis
8.4.9.2 SWOT Analysis
8.4.9.3 Products & Services Offered
8.4.9.4 Strategic Alliances between Business Partners
8.4.10 AgriMarine Holdings
8.4.10.1 Business Description & Financial Analysis
8.4.10.2 SWOT Analysis
8.4.10.3 Products & Services Offered
8.4.10.4 Strategic Alliances between Business Partners
8.4.11 Other Companies
8.4.11.1 Business Description & Financial Analysis
8.4.11.2 SWOT Analysis
8.4.11.3 Products & Services Offered
8.4.11.4 Strategic Alliances between Business Partners
9 RESEARCH METHODOLOGY
9.1 Market Introduction
9.1.1 Market Definition
9.1.2 Market Scope & Segmentation
9.2 Information Procurement
9.2.1 Secondary Research
9.2.1.1 Purchased Databases
9.2.1.2 GMEs Internal Data Repository
9.2.1.3 Secondary Resources & Third Party Perspectives
9.2.1.4 Company Information Sources
9.2.2 Primary Research
9.2.2.1 Various Types of Respondents for Primary Interviews
9.2.2.2 Number of Interviews Conducted throughout the Research Process
9.2.2.3 Primary Stakeholders
9.2.2.4 Discussion Guide for Primary Participants
9.2.3 Expert Panels
9.2.3.1 Expert Panels Across 30+ Industry
9.2.4 Paid Local Experts
9.2.4.1 Paid Local Experts Across 30+ Industry Across each Region
9.3 Market Estimation
9.3.1 Top-Down Approach
9.3.1.1 Macro-Economic Indicators Considered
9.3.1.2 Micro-Economic Indicators Considered
9.3.2 Bottom Up Approach
9.3.2.1 Company Share Analysis Approach
9.3.2.2 Estimation of Potential Product Sales
9.4 Data Triangulation
9.4.1 Data Collection
9.4.2 Time Series, Cross Sectional & Panel Data Analysis
9.4.3 Cluster Analysis
9.5 Analysis and Output
9.5.1 Inhouse AI Based Real Time Analytics Tool
9.5.2 Output From Desk & Primary Research
9.6 Research Assumptions & Limitations
9.7.1 Research Assumptions
9.7.2 Research Limitations
LIST OF TABLES
1 Global Sustainable Seafood Market, By Product Type, 2020-2028 (USD Mllion)
2 Bivalves and Other Molluscs and Aquatic Invertebrates Market, By Region, 2020-2028 (USD Mllion)
3 Cephalopods Market, By Region, 2020-2028 (USD Mllion)
4 Crustaceans Market, By Region, 2020-2028 (USD Mllion)
5 Flatfish Market, By Region, 2020-2028 (USD Mllion)
6 Freshwater fish Market, By Region, 2020-2028 (USD Mllion)
7 Groundfish Market, By Region, 2020-2028 (USD Mllion)
8 Salmonids Market, By Region, 2020-2028 (USD Mllion)
9 Small pelagics Market, By Region, 2020-2028 (USD Mllion)
10 Tuna and tuna-like species Market, By Region, 2020-2028 (USD Mllion)
11 Others Market, By Region, 2020-2028 (USD Mllion)
12 Global Sustainable Seafood Market, By Form, 2020-2028 (USD Mllion)
13 Chilled Market, By Region, 2020-2028 (USD Mllion)
14 Frozen Market, By Region, 2020-2028 (USD Mllion)
15 Canned Market, By Region, 2020-2028 (USD Mllion)
16 Others Market, By Region, 2020-2028 (USD Mllion)
17 Global Sustainable Seafood Market, By Distribution Channel, 2020-2028 (USD Mllion)
18 Hypermarkets Market, By Region, 2020-2028 (USD Mllion)
19 Supermarkets Market, By Region, 2020-2028 (USD Mllion)
20 Convenience Stores Market, By Region, 2020-2028 (USD Mllion)
21 Specialty Stores Market, By Region, 2020-2028 (USD Mllion)
22 Online Market, By Region, 2020-2028 (USD Mllion)
23 Others Market, By Region, 2020-2028 (USD Mllion)
24 Regional Analysis, 2020-2028 (USD Mllion)
25 North America Sustainable Seafood Market, By Product Type, 2020-2028 (USD Million)
26 North America Sustainable Seafood Market, By Form, 2020-2028 (USD Million)
27 North America Sustainable Seafood Market, By Distribution Channel, 2020-2028 (USD Million)
28 North America Sustainable Seafood Market, By Country, 2020-2028 (USD Million)
29 U.S Sustainable Seafood Market, By Product Type, 2020-2028 (USD Million)
30 U.S Sustainable Seafood Market, By Form, 2020-2028 (USD Million)
31 U.S Sustainable Seafood Market, By Distribution Channel, 2020-2028 (USD Million)
32 Canada Sustainable Seafood Market, By Product Type, 2020-2028 (USD Million)
33 Canada Sustainable Seafood Market, By Form, 2020-2028 (USD Million)
34 Canada Sustainable Seafood Market, By Distribution Channel, 2020-2028 (USD Million)
35 Mexico Sustainable Seafood Market, By Product Type, 2020-2028 (USD Million)
36 Mexico Sustainable Seafood Market, By Form, 2020-2028 (USD Million)
37 Mexico Sustainable Seafood Market, By Distribution Channel, 2020-2028 (USD Million)
38 Europe Sustainable Seafood Market, By Product Type, 2020-2028 (USD Million)
39 Europe Sustainable Seafood Market, By Form, 2020-2028 (USD Million)
40 Europe Sustainable Seafood Market, By Distribution Channel, 2020-2028 (USD Million)
41 Germany Sustainable Seafood Market, By Product Type, 2020-2028 (USD Million)
42 Germany Sustainable Seafood Market, By Form, 2020-2028 (USD Million)
43 Germany Sustainable Seafood Market, By Distribution Channel, 2020-2028 (USD Million)
44 U.K Sustainable Seafood Market, By Product Type, 2020-2028 (USD Million)
45 U.K Sustainable Seafood Market, By Form, 2020-2028 (USD Million)
46 U.K Sustainable Seafood Market, By Distribution Channel, 2020-2028 (USD Million)
47 France Sustainable Seafood Market, By Product Type, 2020-2028 (USD Million)
48 France Sustainable Seafood Market, By Form, 2020-2028 (USD Million)
49 France Sustainable Seafood Market, By Distribution Channel, 2020-2028 (USD Million)
50 Italy Sustainable Seafood Market, By Product Type, 2020-2028 (USD Million)
51 Italy Sustainable Seafood Market, By End Use , 2020-2028 (USD Million)
52 Italy Sustainable Seafood Market, By Distribution Channel, 2020-2028 (USD Million)
53 Spain Sustainable Seafood Market, By Product Type, 2020-2028 (USD Million)
54 Spain Sustainable Seafood Market, By Form, 2020-2028 (USD Million)
55 Spain Sustainable Seafood Market, By Distribution Channel, 2020-2028 (USD Million)
56 Rest Of Europe Sustainable Seafood Market, By Product Type, 2020-2028 (USD Million)
57 Rest Of Europe Sustainable Seafood Market, By Form, 2020-2028 (USD Million)
58 Rest of Europe Sustainable Seafood Market, By Distribution Channel, 2020-2028 (USD Million)
59 Asia Pacific Sustainable Seafood Market, By Product Type, 2020-2028 (USD Million)
60 Asia Pacific Sustainable Seafood Market, By Form, 2020-2028 (USD Million)
61 Asia Pacific Sustainable Seafood Market, By Distribution Channel, 2020-2028 (USD Million)
62 Asia Pacific Sustainable Seafood Market, By Country, 2020-2028 (USD Million)
63 China Sustainable Seafood Market, By Product Type, 2020-2028 (USD Million)
64 China Sustainable Seafood Market, By Form, 2020-2028 (USD Million)
65 China Sustainable Seafood Market, By Distribution Channel, 2020-2028 (USD Million)
66 India Sustainable Seafood Market, By Product Type, 2020-2028 (USD Million)
67 India Sustainable Seafood Market, By Form, 2020-2028 (USD Million)
68 India Sustainable Seafood Market, By Distribution Channel, 2020-2028 (USD Million)
69 Japan Sustainable Seafood Market, By Product Type, 2020-2028 (USD Million)
70 Japan Sustainable Seafood Market, By Form, 2020-2028 (USD Million)
71 Japan Sustainable Seafood Market, By Distribution Channel, 2020-2028 (USD Million)
72 South Korea Sustainable Seafood Market, By Product Type, 2020-2028 (USD Million)
73 South Korea Sustainable Seafood Market, By Form, 2020-2028 (USD Million)
74 South Korea Sustainable Seafood Market, By Distribution Channel, 2020-2028 (USD Million)
75 Middle East and Africa Sustainable Seafood Market, By Product Type, 2020-2028 (USD Million)
76 Middle East and Africa Sustainable Seafood Market, By Form, 2020-2028 (USD Million)
77 Middle East and Africa Sustainable Seafood Market, By Distribution Channel, 2020-2028 (USD Million)
78 Middle East and Africa Sustainable Seafood Market, By Country, 2020-2028 (USD Million)
79 Saudi Arabia Sustainable Seafood Market, By Product Type, 2020-2028 (USD Million)
80 Saudi Arabia Sustainable Seafood Market, By Form, 2020-2028 (USD Million)
81 Saudi Arabia Sustainable Seafood Market, By Distribution Channel, 2020-2028 (USD Million)
82 UAE Sustainable Seafood Market, By Product Type, 2020-2028 (USD Million)
83 UAE Sustainable Seafood Market, By Form, 2020-2028 (USD Million)
84 UAE Sustainable Seafood Market, By Distribution Channel, 2020-2028 (USD Million)
85 Central and South America Sustainable Seafood Market, By Product Type, 2020-2028 (USD Million)
86 Central and South America Sustainable Seafood Market, By Form, 2020-2028 (USD Million)
87 Central and South America Sustainable Seafood Market, By Distribution Channel, 2020-2028 (USD Million)
88 Central and South America Sustainable Seafood Market, By Country, 2020-2028 (USD Million)
89 Brazil Sustainable Seafood Market, By Product Type, 2020-2028 (USD Million)
90 Brazil Sustainable Seafood Market, By Form, 2020-2028 (USD Million)
91 Brazil Sustainable Seafood Market, By Distribution Channel, 2020-2028 (USD Million)
92 Zoneco Group Co., Ltd.: Products & Services Offering
93 M.F. Foley Company, Inc.: Products & Services Offering
94 Walker Seafoods: Products & Services Offering
95 Nippon Suisan Kaisha, Ltd: Products & Services Offering
96 Thai Union Group: Products & Services Offering
97 MARUHA NICHIRO CORPORATION: Products & Services Offering
98 Austral Fisheries : Products & Services Offering
99 Pacific Andes Group: Products & Services Offering
100 Marine Harvest ASA, Inc: Products & Services Offering
101 AgriMarine Holdings: Products & Services Offering
102 Other Companies: Products & Services Offering
LIST OF FIGURES
1 Global Sustainable Seafood Market Overview
2 Global Sustainable Seafood Market Value From 2020-2028 (USD Mllion)
3 Global Sustainable Seafood Market Share, By Product Type (2022)
4 Global Sustainable Seafood Market Share, By Form (2022)
5 Global Sustainable Seafood Market Share, By Distribution Channel (2022)
6 Global Sustainable Seafood Market, By Region (Asia Pacific Market)
7 Technological Trends In Global Sustainable Seafood Market
8 Four Quadrant Competitor Positioning Matrix
9 Impact Of Macro & Micro Indicators On The Market
10 Impact Of Key Drivers On The Global Sustainable Seafood Market
11 Impact Of Challenges On The Global Sustainable Seafood Market
12 Porter’s Five Forces Analysis
13 Global Sustainable Seafood Market: By Product Type Scope Key Takeaways
14 Global Sustainable Seafood Market, By Product Type Segment: Revenue Growth Analysis
15 Bivalves and Other Molluscs and Aquatic Invertebrates Market, By Region, 2020-2028 (USD Mllion)
16 Cephalopods Market, By Region, 2020-2028 (USD Mllion)
17 Crustaceans Market, By Region, 2020-2028 (USD Mllion)
18 Flatfish Market, By Region, 2020-2028 (USD Mllion)
19 Freshwater Fish Market, By Region, 2020-2028 (USD Mllion)
20 Groundfish Market, By Region, 2020-2028 (USD Mllion)
21 Salmonids Market, By Region, 2020-2028 (USD Mllion)
22 Small Pelagics Market, By Region, 2020-2028 (USD Mllion)
23 Tuna And Tuna-like Species Market, By Region, 2020-2028 (USD Mllion)
24 Others Market, By Region, 2020-2028 (USD Mllion)
25 Global Sustainable Seafood Market: By Form Scope Key Takeaways
26 Global Sustainable Seafood Market, By Form Segment: Revenue Growth Analysis
27 Chilled Market, By Region, 2020-2028 (USD Mllion)
28 Frozen Market, By Region, 2020-2028 (USD Mllion)
29 Canned Market, By Region, 2020-2028 (USD Mllion)
30 Others Market, By Region, 2020-2028 (USD Mllion)
31 Global Sustainable Seafood Market: By Distribution Channel Scope Key Takeaways
32 Global Sustainable Seafood Market, By Distribution Channel Segment: Revenue Growth Analysis
33 Hypermarkets Market, By Region, 2020-2028 (USD Mllion)
34 Supermarkets Market, By Region, 2020-2028 (USD Mllion)
35 Convenience Stores Market, By Region, 2020-2028 (USD Mllion)
36 Specialty Stores Market, By Region, 2020-2028 (USD Mllion)
37 Online Market, By Region, 2020-2028 (USD Mllion)
38 Others Market, By Region, 2020-2028 (USD Mllion)
39 Regional Segment: Revenue Growth Analysis
40 Global Sustainable Seafood Market: Regional Analysis
41 North America Sustainable Seafood Market Overview
42 North America Sustainable Seafood Market, By Product Type
43 North America Sustainable Seafood Market, By Form
44 North America Sustainable Seafood Market, By Distribution Channel
45 North America Sustainable Seafood Market, By Country
46 U.S. Sustainable Seafood Market, By Product Type
47 U.S. Sustainable Seafood Market, By Form
48 U.S. Sustainable Seafood Market, By Distribution Channel
49 Canada Sustainable Seafood Market, By Product Type
50 Canada Sustainable Seafood Market, By Form
51 Canada Sustainable Seafood Market, By Distribution Channel
52 Mexico Sustainable Seafood Market, By Product Type
53 Mexico Sustainable Seafood Market, By Form
54 Mexico Sustainable Seafood Market, By Distribution Channel
55 Four Quadrant Positioning Matrix
56 Company Market Share Analysis
57 Zoneco Group Co., Ltd.: Company Snapshot
58 Zoneco Group Co., Ltd.: SWOT Analysis
59 Zoneco Group Co., Ltd.: Geographic Presence
60 M.F. Foley Company, Inc.: Company Snapshot
61 M.F. Foley Company, Inc.: SWOT Analysis
62 M.F. Foley Company, Inc.: Geographic Presence
63 Walker Seafoods: Company Snapshot
64 Walker Seafoods: SWOT Analysis
65 Walker Seafoods: Geographic Presence
66 Nippon Suisan Kaisha, Ltd: Company Snapshot
67 Nippon Suisan Kaisha, Ltd: Swot Analysis
68 Nippon Suisan Kaisha, Ltd: Geographic Presence
69 Thai Union Group: Company Snapshot
70 Thai Union Group: SWOT Analysis
71 Thai Union Group: Geographic Presence
72 Maruha Nichiro Corporation: Company Snapshot
73 Maruha Nichiro Corporation: SWOT Analysis
74 Maruha Nichiro Corporation: Geographic Presence
75 Austral Fisheries : Company Snapshot
76 Austral Fisheries : SWOT Analysis
77 Austral Fisheries : Geographic Presence
78 Pacific Andes Group: Company Snapshot
79 Pacific Andes Group: SWOT Analysis
80 Pacific Andes Group: Geographic Presence
81 Marine Harvest ASA, Inc.: Company Snapshot
82 Marine Harvest ASA, Inc.: SWOT Analysis
83 Marine Harvest ASA, Inc.: Geographic Presence
84 AgriMarine Holdings: Company Snapshot
85 AgriMarine Holdings: SWOT Analysis
86 AgriMarine Holdings: Geographic Presence
87 Other Companies: Company Snapshot
88 Other Companies: SWOT Analysis
89 Other Companies: Geographic Presence
The Global Sustainable Seafood Market has been studied from the year 2019 till 2028. However, the CAGR provided in the report is from the year 2023 to 2028. The research methodology involved three stages: Desk research, Primary research, and Analysis & Output from the entire research process.

The desk research involved a robust background study which meant referring to paid and unpaid databases to understand the market dynamics; mapping contracts from press releases; identifying the key players in the market, studying their product portfolio, competition level, annual reports/SEC filings & investor presentations; and learning the demand and supply-side analysis for the Sustainable Seafood Market.

The primary research activity included telephonic conversations with more than 50 tier 1 industry consultants, distributors, and end-use product manufacturers.

Finally, based on the above thorough research process, an in-depth analysis was carried out considering the following aspects: market attractiveness, current & future market trends, market share analysis, SWOT analysis of the company and customer analytics.

Frequently Asked Questions

This FREE sample includes market data points, ranging from trend analyses to market estimates & forecasts. See for yourself.
Or view our licence options:
Tailor made solutions just for you
80% of our clients seek made-to-order reports. How do you want us to tailor yours?
OUR CLIENTS


