This report was recently updated on April 19 2024 with the latest and most recent
market numbers
Global Edible Flakes Market Size, Trends & Analysis - Forecasts to 2029 By Product (Corn, Oat, Wheat, and Others), By Distribution Channel Outlook (Offline and Online), and By Region (North America, Asia Pacific, Central & South America, Europe, and Middle East and Africa), Competitive Landscape, Company Market Share Analysis, and End User Analysis
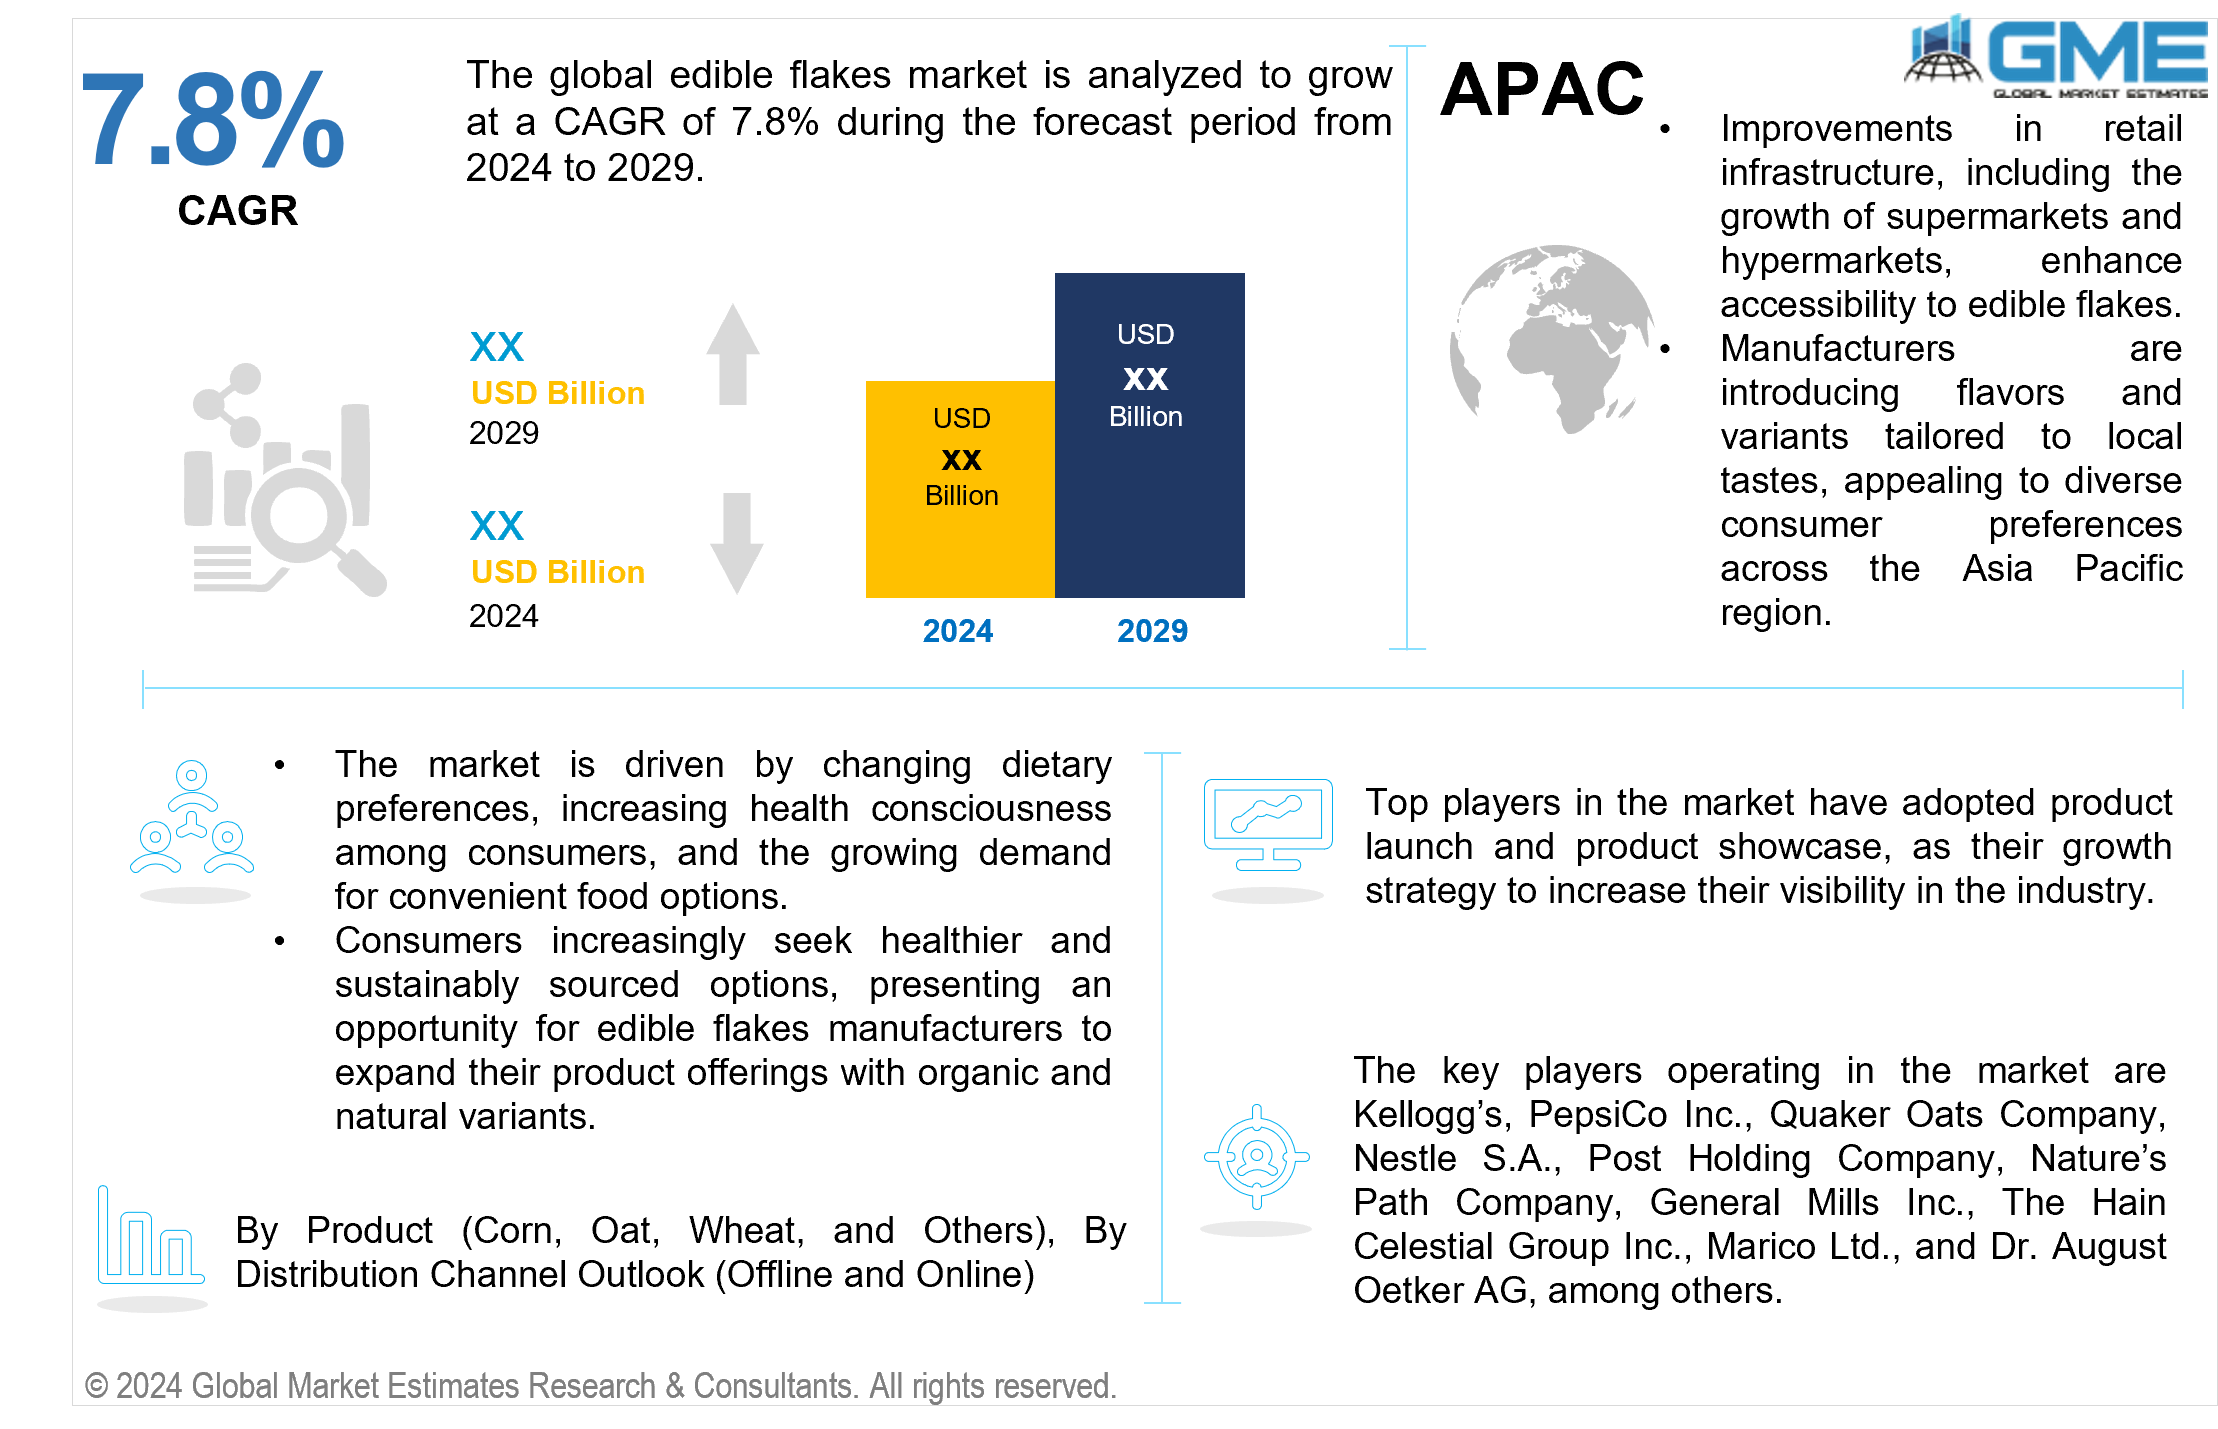
The global edible flakes market is analyzed to grow at a CAGR of 7.8% during the forecast period from 2024 to 2029. These flakes are popular for their convenience, versatility, and nutritional value. They can be consumed as breakfast cereals and snack foods or used as ingredients in various recipes.
The market for edible flakes is driven by factors such as changing dietary preferences, increasing health consciousness among consumers, and the growing demand for convenient food options. Several key factors propel the global edible flakes market, such as shifting dietary preferences, which are influenced by evolving lifestyles and cultural trends and lead consumers to seek healthier and more convenient food choices. Heightened health consciousness prompts individuals to prioritize nutritious options, favoring products like edible flakes with wholesome ingredients and essential nutrients. Moreover, the modern pace of life fosters a growing demand for convenient foods that require minimal preparation time. As a result, manufacturers respond with innovative flavors, ingredient combinations, and packaging solutions to meet these evolving consumer needs. An opportunity lies in the rising demand for organic and natural food products. Consumers increasingly seek healthier and sustainably sourced options, presenting an opportunity for edible flakes manufacturers to expand their product offerings with organic and natural variants, tapping into a growing segment of health-conscious consumers and potentially commanding premium pricing.
One restraint the global edible flakes market faces is the challenge of maintaining competitive pricing amidst fluctuating raw material costs. The market relies heavily on grains and other agricultural commodities, which can be influenced by weather conditions, supply chain disruptions, and geopolitical tensions.
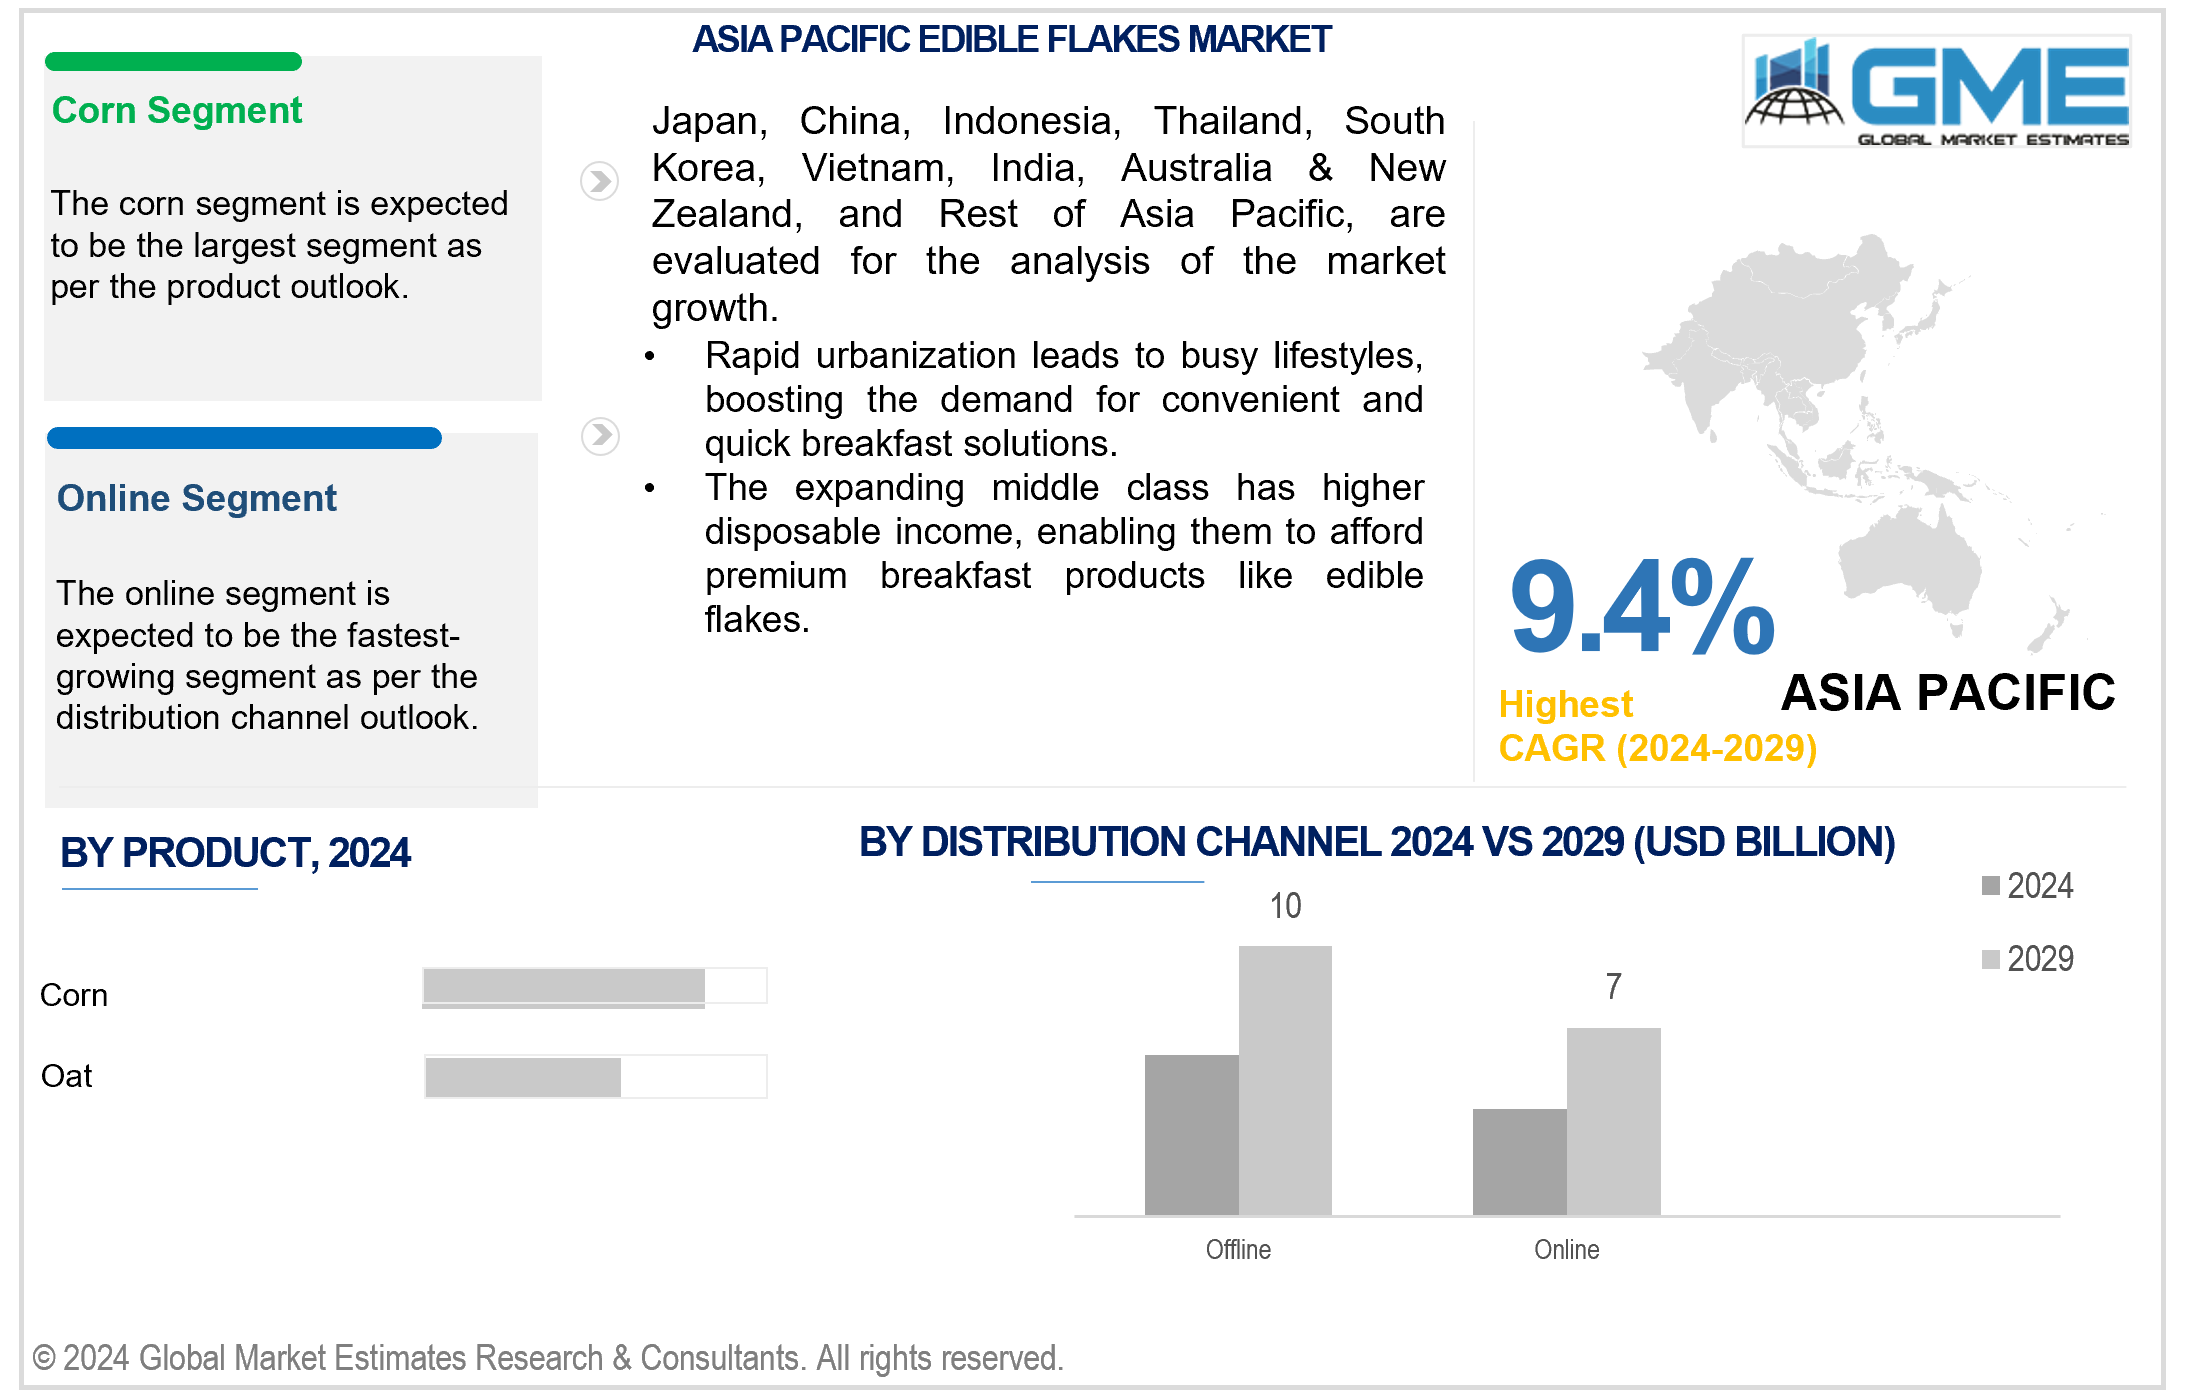
Based on product, the market is segmented into corn, oat, wheat, and others. The corn segment is expected to hold the largest share of the market during the forecast period. Corn flakes have been a staple in the breakfast cereal industry for decades, with widespread popularity across various demographics. Their versatility in flavouring and widespread availability contribute to their dominance in the market. However, the increasing popularity of oat flakes suggests a potential shift in dominance over time, reflecting evolving consumer preferences toward healthier options.
The oat segment is projected to grow fastest during the forecast period. This growth is fueled by increasing awareness of the health benefits associated with oats, such as their high fiber content and cholesterol-lowering properties, which resonate with health-conscious consumers. Oat flakes are also popular among individuals following gluten-free diets, further driving their demand.
Based on distribution channel, the market is segmented into offline and online. The offline segment is expected to hold the largest share of the market during the forecast period. Offline channels include supermarkets, hypermarkets, convenience stores, and specialty stores, where consumers can physically browse and purchase products. These channels have historically held a significant share due to their widespread presence and consumer familiarity.
The online segment is projected to grow fastest during the forecast period. Online channels, such as e-commerce platforms and grocery delivery services, offer consumers convenience, more comprehensive product selection, and the ability to shop from the comfort of their homes. The increasing adoption of online shopping, especially among tech-savvy and busy consumers, is driving the growth of this segment.
North America is analyzed to be the largest region in the global edible flakes market during the forecast period. This dominance is attributed to factors such as high consumer awareness of health and wellness, a strong preference for convenient breakfast options, and the presence of major market players offering a diverse range of edible flakes to meet evolving consumer demands.
Asia Pacific is analyzed to be the fastest-growing region in the edible flakes market during the forecast period. The growth is attributed to rapid urbanization leading to busy lifestyles, boosting the demand for convenient and quick breakfast solutions. The expanding middle class has higher disposable income, enabling them to afford premium breakfast products like edible flakes. Improvements in retail infrastructure, including the growth of supermarkets and hypermarkets, enhance accessibility to edible flakes. Manufacturers are introducing flavors and variants tailored to local tastes, appealing to diverse consumer preferences across the Asia Pacific region.
Kellogg’s, PepsiCo Inc., Quaker Oats Company, Nestle S.A., Post Holding Company, Nature’s Path Company, General Mills Inc., The Hain Celestial Group Inc., Marico Ltd., and Dr. August Oetker AG, among others, are some of the key players operating in the global market.
Please note: This is not an exhaustive list of companies profiled in the report.
In March 2023, Kellogg Company unveiled the names of the future companies it will create through its planned separation into two industry-leading, public companies focused on global snacking and North American cereal.
1 STRATEGIC INSIGHTS ON NEW REVENUE POCKETS
1.1 Strategic Opportunity & Attractiveness Analysis
1.1.1 Hot Revenue Pockets
1.1.2 Market Attractiveness Score
1.1.3 Revenue Impacting Opportunity
1.1.4 High Growing Region/Country
1.1.5 Competitor Analysis
1.1.6 Consumer Analysis
1.2 Global Market Estimates' View
1.3 Strategic Insights across Business Functions
1.3.1 For Chief Executive Officers
1.3.2 For Chief Marketing Officers
1.3.3 For Chief Strategy Officers
1.4 Evaluate the Potential of your Existing Business Lines vs. New Lines to Enter Into
2 TECHNOLOGICAL TRENDS
2.1 Technological Adoption Rate
2.2 Current Trend Impact Analysis
2.3 Future Trend Impact Analysis
3 GLOBAL MARKET OUTLOOK
3.1 Market Pyramid Analysis
3.1.1 Introduction
3.1.2 Adjacent Market Opportunities
3.1.3 Ancillary Market Opportunities
3.2 Demand Side Analysis
3.2.1 Market Drivers: Impact Analysis
3.2.2 Market Restraints: Impact Analysis
3.2.3 Market Opportunities: Impact Analysis
3.2.4 Market Challenges: Impact Analysis
3.3 Supply Side Analysis
3.3.1 Porter’s Five Forces Analysis
3.3.1.1 Threat of New Entrants
3.3.1.2 Threat of New Substitutes
3.3.1.3 Bargaining Power of Suppliers
3.3.1.4 Bargaining Power of Buyers
3.3.1.5 Intensity of Competitive Rivalry
3.3.2 SWOT Analysis; By Factor (Political & Legal, Economic, and Technological)
3.3.2.1 Political Landscape
3.3.2.2 Economic Landscape
3.3.2.3 Social Landscape
3.3.2.4 Technology Landscape
3.3.3 Value Chain Analysis
3.3.4 Trend Analysis
3.3.5 Gap Analysis
3.3.6 Cost Analysis
4 GLOBAL EDIBLE FLAKES MARKET, BY PRODUCT
4.1 Introduction
4.2 Edible Flakes Market: Product Scope Key Takeaways
4.3 Revenue Growth Analysis, 2023 & 2029
4.4 Corn
4.4.1 Corn Market Estimates and Forecast, 2021-2029 (USD Million)
4.5 Oat
4.5.1 Oat Market Estimates and Forecast, 2021-2029 (USD Million)
4.6 Wheat
4.6.1 Wheat Market Estimates and Forecast, 2021-2029 (USD Million)
4.7 Others
4.7.1 Others Market Estimates and Forecast, 2021-2029 (USD Million)
5 GLOBAL EDIBLE FLAKES MARKET, BY DISTRIBUTION CHANNEL
5.1 Introduction
5.2 Edible Flakes Market: Distribution Channel Scope Key Takeaways
5.3 Revenue Growth Analysis, 2023 & 2029
5.4 Offline
5.4.1 Offline Market Estimates and Forecast, 2021-2029 (USD Million)
5.5 Online
5.5.1 Online Market Estimates and Forecast, 2021-2029 (USD Million)
6 GLOBAL EDIBLE FLAKES MARKET, BY REGION
6.1 Introduction
6.2 North America Edible Flakes Market Estimates and Forecast, 2021-2029 (USD Million)
6.2.1 By Product
6.2.2 By Distribution Channel
6.2.3 By Country
6.2.3.1 U.S. Edible Flakes Market Estimates and Forecast, 2021-2029 (USD Million)
6.2.3.1.1 By Product
6.2.3.1.2 By Distribution Channel
6.2.3.2 Canada Edible Flakes Market Estimates and Forecast, 2021-2029 (USD Million)
6.2.3.2.1 By Product
6.2.3.2.2 By Distribution Channel
6.2.3.3 Mexico Edible Flakes Market Estimates and Forecast, 2021-2029 (USD Million)
6.2.3.3.1 By Product
6.2.3.3.2 By Distribution Channel
6.3 Europe Edible Flakes Market Estimates and Forecast, 2021-2029 (USD Million)
6.3.1 By Product
6.3.2 By Distribution Channel
6.3.3 By Country
6.3.3.1 Germany Edible Flakes Market Estimates and Forecast, 2021-2029 (USD Million)
6.3.3.1.1 By Product
6.3.3.1.2 By Distribution Channel
6.3.3.2 U.K. Edible Flakes Market Estimates and Forecast, 2021-2029 (USD Million)
6.3.3.2.1 By Product
6.3.3.2.2 By Distribution Channel
6.3.3.3 France Edible Flakes Market Estimates and Forecast, 2021-2029 (USD Million)
6.3.3.3.1 By Product
6.3.3.3.2 By Distribution Channel
6.3.3.4 Italy Edible Flakes Market Estimates and Forecast, 2021-2029 (USD Million)
6.3.3.4.1 By Product
6.3.3.4.2 By Distribution Channel
6.3.3.5 Spain Edible Flakes Market Estimates and Forecast, 2021-2029 (USD Million)
6.3.3.5.1 By Product
6.3.3.5.2 By Distribution Channel
6.3.3.6 Netherlands Edible Flakes Market Estimates and Forecast, 2021-2029 (USD Million)
6.3.3.6.1 By Product
6.3.3.6.2 By Distribution Channel
6.3.3.7 Rest of Europe Edible Flakes Market Estimates and Forecast, 2021-2029 (USD Million)
6.3.3.6.1 By Product
6.3.3.6.2 By Distribution Channel
6.4 Asia Pacific Edible Flakes Market Estimates and Forecast, 2021-2029 (USD Million)
6.4.1 By Product
6.4.2 By Distribution Channel
6.4.3 By Country
6.4.3.1 China Edible Flakes Market Estimates and Forecast, 2021-2029 (USD Million)
6.4.3.1.1 By Product
6.4.3.1.2 By Distribution Channel
6.4.3.2 Japan Edible Flakes Market Estimates and Forecast, 2021-2029 (USD Million)
6.4.3.2.1 By Product
6.4.3.2.2 By Distribution Channel
6.4.3.3 India Edible Flakes Market Estimates and Forecast, 2021-2029 (USD Million)
6.4.3.3.1 By Product
6.4.3.3.2 By Distribution Channel
6.4.3.4 South Korea Edible Flakes Market Estimates and Forecast, 2021-2029 (USD Million)
6.4.3.4.1 By Product
6.4.3.4.2 By Distribution Channel
6.4.3.5 Singapore Edible Flakes Market Estimates and Forecast, 2021-2029 (USD Million)
6.4.3.5.1 By Product
6.4.3.5.2 By Distribution Channel
6.4.3.6 Malaysia Edible Flakes Market Estimates and Forecast, 2021-2029 (USD Million)
6.4.3.6.1 By Product
6.4.3.6.2 By Distribution Channel
6.4.3.7 Thailand Edible Flakes Market Estimates and Forecast, 2021-2029 (USD Million)
6.4.3.6.1 By Product
6.4.3.6.2 By Distribution Channel
6.4.3.8 Indonesia Edible Flakes Market Estimates and Forecast, 2021-2029 (USD Million)
6.4.3.7.1 By Product
6.4.3.7.2 By Distribution Channel
6.4.3.9 Vietnam Edible Flakes Market Estimates and Forecast, 2021-2029 (USD Million)
6.4.3.8.1 By Product
6.4.3.8.2 By Distribution Channel
6.4.3.10 Taiwan Edible Flakes Market Estimates and Forecast, 2021-2029 (USD Million)
6.4.3.10.1 By Product
6.4.3.10.2 By Distribution Channel
6.4.3.11 Rest of Asia Pacific Edible Flakes Market Estimates and Forecast, 2021-2029 (USD Million)
6.4.3.11.1 By Product
6.4.3.11.2 By Distribution Channel
6.5 Middle East and Africa Edible Flakes Market Estimates and Forecast, 2021-2029 (USD Million)
6.5.1 By Product
6.5.2 By Distribution Channel
6.5.3 By Country
6.5.3.1 Saudi Arabia Edible Flakes Market Estimates and Forecast, 2021-2029 (USD Million)
6.5.3.1.1 By Product
6.5.3.1.2 By Distribution Channel
6.5.3.2 U.A.E. Edible Flakes Market Estimates and Forecast, 2021-2029 (USD Million)
6.5.3.2.1 By Product
6.5.3.2.2 By Distribution Channel
6.5.3.3 Israel Edible Flakes Market Estimates and Forecast, 2021-2029 (USD Million)
6.5.3.3.1 By Product
6.5.3.3.2 By Distribution Channel
6.5.3.4 South Africa Edible Flakes Market Estimates and Forecast, 2021-2029 (USD Million)
6.5.3.4.1 By Product
6.5.3.4.2 By Distribution Channel
6.5.3.5 Rest of Middle East and Africa Edible Flakes Market Estimates and Forecast, 2021-2029 (USD Million)
6.5.3.5.1 By Product
6.5.3.5.2 By Distribution Channel
6.6 Central & South America Edible Flakes Market Estimates and Forecast, 2021-2029 (USD Million)
6.6.1 By Product
6.6.2 By Distribution Channel
6.6.3 By Country
6.6.3.1 Brazil Edible Flakes Market Estimates and Forecast, 2021-2029 (USD Million)
6.6.3.1.1 By Product
6.6.3.1.2 By Distribution Channel
6.6.3.2 Argentina Edible Flakes Market Estimates and Forecast, 2021-2029 (USD Million)
6.6.3.2.1 By Product
6.6.3.2.2 By Distribution Channel
6.6.3.3 Chile Edible Flakes Market Estimates and Forecast, 2021-2029 (USD Million)
6.6.3.3.1 By Product
6.6.3.3.2 By Distribution Channel
6.6.3.3 Rest of Central & South America Edible Flakes Market Estimates and Forecast, 2021-2029 (USD Million)
6.6.3.3.1 By Product
6.6.3.3.2 By Distribution Channel
7 COMPETITIVE LANDCAPE
7.1 Company Market Share Analysis
7.2 Four Quadrant Positioning Matrix
7.2.1 Market Leaders
7.2.2 Market Visionaries
7.2.3 Market Challengers
7.2.4 Niche Market Players
7.3 Vendor Landscape
7.3.1 North America
7.3.2 Europe
7.3.3 Asia Pacific
7.3.4 Rest of the World
7.4 Company Profiles
7.4.1 Kellogg’s
7.4.1.1 Business Description & Financial Analysis
7.4.1.2 SWOT Analysis
7.4.1.3 Products & Services Offered
7.4.1.4 Strategic Alliances between Business Partners
7.4.2 PepsiCo Inc.
7.4.2.1 Business Description & Financial Analysis
7.4.2.2 SWOT Analysis
7.4.2.3 Products & Services Offered
7.4.2.4 Strategic Alliances between Business Partners
7.4.3 Quaker Oats Company
7.4.3.1 Business Description & Financial Analysis
7.4.3.2 SWOT Analysis
7.4.3.3 Products & Services Offered
7.4.3.4 Strategic Alliances between Business Partners
7.4.4 Nestle S.A.
7.4.4.1 Business Description & Financial Analysis
7.4.4.2 SWOT Analysis
7.4.4.3 Products & Services Offered
7.4.4.4 Strategic Alliances between Business Partners
7.4.5 Post Holding Company
7.4.5.1 Business Description & Financial Analysis
7.4.5.2 SWOT Analysis
7.4.5.3 Products & Services Offered
7.4.5.4 Strategic Alliances between Business Partners
7.4.6 NATURE’S PATH COMPANY
7.4.6.1 Business Description & Financial Analysis
7.4.6.2 SWOT Analysis
7.4.6.3 Products & Services Offered
7.4.6.4 Strategic Alliances between Business Partners
7.4.7 General Mills Inc.
7.4.7.1 Business Description & Financial Analysis
7.4.7.2 SWOT Analysis
7.4.7.3 Products & Services Offered
7.4.7.4 Strategic Alliances between Business Partners
7.4.8 The Hain Celestial Group Inc.
7.4.8.1 Business Description & Financial Analysis
7.4.8.2 SWOT Analysis
7.4.8.3 Products & Services Offered
7.4.8.4 Strategic Alliances between Business Partners
7.4.9 Marico Ltd.
7.4.9.1 Business Description & Financial Analysis
7.4.9.2 SWOT Analysis
7.4.9.3 Products & Services Offered
7.4.9.4 Strategic Alliances between Business Partners
7.4.10 Dr. August Oetkar AG
7.4.10.1 Business Description & Financial Analysis
7.4.10.2 SWOT Analysis
7.4.10.3 Products & Services Offered
7.4.10.4 Strategic Alliances between Business Partners
7.4.11 Other Companies
7.4.11.1 Business Description & Financial Analysis
7.4.11.2 SWOT Analysis
7.4.11.3 Products & Services Offered
7.4.11.4 Strategic Alliances between Business Partners
8 RESEARCH METHODOLOGY
8.1 Market Introduction
8.1.1 Market Definition
8.1.2 Market Scope & Segmentation
8.2 Information Procurement
8.2.1 Secondary Research
8.2.1.1 Purchased Databases
8.2.1.2 GMEs Internal Data Repository
8.2.1.3 Secondary Resources & Third Party Perspectives
8.2.1.4 Company Information Sources
8.2.2 Primary Research
8.2.2.1 Various Types of Respondents for Primary Interviews
8.2.2.2 Number of Interviews Conducted throughout the Research Process
8.2.2.3 Primary Stakeholders
8.2.2.4 Discussion Guide for Primary Participants
8.2.3 Expert Panels
8.2.3.1 Expert Panels Across 30+ Industry
8.2.4 Paid Local Experts
8.2.4.1 Paid Local Experts Across 30+ Industry Across each Region
8.3 Market Estimation
8.3.1 Top-Down Approach
8.3.1.1 Macro-Economic Indicators Considered
8.3.1.2 Micro-Economic Indicators Considered
8.3.2 Bottom Up Approach
8.3.2.1 Company Share Analysis Approach
8.3.2.2 Estimation of Potential Product Sales
8.4 Data Triangulation
8.4.1 Data Collection
8.4.2 Time Series, Cross Sectional & Panel Data Analysis
8.4.3 Cluster Analysis
8.5 Analysis and Output
8.5.1 Inhouse AI Based Real Time Analytics Tool
8.5.2 Output From Desk & Primary Research
8.6 Research Assumptions & Limitations
8.6.1 Research Assumptions
8.6.2 Research Limitations
LIST OF TABLES
1 Global Edible Flakes Market, By Product, 2021-2029 (USD Million)
2 Corn Market, By Region, 2021-2029 (USD Million)
3 Oat Market, By Region, 2021-2029 (USD Million)
4 Wheat Market, By Region, 2021-2029 (USD Million)
5 Others Market, By Region, 2021-2029 (USD Million)
6 Global Edible Flakes Market, By Distribution Channel, 2021-2029 (USD Million)
7 Offline Market, By Region, 2021-2029 (USD Million)
8 Online Market, By Region, 2021-2029 (USD Million)
9 Regional Analysis, 2021-2029 (USD Million)
10 North America Edible Flakes Market, By Product, 2021-2029 (USD Million)
11 North America Edible Flakes Market, By Distribution Channel, 2021-2029 (USD Million)
12 North America Edible Flakes Market, By Country, 2021-2029 (USD Million)
13 U.S. Edible Flakes Market, By Product, 2021-2029 (USD Million)
14 U.S. Edible Flakes Market, By Distribution Channel, 2021-2029 (USD Million)
15 Canada Edible Flakes Market, By Product, 2021-2029 (USD Million)
16 Canada Edible Flakes Market, By Distribution Channel, 2021-2029 (USD Million)
17 Mexico Edible Flakes Market, By Product, 2021-2029 (USD Million)
18 Mexico Edible Flakes Market, By Distribution Channel, 2021-2029 (USD Million)
19 Europe Edible Flakes Market, By Product, 2021-2029 (USD Million)
20 Europe Edible Flakes Market, By Distribution Channel, 2021-2029 (USD Million)
21 Europe Edible Flakes Market, By Country, 2021-2029 (USD Million)
22 Germany Edible Flakes Market, By Product, 2021-2029 (USD Million)
23 Germany Edible Flakes Market, By Distribution Channel, 2021-2029 (USD Million)
24 U.K. Edible Flakes Market, By Product, 2021-2029 (USD Million)
25 U.K. Edible Flakes Market, By Distribution Channel, 2021-2029 (USD Million)
26 France Edible Flakes Market, By Product, 2021-2029 (USD Million)
27 France Edible Flakes Market, By Distribution Channel, 2021-2029 (USD Million)
28 Italy Edible Flakes Market, By Product, 2021-2029 (USD Million)
29 Italy Edible Flakes Market, By Distribution Channel, 2021-2029 (USD Million)
30 Spain Edible Flakes Market, By Product, 2021-2029 (USD Million)
31 Spain Edible Flakes Market, By Distribution Channel, 2021-2029 (USD Million)
32 Netherlands Edible Flakes Market, By Product, 2021-2029 (USD Million)
33 Netherlands Edible Flakes Market, By Distribution Channel, 2021-2029 (USD Million)
34 Rest Of Europe Edible Flakes Market, By Product, 2021-2029 (USD Million)
35 Rest Of Europe Edible Flakes Market, By Distribution Channel, 2021-2029 (USD Million)
36 Asia Pacific Edible Flakes Market, By Product, 2021-2029 (USD Million)
37 Asia Pacific Edible Flakes Market, By Distribution Channel, 2021-2029 (USD Million)
38 Asia Pacific Edible Flakes Market, By Country, 2021-2029 (USD Million)
39 China Edible Flakes Market, By Product, 2021-2029 (USD Million)
40 China Edible Flakes Market, By Distribution Channel, 2021-2029 (USD Million)
41 Japan Edible Flakes Market, By Product, 2021-2029 (USD Million)
42 Japan Edible Flakes Market, By Distribution Channel, 2021-2029 (USD Million)
43 India Edible Flakes Market, By Product, 2021-2029 (USD Million)
44 India Edible Flakes Market, By Distribution Channel, 2021-2029 (USD Million)
45 South Korea Edible Flakes Market, By Product, 2021-2029 (USD Million)
46 South Korea Edible Flakes Market, By Distribution Channel, 2021-2029 (USD Million)
47 Singapore Edible Flakes Market, By Product, 2021-2029 (USD Million)
48 Singapore Edible Flakes Market, By Distribution Channel, 2021-2029 (USD Million)
49 Thailand Edible Flakes Market, By Product, 2021-2029 (USD Million)
50 Thailand Edible Flakes Market, By Distribution Channel, 2021-2029 (USD Million)
51 Malaysia Edible Flakes Market, By Product, 2021-2029 (USD Million)
52 Malaysia Edible Flakes Market, By Distribution Channel, 2021-2029 (USD Million)
53 Indonesia Edible Flakes Market, By Product, 2021-2029 (USD Million)
54 Indonesia Edible Flakes Market, By Distribution Channel, 2021-2029 (USD Million)
55 Vietnam Edible Flakes Market, By Product, 2021-2029 (USD Million)
56 Vietnam Edible Flakes Market, By Distribution Channel, 2021-2029 (USD Million)
57 Taiwan Edible Flakes Market, By Product, 2021-2029 (USD Million)
58 Taiwan Edible Flakes Market, By Distribution Channel, 2021-2029 (USD Million)
59 Rest of APAC Edible Flakes Market, By Product, 2021-2029 (USD Million)
60 Rest of APAC Edible Flakes Market, By Distribution Channel, 2021-2029 (USD Million)
61 Middle East and Africa Edible Flakes Market, By Product, 2021-2029 (USD Million)
62 Middle East and Africa Edible Flakes Market, By Distribution Channel, 2021-2029 (USD Million)
63 Middle East and Africa Edible Flakes Market, By country, 2021-2029 (USD Million)
64 Saudi Arabia Edible Flakes Market, By Product, 2021-2029 (USD Million)
65 Saudi Arabia Edible Flakes Market, By Distribution Channel, 2021-2029 (USD Million)
66 UAE Edible Flakes Market, By Product, 2021-2029 (USD Million)
67 UAE Edible Flakes Market, By Distribution Channel, 2021-2029 (USD Million)
68 Israel Edible Flakes Market, By Product, 2021-2029 (USD Million)
69 Israel Edible Flakes Market, By Distribution Channel, 2021-2029 (USD Million)
70 South Africa Edible Flakes Market, By Product, 2021-2029 (USD Million)
71 South Africa Edible Flakes Market, By Distribution Channel, 2021-2029 (USD Million)
72 Rest Of Middle East and Africa Edible Flakes Market, By Product, 2021-2029 (USD Million)
73 Rest Of Middle East and Africa Edible Flakes Market, By Distribution Channel, 2021-2029 (USD Million)
74 Central & South America Edible Flakes Market, By Product, 2021-2029 (USD Million)
75 Central & South America Edible Flakes Market, By Distribution Channel, 2021-2029 (USD Million)
76 Central & South America Edible Flakes Market, By Country, 2021-2029 (USD Million)
77 Brazil Edible Flakes Market, By Product, 2021-2029 (USD Million)
78 Brazil Edible Flakes Market, By Distribution Channel, 2021-2029 (USD Million)
79 Chile Edible Flakes Market, By Product, 2021-2029 (USD Million)
80 Chile Edible Flakes Market, By Distribution Channel, 2021-2029 (USD Million)
81 Argentina Edible Flakes Market, By Product, 2021-2029 (USD Million)
82 Argentina Edible Flakes Market, By Distribution Channel, 2021-2029 (USD Million)
83 Rest Of Central & South America Edible Flakes Market, By Product, 2021-2029 (USD Million)
84 Rest Of Central & South America Edible Flakes Market, By Distribution Channel, 2021-2029 (USD Million)
85 Kellogg’s: Products & Services Offering
86 PepsiCo Inc.: Products & Services Offering
87 Quaker Oats Company: Products & Services Offering
88 Nestle S.A.: Products & Services Offering
89 Post Holding Company: Products & Services Offering
90 NATURE’S PATH COMPANY: Products & Services Offering
91 General Mills Inc.: Products & Services Offering
92 The Hain Celestial Group Inc.: Products & Services Offering
93 Marico Ltd.: Products & Services Offering
94 Dr. August Oetkar AG: Products & Services Offering
95 Other Companies: Products & Services Offering
LIST OF FIGURES
1 Global Edible Flakes Market Overview
2 Global Edible Flakes Market Value From 2021-2029 (USD Million)
3 Global Edible Flakes Market Share, By Product (2023)
4 Global Edible Flakes Market Share, By Distribution Channel (2023)
5 Global Edible Flakes Market, By Region (Asia Pacific Market)
6 Technological Trends In Global Edible Flakes Market
7 Four Quadrant Competitor Positioning Matrix
8 Impact Of Macro & Micro Indicators On The Market
9 Impact Of Key Drivers On The Global Edible Flakes Market
10 Impact Of Challenges On The Global Edible Flakes Market
11 Porter’s Five Forces Analysis
12 Global Edible Flakes Market: By Product Scope Key Takeaways
13 Global Edible Flakes Market, By Product Segment: Revenue Growth Analysis
14 Corn Market, By Region, 2021-2029 (USD Million)
15 Oat Market, By Region, 2021-2029 (USD Million)
16 Wheat Market, By Region, 2021-2029 (USD Million)
17 Others Market, By Region, 2021-2029 (USD Million)
18 Global Edible Flakes Market: By Distribution Channel Scope Key Takeaways
19 Global Edible Flakes Market, By Distribution Channel Segment: Revenue Growth Analysis
20 Offline Market, By Region, 2021-2029 (USD Million)
21 Online Market, By Region, 2021-2029 (USD Million)
22 Regional Segment: Revenue Growth Analysis
23 Global Edible Flakes Market: Regional Analysis
24 North America Edible Flakes Market Overview
25 North America Edible Flakes Market, By Product
26 North America Edible Flakes Market, By Distribution Channel
27 North America Edible Flakes Market, By Country
28 U.S. Edible Flakes Market, By Product
29 U.S. Edible Flakes Market, By Distribution Channel
30 Canada Edible Flakes Market, By Product
31 Canada Edible Flakes Market, By Distribution Channel
32 Mexico Edible Flakes Market, By Product
33 Mexico Edible Flakes Market, By Distribution Channel
34 Four Quadrant Positioning Matrix
35 Company Market Share Analysis
36 Kellogg’s: Company Snapshot
37 Kellogg’s: SWOT Analysis
38 Kellogg’s: Geographic Presence
39 PepsiCo Inc.: Company Snapshot
40 PepsiCo Inc.: SWOT Analysis
41 PepsiCo Inc.: Geographic Presence
42 Quaker Oats Company: Company Snapshot
43 Quaker Oats Company: SWOT Analysis
44 Quaker Oats Company: Geographic Presence
45 Nestle S.A.: Company Snapshot
46 Nestle S.A.: Swot Analysis
47 Nestle S.A.: Geographic Presence
48 Post Holding Company: Company Snapshot
49 Post Holding Company: SWOT Analysis
50 Post Holding Company: Geographic Presence
51 NATURE’S PATH COMPANY: Company Snapshot
52 NATURE’S PATH COMPANY: SWOT Analysis
53 NATURE’S PATH COMPANY: Geographic Presence
54 General Mills Inc.: Company Snapshot
55 General Mills Inc.: SWOT Analysis
56 General Mills Inc.: Geographic Presence
57 The Hain Celestial Group Inc.: Company Snapshot
58 The Hain Celestial Group Inc.: SWOT Analysis
59 The Hain Celestial Group Inc.: Geographic Presence
60 Marico Ltd..: Company Snapshot
61 Marico Ltd..: SWOT Analysis
62 Marico Ltd..: Geographic Presence
63 Dr. August Oetkar AG: Company Snapshot
64 Dr. August Oetkar AG: SWOT Analysis
65 Dr. August Oetkar AG: Geographic Presence
66 Other Companies: Company Snapshot
67 Other Companies: SWOT Analysis
68 Other Companies: Geographic Presence
The Global Edible Flakes Market has been studied from the year 2019 till 2029. However, the CAGR provided in the report is from the year 2024 to 2029. The research methodology involved three stages: Desk research, Primary research, and Analysis & Output from the entire research process.

The desk research involved a robust background study which meant referring to paid and unpaid databases to understand the market dynamics; mapping contracts from press releases; identifying the key players in the market, studying their product portfolio, competition level, annual reports/SEC filings & investor presentations; and learning the demand and supply-side analysis for the Edible Flakes Market.

The primary research activity included telephonic conversations with more than 50 tier 1 industry consultants, distributors, and end-use product manufacturers.

Finally, based on the above thorough research process, an in-depth analysis was carried out considering the following aspects: market attractiveness, current & future market trends, market share analysis, SWOT analysis of the company and customer analytics.

Frequently Asked Questions

This FREE sample includes market data points, ranging from trend analyses to market estimates & forecasts. See for yourself.
Or view our licence options:
Tailor made solutions just for you
80% of our clients seek made-to-order reports. How do you want us to tailor yours?
OUR CLIENTS


