Global Agriculture Smart Imaging System Market Size, Trends & Analysis - Forecasts to 2026 By Product (Camera, Sensor, Software), By Technology (Multispectral, Hyperspectral), By Region (North America, Asia Pacific, Europe, Latin America, Middle East & Africa); End-User Landscape, Company Market Share Analysis, and Competitor Analysis
Rapid population growth and steady crop production output have put high pressure on food supply in the domestic and international markets. Changing soil structure due to abrupt weather conditions has instigated the farming sector to adopt more advanced products and technologies to maintain continuous production.
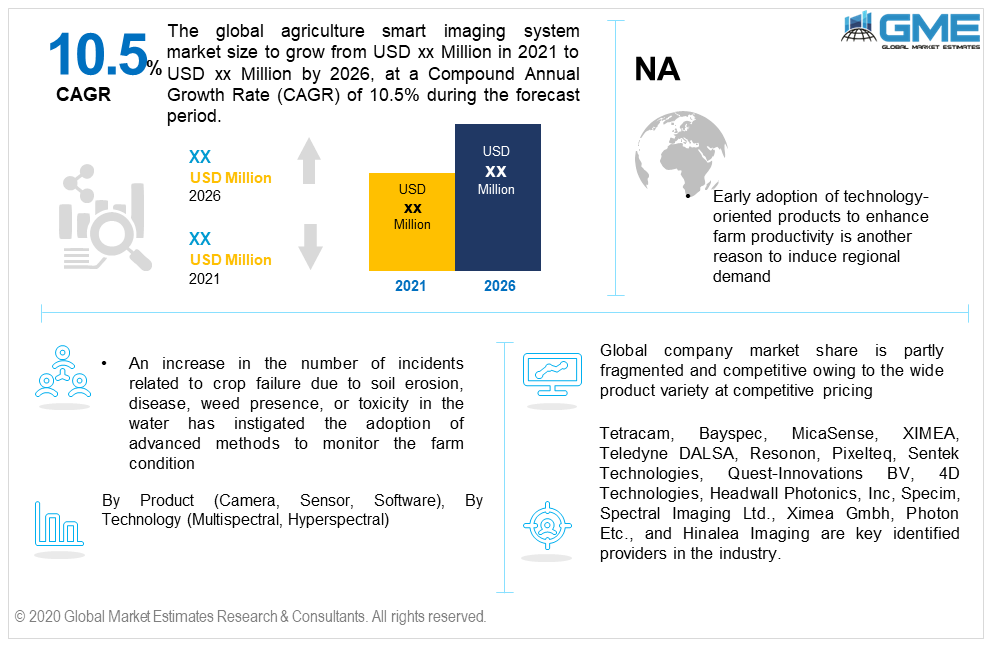
The global agriculture smart imaging system market size will witness more than 10.5% CAGR from 2021 to 2026, with North America accounting for more than 40% of the share. An increase in the number of incidents related to crop failure due to soil erosion, disease, weed presence, or toxicity in the water has instigated the adoption of advanced methods to monitor the farm condition.
The camera and sensor are major potential products to analyze the farm condition through high-quality imaging systems. The faster identification of the problem and high success rates to provide effective solution based on data input is the major advantage offered by these products.

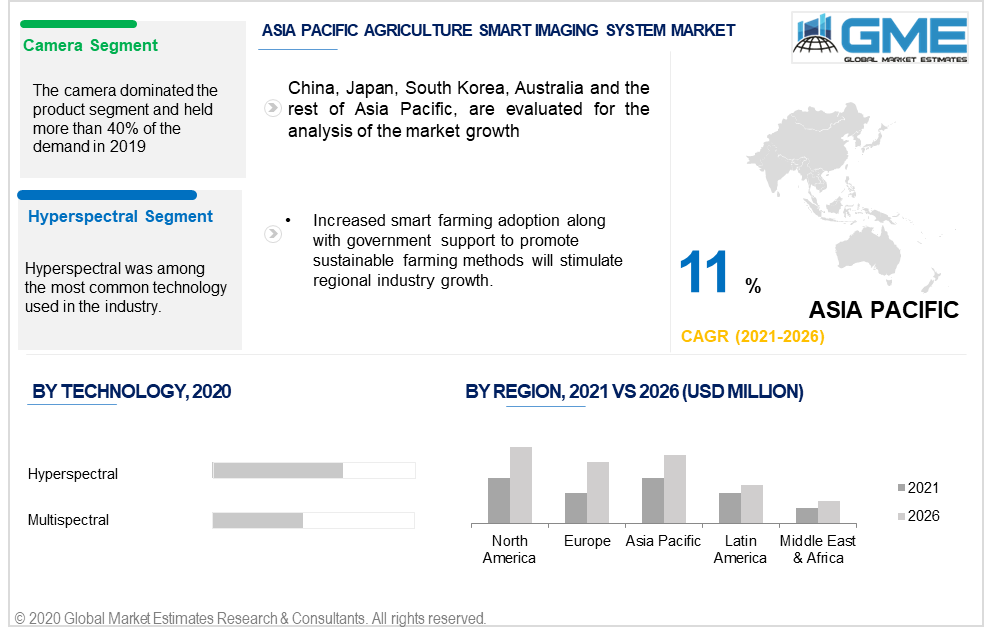
The product segment is segregated into the camera, software, sensor, among others. Cameras are among the most widely used product in the industry and are also intended to witness the fastest growth during the forecast period. Wide coverage, better visualization, and comparatively economical costing are prime success factors to drive demand in this segment.
Soil erosion, water retention, weed presence, and plant diseases are among the major concerns to identify in any farm. Thus, the adoption of these advanced systems not only helps in identifying the problem but also provides the solution based on the input received through different sensors.
Another important product that is engaging high demand is advanced software. The updated software specifically designed for farm monitoring and solutions will witness high growth in the coming years.
Major technologies in the industry include multispectral and hyperspectral. Hyperspectral technology is an innovative and advanced method in the farming industry. Improving overall processing and data analyzing are major advantages offered by these technologies. Increasing adoption of precision farming has positively influenced the deployment and usage of hyperspectral technology to improvise the overall process. Hyperspectral is a non-destructive and non-contact technology that evades the chances of object destruction. For instance, a Hyperspectral camera drone can identify plant weeds, disease, erosion, and crop or soil problems more efficiently.
Multispectral camera remote sensing technology uses Red, Green, Near Infrared, and Red-Edge wavebands to capture invisible and visible vegetation and crops images. The multispectral technology incorporates specific farming software which transforms the output into more meaningful data for further analysis.

North America led the regional demand and held more than 40% of the revenue in 2019. The overall dominance of the region is attributed to the government initiatives and compliances to improvise the overall agriculture industry. Early adoption of technology-oriented products to enhance farm productivity is another reason to induce regional demand. Multiple agricultural organizations are collaborating to provide an educational platform regarding advanced technology usage and adoption in the agriculture sector.
The Asia Pacific region is intended to grow at the fastest CAGR from 2021 to 2026. Increased smart farming adoption along with government support to promote sustainable farming methods will stimulate regional industry growth. The region plays an important role in the global food supply. Thus, the advancement of farming techniques is essential in this region to maintain the optimum supply. Food scarcity due to an imbalance in the demand and supply caused by a decline in agricultural output has prompted the industry to adopt sustainable farming techniques. China, Japan, Singapore, and India are among the key countries investing in precision farming methods.
The European farming sector has observed a notable adoption of these products. The sensor is among the key potential product in the region. Farming sector expansion accompanied by high investment in sustainable farming techniques will stimulate regional product penetration.
The Latin American region will witness significant gains from 2021 to 2026. Brazil, Colombia, Bolivia, and Argentina are farming intensive nations owing to the presence and availability of large-scale arable land that will support the regional product adoption. The region frequently faces abrupt changes in weather conditions which are highly impacting the farming output. Thus, it is essential to adopt advanced methods and technology to monitor the farming situations.
Tetracam, Bayspec, MicaSense, XIMEA, Teledyne DALSA, Resonon, Pixelteq, Sentek Technologies, Quest-Innovations BV, 4D Technologies, Headwall Photonics, Inc, Specim, Spectral Imaging Ltd., Ximea Gmbh, Photon Etc., and Hinalea Imaging are key identified providers in the industry.
Please note: This is not an exhaustive list of companies profiled in the report.
Global company market share is partly fragmented and competitive owing to the wide product variety at competitive pricing. Partnership and collaboration with the end-users along with supply chain enhancement are prime strategies witnessed in the industry. Various companies are collaborating with local suppliers to maximize their product reach.
Improvising brand awareness and recognition through long-term sales contracts with the consumers will be a promising strategy in the coming years.
Chapter 1 Methodology
1.1 Market scope & definitions
1.2 Estimates & forecast calculation
1.3 Historical data overview and validation
1.4 Data sources
1.4.1 Secondary
1.4.2 Primary
Chapter 2 Report Outlook
2.1 Agriculture Smart Imaging System industry overview, 2019-2026
2.1.1 Industry overview
2.1.2 Product overview
2.1.3 Technology overview
2.1.4 Regional overview
Chapter 3 Agriculture Smart Imaging System Market Trends
3.1 Market segmentation
3.2 Industry background, 2019-2026
3.3 Market key trends
3.3.1 Positive trends
3.3.2 Industry challenges
3.4 Prospective growth scenario
3.4.1 Product growth scenario
3.5 Industry influence over product growth
3.6 Porter’s analysis
3.7 PESTEL analysis
3.8 Value chain & supply chain analysis
3.9 Regulatory framework
3.9.1 North America
3.9.2 Europe
3.9.3 APAC
3.9.4 LATAM
3.9.5 MEA
3.10 Technology overview
3.11 Market share analysis, 2020
3.11.1 Company positioning overview, 2020
Chapter 4 Agriculture Smart Imaging System Market, By Product
4.1 Product Outlook
4.2 Camera
4.2.1 Market size, by region, 2019-2026 (USD Million)
4.3 Sensor
4.3.1 Market size, by region, 2019-2026 (USD Million)
4.4 Software
4.4.1 Market size, by region, 2019-2026 (USD Million)
4.5 Others
4.5.1 Market size, by region, 2019-2026 (USD Million)
Chapter 5 Agriculture Smart Imaging System Market, By Technology
5.1 Technology Outlook
5.2 Mutlispectral
5.2.1 Market size, by region, 2019-2026 (USD Million)
5.3 Hyperspectral
5.3.1 Market size, by region, 2019-2026 (USD Million)
Chapter 6 Agriculture Smart Imaging System Market, By Region
6.1 Regional outlook
6.2 North America
6.2.1 Market size, by country 2019-2026 (USD Million)
6.2.2 Market size, by product, 2019-2026 (USD Million)
6.2.3 Market size, by technology, 2019-2026 (USD Million)
6.2.4 U.S.
6.2.4.1 Market size, by product, 2019-2026 (USD Million)
6.2.4.2 Market size, by technology, 2019-2026 (USD Million)
6.2.5 Canada
6.2.5.1 Market size, by product, 2019-2026 (USD Million)
6.2.5.2 Market size, by technology, 2019-2026 (USD Million)
6.3 Europe
6.3.1 Market size, by country 2019-2026 (USD Million)
6.3.2 Market size, by product, 2019-2026 (USD Million)
6.3.3 Market size, by technology, 2019-2026 (USD Million)
6.3.4 Germany
6.2.4.1 Market size, by product, 2019-2026 (USD Million)
6.2.4.2 Market size, by technology, 2019-2026 (USD Million)
6.3.5 UK
6.3.5.1 Market size, by product, 2019-2026 (USD Million)
6.3.5.2 Market size, by technology, 2019-2026 (USD Million)
6.3.6 France
6.3.6.1 Market size, by product, 2019-2026 (USD Million)
6.3.6.2 Market size, by technology, 2019-2026 (USD Million)
6.3.7 Italy
6.3.7.1 Market size, by product, 2019-2026 (USD Million)
6.3.7.2 Market size, by technology, 2019-2026 (USD Million)
6.3.8 Spain
6.3.8.1 Market size, by product, 2019-2026 (USD Million)
6.3.8.2 Market size, by technology, 2019-2026 (USD Million)
6.3.9 Russia
6.3.9.1 Market size, by product, 2019-2026 (USD Million)
6.3.9.2 Market size, by technology, 2019-2026 (USD Million)
6.4 Asia Pacific
6.4.1 Market size, by country 2019-2026 (USD Million)
6.4.2 Market size, by product, 2019-2026 (USD Million)
6.4.3 Market size, by technology, 2019-2026 (USD Million)
6.4.4 China
6.4.4.1 Market size, by product, 2019-2026 (USD Million)
6.4.4.2 Market size, by technology, 2019-2026 (USD Million)
6.4.5 Japan
6.4.5.1 Market size, by product, 2019-2026 (USD Million)
6.4.5.2 Market size, by technology, 2019-2026 (USD Million)
6.4.6 Australia
6.4.6.1 Market size, by product, 2019-2026 (USD Million)
6.4.6.2 Market size, by technology, 2019-2026 (USD Million)
6.4.7 India
6.4.7.1 Market size, by product, 2019-2026 (USD Million)
6.4.7.2 Market size, by technology, 2019-2026 (USD Million)
6.4.8 South Korea
6.4.8.1 Market size, by product, 2019-2026 (USD Million)
6.4.8.2 Market size, by technology, 2019-2026 (USD Million)
6.5 Latin America
6.5.1 Market size, by country 2019-2026 (USD Million)
6.5.2 Market size, by product, 2019-2026 (USD Million)
6.5.3 Market size, by technology, 2019-2026 (USD Million)
6.5.4 Brazil
6.5.4.1 Market size, by product, 2019-2026 (USD Million)
6.5.4.2 Market size, by technology, 2019-2026 (USD Million)
6.5.5 Mexico
6.5.5.1 Market size, by product, 2019-2026 (USD Million)
6.5.5.2 Market size, by technology, 2019-2026 (USD Million)
6.6 MEA
6.6.1 Market size, by country 2019-2026 (USD Million)
6.6.2 Market size, by product, 2019-2026 (USD Million)
6.6.3 Market size, by technology, 2019-2026 (USD Million)
6.6.4 Saudi Arabia
6.6.4.1 Market size, by product, 2019-2026 (USD Million)
6.6.4.2 Market size, by technology, 2019-2026 (USD Million)
6.6.5 UAE
6.6.5.1 Market size, by product, 2019-2026 (USD Million)
6.6.5.2 Market size, by technology, 2019-2026 (USD Million)
Chapter 7 Company Landscape
7.1 Competitive analysis, 2020
7.2 Tetracam
7.2.1 Company overview
7.2.2 Financial analysis
7.2.3 Strategic positioning
7.2.4 Info graphic analysis
7.3 Bayspec
7.3.1 Company overview
7.3.2 Financial analysis
7.3.3 Strategic positioning
7.3.4 Info graphic analysis
7.4 MicaSense
7.4.1 Company overview
7.4.2 Financial analysis
7.4.3 Strategic positioning
7.4.4 Info graphic analysis
7.5 XIMEA
7.5.1 Company overview
7.5.2 Financial analysis
7.5.3 Strategic positioning
7.5.4 Info graphic analysis
7.6 Teledyne DALSA
7.6.1 Company overview
7.6.2 Financial analysis
7.6.3 Strategic positioning
7.6.4 Info graphic analysis
7.7 Resonon
7.7.1 Company overview
7.7.2 Financial analysis
7.7.3 Strategic positioning
7.7.4 Info graphic analysis
7.8 Pixelteq
7.8.1 Company overview
7.8.2 Financial analysis
7.8.3 Strategic positioning
7.8.4 Info graphic analysis
7.9 Sentek Technologies
7.9.1 Company overview
7.9.2 Financial analysis
7.9.3 Strategic positioning
7.9.4 Info graphic analysis
7.10 Quest-Innovations BV
7.10.1 Company overview
7.10.2 Financial analysis
7.10.3 Strategic positioning
7.10.4 Info graphic analysis
7.11 4D Technologies
7.11.1 Company overview
7.11.2 Financial analysis
7.11.3 Strategic positioning
7.11.4 Info graphic analysis
7.12 Headwall Photonics, Inc
7.12.1 Company overview
7.12.2 Financial analysis
7.12.3 Strategic positioning
7.12.4 Info graphic analysis
7.13 Specim, Spectral Imaging Ltd.
7.13.1 Company overview
7.13.2 Financial analysis
7.13.3 Strategic positioning
7.13.4 Info graphic analysis
7.14 Ximea Gmbh
7.14.1 Company overview
7.14.2 Financial analysis
7.14.3 Strategic positioning
7.14.4 Info graphic analysis
7.15 Photon Etc.
7.15.1 Company overview
7.15.2 Financial analysis
7.15.3 Strategic positioning
7.15.4 Info graphic analysis
7.16 Hinalea Imaging
7.16.1 Company overview
7.16.2 Financial analysis
7.16.3 Strategic positioning
7.16.4 Info graphic analysis
The Global Agriculture Smart Imaging System Market has been studied from the year 2019 till 2026. However, the CAGR provided in the report is from the year 2021 to 2026. The research methodology involved three stages: Desk research, Primary research, and Analysis & Output from the entire research process.

The desk research involved a robust background study which meant referring to paid and unpaid databases to understand the market dynamics; mapping contracts from press releases; identifying the key players in the market, studying their product portfolio, competition level, annual reports/SEC filings & investor presentations; and learning the demand and supply-side analysis for the Agriculture Smart Imaging System Market.

The primary research activity included telephonic conversations with more than 50 tier 1 industry consultants, distributors, and end-use product manufacturers.

Finally, based on the above thorough research process, an in-depth analysis was carried out considering the following aspects: market attractiveness, current & future market trends, market share analysis, SWOT analysis of the company and customer analytics.

Frequently Asked Questions
Tailor made solutions just for you
80% of our clients seek made-to-order reports. How do you want us to tailor yours?
OUR CLIENTS