This report was recently updated on August 14 2025 with the latest and most recent
market numbers
Global AI-Powered Personalization Market Size, Trends & Analysis - Forecasts to 2028 By Component (Software and Services), By Applications (E-commerce, Marketing, Customer Service, and Others), and By Region (North America, Asia Pacific, Central & South America, Europe, and Middle East and Africa), Competitive Landscape, Company Market Share Analysis, and End User Analysis
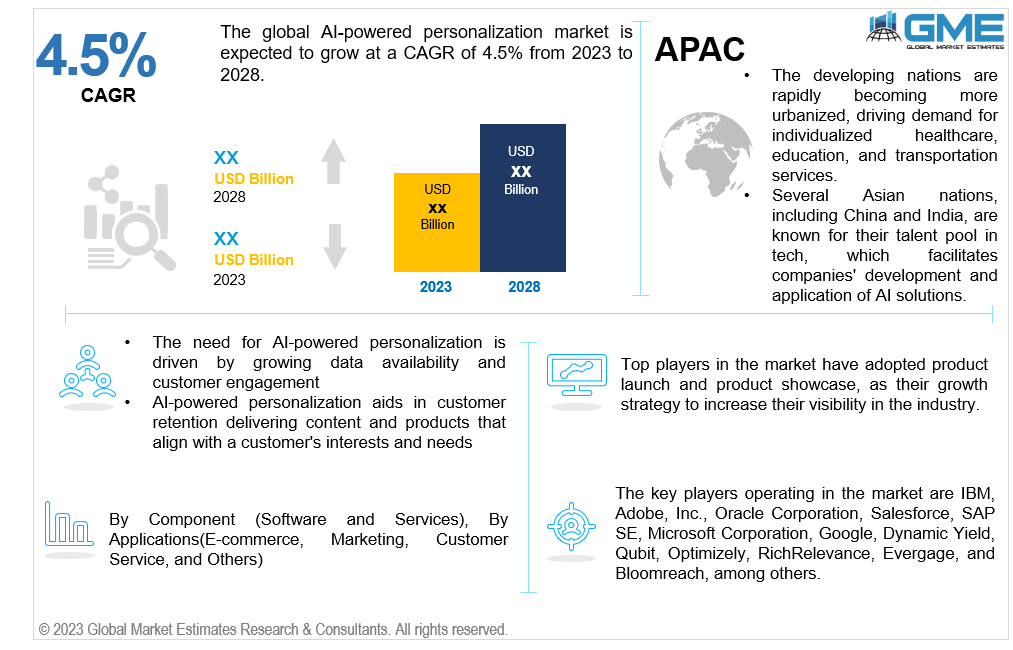
The global AI-powered personalization market is expected to grow at a CAGR of 4.5% from 2023 to 2028. The term "AI-powered personalization" describes using artificial intelligence to make recommendations, alter content, and create personalized interactions for each user based on their past usage, preferences, and behavior.
The main growth drivers of the AI-powered personalization market are increased data availability and the need for customer engagement. There are several sources of data available. Data can be collected digitally via social media, online behavior, e-commerce websites, and, generally, through preferred websites online. The vast data collected through these channels can be processed using artificial intelligence and machine learning to understand individual behavior and establish patterns. Several businesses also make use of AI-powered personalization. The data collected is used to interpret consumer behavior, make customized plans, and offer personalized approaches to help strengthen their relationship. They get a competitive advantage by delivering superior customer experiences and driving revenue growth. Personalized content recommendations are essential for media streaming services, news websites, and e-learning platforms, driving the adoption of AI-powered personalization, thereby ensuring a better target audience.
The market has some restraints as well. Cost of implementation and data privacy and security are some of the major concerns. AI-powered personalization requires advanced AI tools and trained professionals, an added expense that can burden small and medium-sized enterprises and businesses. This can deter them from investing in AI-powered personalization. Also, they have access to vast amounts of personal data and can be a potential prey to cyberattacks. Also, striking the right balance between personalization and respecting user privacy is a significant challenge, especially with the increasing focus on data protection regulations.
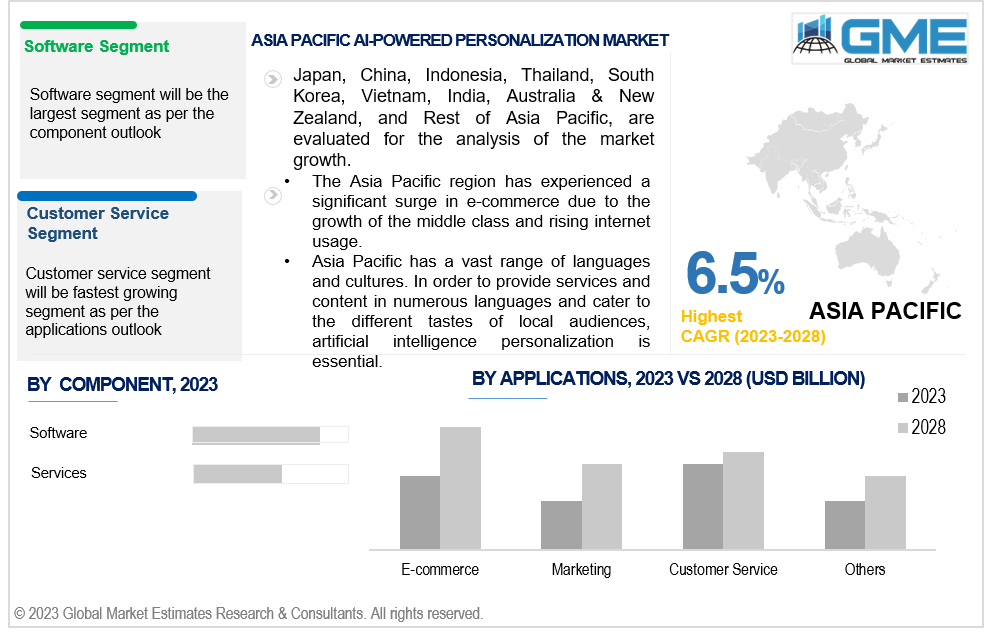
Based on component, the market is segmented into software and services. The software segment is expected to dominate the market over the forecast period. This can be attributed to the fact that AI as software offers autonomy to the organization. The software empowers organizations or companies to implement automation tailored to their size, structure, and specific requirements. It is also cost-efficient because it removes the need to outsource AI-related services for regular functioning. The software also comes in handy for developers building, training, and deploying AI-focused applications.
The services segment is projected to exhibit the highest CAGR over the forecast period. It entails a third-party offering sophisticated AI capabilities to companies through either a single upfront payment or a recurring subscription fee. It removes major human interventions and automates several regular activities which may be repetitive in nature. It is cloud-based for the most part with low risk and without a significant up-front investment.
Based on applications, the market is segmented into e-commerce, marketing, customer service, and others. The e-commerce segment is anticipated to hold the largest share of the market over the forecast period. This can be attributed to the fact that e-commerce platforms offer many choices to people. AI-powered personalization can assist customers by giving them product recommendations based on their searches, past purchases, and preferences regarding similar products or products that will complement the previously purchased product. With AI personalization, the whole shopping experience can be made to match the particular user's preferences, including homepage displays, search results, and product pages.
The customer service segment is projected to grow fastest during the forecast period. This is because artificial intelligence (AI) scrutinizes consumer feedback and evaluations to detect trends, emotions, and potential areas of development. This enables organizations to pinpoint issues and implement focused improvements. AI can examine client data to ensure that human agents' responses are customized to the client's preferences and past interactions, improving the level of service. AI-powered chatbots and virtual assistants provide personalized support and recommendations to clients. They can comprehend user questions and provide customized answers.
North America is analysed to be the largest region in the global AI-powered personalization market during the forecast period. The region's robust technological infrastructure and high IT and software companies’ concentration have stimulated AI innovation and investment. The adoption of AI-powered personalization has been driven by the booming e-commerce industry in North America, where businesses are using AI to improve customer experiences, boost sales, and obtain a competitive advantage. North America's affluent and diversified consumer base demands personalized experiences, so companies in many sectors prioritize personalization, from marketing and customer service to e-commerce. AI-powered personalization is altering how companies interact with and serve their customers.
Asia Pacific is analysed to be the fastest-growing region in the global AI-powered personalization market during the forecast period. The Asia Pacific region has experienced a significant surge in e-commerce due to the growth of the middle class and rising internet usage. Asia Pacific has a vast range of languages and cultures. In order to provide services and content in numerous languages and cater to the different tastes of local audiences, artificial intelligence personalization is essential. Asia Pacific's emerging nations are rapidly becoming more urbanized, driving demand for individualized services in healthcare, education, and transportation. A robust reservoir of tech talent exists in several Asian nations, including China and India, which facilitates companies' development and application of AI solutions.
The key players operating in the market are IBM, Adobe, Inc., Oracle Corporation, Salesforce, SAP SE, Microsoft Corporation, Google, Dynamic Yield, Qubit, Optimizely, RichRelevance, Evergage, and Bloomreach, among others.
Please note: This is not an exhaustive list of companies profiled in the report.
On October 17, 2023, Oracle NetSuite announced new generative AI-powered capabilities to help organizations reach their goals faster and can help users leverage company-specific, relevant data from across NetSuite to create and refine contextual and personalized content. With NetSuite Text Enhance, finance and accounting, HR, supply chain and operations, sales and marketing, and customer support teams can leverage AI to produce relevant drafts or refine existing content.
On October 19, 2023, Google announced a series of strategic initiatives harnessing artificial intelligence (AI) to enhance user experiences and contribute to various sectors in the country at the 9th Google for India event in Delhi, India. There was also an announcement regarding a strategic partnership with Open Network for Digital Commerce (ONDC) to advance YouTube News, Google Merchant Centre, and Google Play Protect.
1 STRATEGIC INSIGHTS ON NEW REVENUE POCKETS
1.1 Strategic Opportunity & Attractiveness Analysis
1.1.1 Hot Revenue Pockets
1.1.2 Market Attractiveness Score
1.1.3 Revenue Impacting Opportunity
1.1.4 High Growing Region/Country
1.1.5 Competitor Analysis
1.1.6 Consumer Analysis
1.2 Global Market Estimates' View
1.3 Strategic Insights across Business Functions
1.3.1 For Chief Executive Officers
1.3.2 For Chief Marketing Officers
1.3.3 For Chief Strategy Officers
1.4 Evaluate the Potential of your Existing Business Lines vs. New Lines to Enter Into
2 TECHNOLOGICAL TRENDS
2.1 Technological Adoption Rate
2.2 Current Trend Impact Analysis
2.3 Future Trend Impact Analysis
3 GLOBAL MARKET OUTLOOK
3.1 Market Pyramid Analysis
3.1.1 Introduction
3.1.2 Adjacent Market Opportunities
3.1.3 Ancillary Market Opportunities
3.2 Demand Side Analysis
3.2.1 Market Drivers: Impact Analysis
3.2.2 Market Restraints: Impact Analysis
3.2.3 Market Opportunities: Impact Analysis
3.2.4 Market Challenges: Impact Analysis
3.3 Supply Side Analysis
3.3.1 Porter’s Five Forces Analysis
3.3.1.1 Threat of New Entrants
3.3.1.2 Threat of New Substitutes
3.3.1.3 Bargaining Power of Suppliers
3.3.1.4 Bargaining Power of Buyers
3.3.1.5 Intensity of Competitive Rivalry
3.3.2 SWOT Analysis; By Factor (Political & Legal, Economic, and Technological)
3.3.2.1 Political Landscape
3.3.2.2 Economic Landscape
3.3.2.3 Social Landscape
3.3.2.4 Technology Landscape
3.3.3 Value Chain Analysis
3.3.4 Trend Analysis
3.3.5 Gap Analysis
3.3.6 Cost Analysis
4 GLOBAL AI-POWERED PERSONALIZATION MARKET, BY COMPONENT
4.1 Introduction
4.2 AI-Powered Personalization Market: Component Scope Key Takeaways
4.3 Revenue Growth Analysis, 2022 & 2028
4.4 Software
4.4.1 Software Market Estimates and Forecast, 2020-2028 (USD Million)
4.5 Services
4.5.1 Services Market Estimates and Forecast, 2020-2028 (USD Million)
5 GLOBAL AI-POWERED PERSONALIZATION MARKET, BY APPLICATIONS
5.1 Introduction
5.2 AI-Powered Personalization Market: Applications Scope Key Takeaways
5.3 Revenue Growth Analysis, 2022 & 2028
5.4 E-commerce
5.4.1 E-commerce Market Estimates and Forecast, 2020-2028 (USD Million)
5.5 Marketing
5.5.1 Marketing Market Estimates and Forecast, 2020-2028 (USD Million)
5.6 Customer Service
5.6.1 Customer Service Market Estimates and Forecast, 2020-2028 (USD Million)
5.7 Others
5.7.1 Others Market Estimates and Forecast, 2020-2028 (USD Million)
6 GLOBAL AI-POWERED PERSONALIZATION MARKET, BY REGION
6.1 Introduction
6.2 North America AI-Powered Personalization Market Estimates and Forecast, 2020-2028 (USD Million)
6.2.1 By Component
6.2.2 By Applications
6.2.3 By Country
6.2.3.1 U.S. AI-Powered Personalization Market Estimates and Forecast, 2020-2028 (USD Million)
6.2.3.1.1 By Component
6.2.3.1.2 By Applications
6.2.3.2 Canada AI-Powered Personalization Market Estimates and Forecast, 2020-2028 (USD Million)
6.2.3.2.1 By Component
6.2.3.2.2 By Applications
6.2.3.3 Mexico AI-Powered Personalization Market Estimates and Forecast, 2020-2028 (USD Million)
6.2.3.3.1 By Component
6.2.3.3.2 By Applications
6.3 Europe AI-Powered Personalization Market Estimates and Forecast, 2020-2028 (USD Million)
6.3.1 By Component
6.3.2 By Applications
6.3.3 By Country
6.3.3.1 Germany AI-Powered Personalization Market Estimates and Forecast, 2020-2028 (USD Million)
6.3.3.1.1 By Component
6.3.3.1.2 By Applications
6.3.3.2 U.K. AI-Powered Personalization Market Estimates and Forecast, 2020-2028 (USD Million)
6.3.3.2.1 By Component
6.3.3.2.2 By Applications
6.3.3.3 France AI-Powered Personalization Market Estimates and Forecast, 2020-2028 (USD Million)
6.3.3.3.1 By Component
6.3.3.3.2 By Applications
6.3.3.4 Italy AI-Powered Personalization Market Estimates and Forecast, 2020-2028 (USD Million)
6.3.3.4.1 By Component
6.3.3.4.2 By Applications
6.3.3.5 Spain AI-Powered Personalization Market Estimates and Forecast, 2020-2028 (USD Million)
6.3.3.5.1 By Component
6.3.3.5.2 By Applications
6.3.3.6 Netherlands AI-Powered Personalization Market Estimates and Forecast, 2020-2028 (USD Million)
6.3.3.6.1 By Component
6.3.3.6.2 By Applications
6.3.3.7 Rest of Europe AI-Powered Personalization Market Estimates and Forecast, 2020-2028 (USD Million)
6.3.3.6.1 By Component
6.3.3.6.2 By Applications
6.4 Asia Pacific AI-Powered Personalization Market Estimates and Forecast, 2020-2028 (USD Million)
6.4.1 By Component
6.4.2 By Applications
6.4.3 By Country
6.4.3.1 China AI-Powered Personalization Market Estimates and Forecast, 2020-2028 (USD Million)
6.4.3.1.1 By Component
6.4.3.1.2 By Applications
6.4.3.2 Japan AI-Powered Personalization Market Estimates and Forecast, 2020-2028 (USD Million)
6.4.3.2.1 By Component
6.4.3.2.2 By Applications
6.4.3.3 India AI-Powered Personalization Market Estimates and Forecast, 2020-2028 (USD Million)
6.4.3.3.1 By Component
6.4.3.3.2 By Applications
6.4.3.4 South Korea AI-Powered Personalization Market Estimates and Forecast, 2020-2028 (USD Million)
6.4.3.4.1 By Component
6.4.3.4.2 By Applications
6.4.3.5 Singapore AI-Powered Personalization Market Estimates and Forecast, 2020-2028 (USD Million)
6.4.3.5.1 By Component
6.4.3.5.2 By Applications
6.4.3.6 Malaysia AI-Powered Personalization Market Estimates and Forecast, 2020-2028 (USD Million)
6.4.3.6.1 By Component
6.4.3.6.2 By Applications
6.4.3.7 Thailand AI-Powered Personalization Market Estimates and Forecast, 2020-2028 (USD Million)
6.4.3.6.1 By Component
6.4.3.6.2 By Applications
6.4.3.8 Indonesia AI-Powered Personalization Market Estimates and Forecast, 2020-2028 (USD Million)
6.4.3.7.1 By Component
6.4.3.7.2 By Applications
6.4.3.9 Vietnam AI-Powered Personalization Market Estimates and Forecast, 2020-2028 (USD Million)
6.4.3.8.1 By Component
6.4.3.8.2 By Applications
6.4.3.10 Taiwan AI-Powered Personalization Market Estimates and Forecast, 2020-2028 (USD Million)
6.4.3.10.1 By Component
6.4.3.10.2 By Applications
6.4.3.11 Rest of Asia Pacific AI-Powered Personalization Market Estimates and Forecast, 2020-2028 (USD Million)
6.4.3.11.1 By Component
6.4.3.11.2 By Applications
6.5 Middle East and Africa AI-Powered Personalization Market Estimates and Forecast, 2020-2028 (USD Million)
6.5.1 By Component
6.5.2 By Applications
6.5.3 By Country
6.5.3.1 Saudi Arabia AI-Powered Personalization Market Estimates and Forecast, 2020-2028 (USD Million)
6.5.3.1.1 By Component
6.5.3.1.2 By Applications
6.5.3.2 U.A.E. AI-Powered Personalization Market Estimates and Forecast, 2020-2028 (USD Million)
6.5.3.2.1 By Component
6.5.3.2.2 By Applications
6.5.3.3 Israel AI-Powered Personalization Market Estimates and Forecast, 2020-2028 (USD Million)
6.5.3.3.1 By Component
6.5.3.3.2 By Applications
6.5.3.4 South Africa AI-Powered Personalization Market Estimates and Forecast, 2020-2028 (USD Million)
6.5.3.4.1 By Component
6.5.3.4.2 By Applications
6.5.3.5 Rest of Middle East and Africa AI-Powered Personalization Market Estimates and Forecast, 2020-2028 (USD Million)
6.5.3.5.1 By Component
6.5.3.5.2 By Applications
6.6 Central & South America AI-Powered Personalization Market Estimates and Forecast, 2020-2028 (USD Million)
6.6.1 By Component
6.6.2 By Applications
6.6.3 By Country
6.6.3.1 Brazil AI-Powered Personalization Market Estimates and Forecast, 2020-2028 (USD Million)
6.6.3.1.1 By Component
6.6.3.1.2 By Applications
6.6.3.2 Argentina AI-Powered Personalization Market Estimates and Forecast, 2020-2028 (USD Million)
6.6.3.2.1 By Component
6.6.3.2.2 By Applications
6.6.3.3 Chile AI-Powered Personalization Market Estimates and Forecast, 2020-2028 (USD Million)
6.6.3.3.1 By Component
6.6.3.3.2 By Applications
6.6.3.3 Rest of Central & South America AI-Powered Personalization Market Estimates and Forecast, 2020-2028 (USD Million)
6.6.3.3.1 By Component
6.6.3.3.2 By Applications
7 COMPETITIVE LANDCAPE
7.1 Company Market Share Analysis
7.2 Four Quadrant Positioning Matrix
7.2.1 Market Leaders
7.2.2 Market Visionaries
7.2.3 Market Challengers
7.2.4 Niche Market Players
7.3 Vendor Landscape
7.3.1 North America
7.3.2 Europe
7.3.3 Asia Pacific
7.3.4 Rest of the World
7.4 Company Profiles
7.4.1 IBM
7.4.1.1 Business Description & Financial Analysis
7.4.1.2 SWOT Analysis
7.4.1.3 Products & Services Offered
7.4.1.4 Strategic Alliances between Business Partners
7.4.2 Adobe, Inc.
7.4.2.1 Business Description & Financial Analysis
7.4.2.2 SWOT Analysis
7.4.2.3 Products & Services Offered
7.4.2.4 Strategic Alliances between Business Partners
7.4.3 Oracle Corporation
7.4.3.1 Business Description & Financial Analysis
7.4.3.2 SWOT Analysis
7.4.3.3 Products & Services Offered
7.4.3.4 Strategic Alliances between Business Partners
7.4.4 Salesforce
7.4.4.1 Business Description & Financial Analysis
7.4.4.2 SWOT Analysis
7.4.4.3 Products & Services Offered
7.4.4.4 Strategic Alliances between Business Partners
7.4.5 SAP SE
7.4.5.1 Business Description & Financial Analysis
7.4.5.2 SWOT Analysis
7.4.5.3 Products & Services Offered
7.4.5.4 Strategic Alliances between Business Partners
7.4.6 Microsoft Corporation
7.4.6.1 Business Description & Financial Analysis
7.4.6.2 SWOT Analysis
7.4.6.3 Products & Services Offered
7.4.6.4 Strategic Alliances between Business Partners
7.4.7 Dynamic Yield
7.4.7.1 Business Description & Financial Analysis
7.4.7.2 SWOT Analysis
7.4.7.3 Products & Services Offered
7.4.7.4 Strategic Alliances between Business Partners
7.4.8 Qubit
7.4.8.1 Business Description & Financial Analysis
7.4.8.2 SWOT Analysis
7.4.8.3 Products & Services Offered
7.4.8.4 Strategic Alliances between Business Partners
7.4.9 Optimizely
7.4.9.1 Business Description & Financial Analysis
7.4.9.2 SWOT Analysis
7.4.9.3 Products & Services Offered
7.4.9.4 Strategic Alliances between Business Partners
7.4.10 RichRelevance
7.4.10.1 Business Description & Financial Analysis
7.4.10.2 SWOT Analysis
7.4.10.3 Products & Services Offered
7.4.10.4 Strategic Alliances between Business Partners
7.4.11 Evergage
7.4.11.1 Business Description & Financial Analysis
7.4.11.2 SWOT Analysis
7.4.11.3 Products & Services Offered
7.4.11.4 Strategic Alliances between Business Partners
7.4.12 Bloomreach
7.4.12.1 Business Description & Financial Analysis
7.4.12.2 SWOT Analysis
7.4.12.3 Products & Services Offered
7.4.12.4 Strategic Alliances between Business Partners
7.4.13 Other Companies
7.4.13.1 Business Description & Financial Analysis
7.4.13.2 SWOT Analysis
7.4.13.3 Products & Services Offered
7.4.13.4 Strategic Alliances between Business Partners
8 RESEARCH METHODOLOGY
8.1 Market Introduction
8.1.1 Market Definition
8.1.2 Market Scope & Segmentation
8.2 Information Procurement
8.2.1 Secondary Research
8.2.1.1 Purchased Databases
8.2.1.2 GMEs Internal Data Repository
8.2.1.3 Secondary Resources & Third Party Perspectives
8.2.1.4 Company Information Sources
8.2.2 Primary Research
8.2.2.1 Various Types of Respondents for Primary Interviews
8.2.2.2 Number of Interviews Conducted throughout the Research Process
8.2.2.3 Primary Stakeholders
8.2.2.4 Discussion Guide for Primary Participants
8.2.3 Expert Panels
8.2.3.1 Expert Panels Across 30+ Industry
8.2.4 Paid Local Experts
8.2.4.1 Paid Local Experts Across 30+ Industry Across each Region
8.3 Market Estimation
8.3.1 Top-Down Approach
8.3.1.1 Macro-Economic Indicators Considered
8.3.1.2 Micro-Economic Indicators Considered
8.3.2 Bottom Up Approach
8.3.2.1 Company Share Analysis Approach
8.3.2.2 Estimation of Potential Product Sales
8.4 Data Triangulation
8.4.1 Data Collection
8.4.2 Time Series, Cross Sectional & Panel Data Analysis
8.4.3 Cluster Analysis
8.5 Analysis and Output
8.5.1 Inhouse AI Based Real Time Analytics Tool
8.5.2 Output From Desk & Primary Research
8.6 Research Assumptions & Limitations
8.6.1 Research Assumptions
8.6.2 Research Limitations
LIST OF TABLES
1 Global AI-Powered Personalization Market, By Component, 2020-2028 (USD Mllion)
2 Software Market, By Region, 2020-2028 (USD Mllion)
3 Services Market, By Region, 2020-2028 (USD Mllion)
4 Global AI-Powered Personalization Market, By Applications, 2020-2028 (USD Mllion)
5 E-commerce Market, By Region, 2020-2028 (USD Mllion)
6 Marketing Market, By Region, 2020-2028 (USD Mllion)
7 Customer Service Market, By Region, 2020-2028 (USD Mllion)
8 Others Market, By Region, 2020-2028 (USD Mllion)
9 Regional Analysis, 2020-2028 (USD Mllion)
10 North America AI-Powered Personalization Market, By Component, 2020-2028 (USD Mllion)
11 North America AI-Powered Personalization Market, By Applications, 2020-2028 (USD Mllion)
12 North America AI-Powered Personalization Market, By Country, 2020-2028 (USD Mllion)
13 U.S. AI-Powered Personalization Market, By Component, 2020-2028 (USD Mllion)
14 U.S. AI-Powered Personalization Market, By Applications, 2020-2028 (USD Mllion)
15 Canada AI-Powered Personalization Market, By Component, 2020-2028 (USD Mllion)
16 Canada AI-Powered Personalization Market, By Applications, 2020-2028 (USD Mllion)
17 Mexico AI-Powered Personalization Market, By Component, 2020-2028 (USD Mllion)
18 Mexico AI-Powered Personalization Market, By Applications, 2020-2028 (USD Mllion)
19 Europe AI-Powered Personalization Market, By Component, 2020-2028 (USD Mllion)
20 Europe AI-Powered Personalization Market, By Applications, 2020-2028 (USD Mllion)
21 Europe AI-Powered Personalization Market, By Country, 2020-2028 (USD Mllion)
22 Germany AI-Powered Personalization Market, By Component, 2020-2028 (USD Mllion)
23 Germany AI-Powered Personalization Market, By Applications, 2020-2028 (USD Mllion)
24 U.K. AI-Powered Personalization Market, By Component, 2020-2028 (USD Mllion)
25 U.K. AI-Powered Personalization Market, By Applications, 2020-2028 (USD Mllion)
26 France AI-Powered Personalization Market, By Component, 2020-2028 (USD Mllion)
27 France AI-Powered Personalization Market, By Applications, 2020-2028 (USD Mllion)
28 Italy AI-Powered Personalization Market, By Component, 2020-2028 (USD Mllion)
29 Italy AI-Powered Personalization Market, By Applications, 2020-2028 (USD Mllion)
30 Spain AI-Powered Personalization Market, By Component, 2020-2028 (USD Mllion)
31 Spain AI-Powered Personalization Market, By Applications, 2020-2028 (USD Mllion)
32 Netherlands AI-Powered Personalization Market, By Component, 2020-2028 (USD Mllion)
33 Netherlands AI-Powered Personalization Market, By Applications, 2020-2028 (USD Mllion)
34 Rest Of Europe AI-Powered Personalization Market, By Component, 2020-2028 (USD Mllion)
35 Rest Of Europe AI-Powered Personalization Market, By Applications, 2020-2028 (USD Mllion)
36 Asia Pacific AI-Powered Personalization Market, By Component, 2020-2028 (USD Mllion)
37 Asia Pacific AI-Powered Personalization Market, By Applications, 2020-2028 (USD Mllion)
38 Asia Pacific AI-Powered Personalization Market, By Country, 2020-2028 (USD Mllion)
39 China AI-Powered Personalization Market, By Component, 2020-2028 (USD Mllion)
40 China AI-Powered Personalization Market, By Applications, 2020-2028 (USD Mllion)
41 Japan AI-Powered Personalization Market, By Component, 2020-2028 (USD Mllion)
42 Japan AI-Powered Personalization Market, By Applications, 2020-2028 (USD Mllion)
43 India AI-Powered Personalization Market, By Component, 2020-2028 (USD Mllion)
44 India AI-Powered Personalization Market, By Applications, 2020-2028 (USD Mllion)
45 South Korea AI-Powered Personalization Market, By Component, 2020-2028 (USD Mllion)
46 South Korea AI-Powered Personalization Market, By Applications, 2020-2028 (USD Mllion)
47 Singapore AI-Powered Personalization Market, By Component, 2020-2028 (USD Mllion)
48 Singapore AI-Powered Personalization Market, By Applications, 2020-2028 (USD Mllion)
49 Thailand AI-Powered Personalization Market, By Component, 2020-2028 (USD Mllion)
50 Thailand AI-Powered Personalization Market, By Applications, 2020-2028 (USD Mllion)
51 Malaysia AI-Powered Personalization Market, By Component, 2020-2028 (USD Mllion)
52 Malaysia AI-Powered Personalization Market, By Applications, 2020-2028 (USD Mllion)
53 Indonesia AI-Powered Personalization Market, By Component, 2020-2028 (USD Mllion)
54 Indonesia AI-Powered Personalization Market, By Applications, 2020-2028 (USD Mllion)
55 Vietnam AI-Powered Personalization Market, By Component, 2020-2028 (USD Mllion)
56 Vietnam AI-Powered Personalization Market, By Applications, 2020-2028 (USD Mllion)
57 Taiwan AI-Powered Personalization Market, By Component, 2020-2028 (USD Mllion)
58 Taiwan AI-Powered Personalization Market, By Applications, 2020-2028 (USD Mllion)
59 Rest of APAC AI-Powered Personalization Market, By Component, 2020-2028 (USD Mllion)
60 Rest of APAC AI-Powered Personalization Market, By Applications, 2020-2028 (USD Mllion)
61 Middle East and Africa AI-Powered Personalization Market, By Component, 2020-2028 (USD Mllion)
62 Middle East and Africa AI-Powered Personalization Market, By Applications, 2020-2028 (USD Mllion)
63 Middle East and Africa AI-Powered Personalization Market, By Country, 2020-2028 (USD Mllion)
64 Saudi Arabia AI-Powered Personalization Market, By Component, 2020-2028 (USD Mllion)
65 Saudi Arabia AI-Powered Personalization Market, By Applications, 2020-2028 (USD Mllion)
66 UAE AI-Powered Personalization Market, By Component, 2020-2028 (USD Mllion)
67 UAE AI-Powered Personalization Market, By Applications, 2020-2028 (USD Mllion)
68 Israel AI-Powered Personalization Market, By Component, 2020-2028 (USD Mllion)
69 Israel AI-Powered Personalization Market, By Applications, 2020-2028 (USD Mllion)
70 South Africa AI-Powered Personalization Market, By Component, 2020-2028 (USD Mllion)
71 South Africa AI-Powered Personalization Market, By Applications, 2020-2028 (USD Mllion)
72 Rest Of Middle East and Africa AI-Powered Personalization Market, By Component, 2020-2028 (USD Mllion)
73 Rest Of Middle East and Africa AI-Powered Personalization Market, By Applications, 2020-2028 (USD Mllion)
74 Central & South America AI-Powered Personalization Market, By Component, 2020-2028 (USD Mllion)
75 Central & South America AI-Powered Personalization Market, By Applications, 2020-2028 (USD Mllion)
76 Central & South America AI-Powered Personalization Market, By Country, 2020-2028 (USD Mllion)
77 Brazil AI-Powered Personalization Market, By Component, 2020-2028 (USD Mllion)
78 Brazil AI-Powered Personalization Market, By Applications, 2020-2028 (USD Mllion)
79 Chile AI-Powered Personalization Market, By Component, 2020-2028 (USD Mllion)
80 Chile AI-Powered Personalization Market, By Applications, 2020-2028 (USD Mllion)
81 Argentina AI-Powered Personalization Market, By Component, 2020-2028 (USD Mllion)
82 Argentina AI-Powered Personalization Market, By Applications, 2020-2028 (USD Mllion)
83 Rest Of Central & South America AI-Powered Personalization Market, By Component, 2020-2028 (USD Mllion)
84 Rest Of Central & South America AI-Powered Personalization Market, By Applications, 2020-2028 (USD Mllion)
85 IBM: Products & Services Offering
86 Adobe, Inc.: Products & Services Offering
87 Oracle Corporation: Products & Services Offering
88 Salesforce: Products & Services Offering
89 SAP SE: Products & Services Offering
90 MICROSOFT CORPORATION: Products & Services Offering
91 Dynamic Yield : Products & Services Offering
92 Qubit: Products & Services Offering
93 Optimizely: Products & Services Offering
94 RichRelevance: Products & Services Offering
95 Evergage Companies: Products & Services Offering
96 Bloomreach Companies: Products & Services Offering
97 Other Companies: Products & Services Offering
LIST OF FIGURES
1 Global AI-Powered Personalization Market Overview
2 Global AI-Powered Personalization Market Value From 2020-2028 (USD Mllion)
3 Global AI-Powered Personalization Market Share, By Component (2022)
4 Global AI-Powered Personalization Market Share, By Applications (2022)
5 Global AI-Powered Personalization Market, By Region (Asia Pacific Market)
6 Technological Trends In Global AI-Powered Personalization Market
7 Four Quadrant Competitor Positioning Matrix
8 Impact Of Macro & Micro Indicators On The Market
9 Impact Of Key Drivers On The Global AI-Powered Personalization Market
10 Impact Of Challenges On The Global AI-Powered Personalization Market
11 Porter’s Five Forces Analysis
12 Global AI-Powered Personalization Market: By Component Scope Key Takeaways
13 Global AI-Powered Personalization Market, By Component Segment: Revenue Growth Analysis
14 Software Market, By Region, 2020-2028 (USD Mllion)
15 Services Market, By Region, 2020-2028 (USD Mllion)
16 Global AI-Powered Personalization Market: By Applications Scope Key Takeaways
17 Global AI-Powered Personalization Market, By Applications Segment: Revenue Growth Analysis
18 E-commerce Market, By Region, 2020-2028 (USD Mllion)
19 Marketing Market, By Region, 2020-2028 (USD Mllion)
20 Customer Service Market, By Region, 2020-2028 (USD Mllion)
21 Others Market, By Region, 2020-2028 (USD Mllion)
22 Regional Segment: Revenue Growth Analysis
23 Global AI-Powered Personalization Market: Regional Analysis
24 North America AI-Powered Personalization Market Overview
25 North America AI-Powered Personalization Market, By Component
26 North America AI-Powered Personalization Market, By Applications
27 North America AI-Powered Personalization Market, By Country
28 U.S. AI-Powered Personalization Market, By Component
29 U.S. AI-Powered Personalization Market, By Applications
30 Canada AI-Powered Personalization Market, By Component
31 Canada AI-Powered Personalization Market, By Applications
32 Mexico AI-Powered Personalization Market, By Component
33 Mexico AI-Powered Personalization Market, By Applications
34 Four Quadrant Positioning Matrix
35 Company Market Share Analysis
36 IBM: Company Snapshot
37 IBM: SWOT Analysis
38 IBM: Geographic Presence
39 Adobe, Inc.: Company Snapshot
40 Adobe, Inc.: SWOT Analysis
41 Adobe, Inc.: Geographic Presence
42 Oracle Corporation: Company Snapshot
43 Oracle Corporation: SWOT Analysis
44 Oracle Corporation: Geographic Presence
45 Salesforce: Company Snapshot
46 Salesforce: Swot Analysis
47 Salesforce: Geographic Presence
48 SAP SE: Company Snapshot
49 SAP SE: SWOT Analysis
50 SAP SE: Geographic Presence
51 MICROSOFT CORPORATION: Company Snapshot
52 MICROSOFT CORPORATION: SWOT Analysis
53 MICROSOFT CORPORATION: Geographic Presence
54 Dynamic Yield : Company Snapshot
55 Dynamic Yield : SWOT Analysis
56 Dynamic Yield : Geographic Presence
57 Qubit: Company Snapshot
58 Qubit: SWOT Analysis
59 Qubit: Geographic Presence
60 Optimizely.: Company Snapshot
61 Optimizely.: SWOT Analysis
62 Optimizely.: Geographic Presence
63 RichRelevance: Company Snapshot
64 RichRelevance: SWOT Analysis
65 RichRelevance: Geographic Presence
66 Evergage: Company Snapshot
67 Evergage: SWOT Analysis
68 Evergage: Geographic Presence
69 Bloomreach: Company Snapshot
70 Bloomreach: SWOT Analysis
71 Bloomreach: Geographic Presence
72 Other Companies: Company Snapshot
73 Other Companies: SWOT Analysis
74 Other Companies: Geographic Presence
The Global AI-Powered Personalization Market has been studied from the year 2019 till 2028. However, the CAGR provided in the report is from the year 2023 to 2028. The research methodology involved three stages: Desk research, Primary research, and Analysis & Output from the entire research process.

The desk research involved a robust background study which meant referring to paid and unpaid databases to understand the market dynamics; mapping contracts from press releases; identifying the key players in the market, studying their product portfolio, competition level, annual reports/SEC filings & investor presentations; and learning the demand and supply-side analysis for the AI-Powered Personalization Market.

The primary research activity included telephonic conversations with more than 50 tier 1 industry consultants, distributors, and end-use product manufacturers.

Finally, based on the above thorough research process, an in-depth analysis was carried out considering the following aspects: market attractiveness, current & future market trends, market share analysis, SWOT analysis of the company and customer analytics.

Frequently Asked Questions

This FREE sample includes market data points, ranging from trend analyses to market estimates & forecasts. See for yourself.
Or view our licence options:
Tailor made solutions just for you
80% of our clients seek made-to-order reports. How do you want us to tailor yours?
OUR CLIENTS


