This report was recently updated on August 27 2025 with the latest and most recent
market numbers
Global AR & VR In E-Commerce Market Size, Trends & Analysis - Forecasts to 2026 By Offering (Software, Services), By Hardware (Head Mounted Display, Head Up Display, Handheld Device, Mobile Devices), By Application (Apparel, Furniture, Electronics, Footwear), By Region (North America, Asia Pacific, Europe, Latin America, Middle East & Africa); End-User Landscape, Company Market Share Analysis, and Competitor Analysis
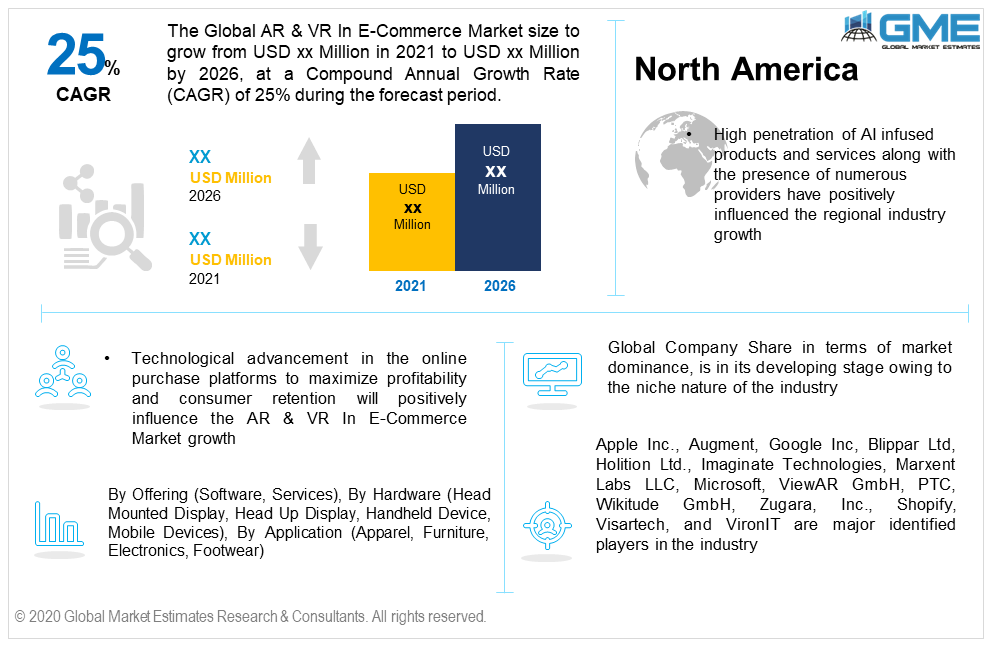
The Global AR & VR In E-Commerce Market will witness over 25% CAGR from 2021 to 2026, with the North American market leading the sales. Technological advancement in the online purchase platforms to maximize profitability and consumer retention will positively influence the AR & VR In E-Commerce Market growth. Most of the e-tailers such as IKEA, eBay, Converse, and Amazon are investing in this sector to enhance user experience while doing an online purchase.
Due to the Covid-19 pandemic, the industry faced a severe shift towards the online purchase and this trend is likely to continue in the coming years. Customer pain points related to product tryout in the case of apparel, goggles, and spectacles can be easily resolved with the help of Augmented Reality and Virtual Reality features. Handiness, adeptness, and satisfaction are the major experiences that encouraged the Augmented Reality & Virtual Reality adoption & implementation in the E-Commerce industry.
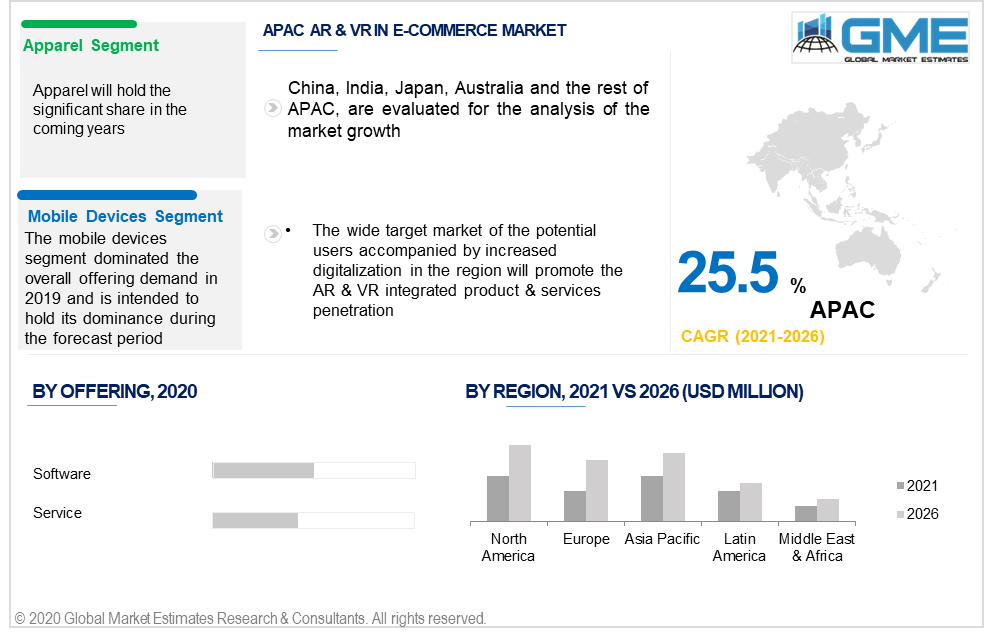
By offering, the market is divided into software and services. The software offering bridges the gap and brings together the digital and physical worlds. The different software and services aids in enhancing the user experience while analyzing the products. The users get a real-life experience during the shopping process which boosts their confidence while making a decision. Usually, consumers are not in favor to purchase expensive goods on the internet due to the high risk associated with quality, appearance, and suitability. However, with the help of Augmented Reality & Virtual Reality software and services offering, the user can also check the suitability of the product in their home. This case is especially beneficial in furniture applications.
Head-mounted Display, Head-Up Display, Handheld Device, and Mobile Devices among others are the hardware that can be used while making an Augmented Reality and Virtual Reality supported online shopping. As of now, the majority of purchase orders are made through mobile devices.
Another hardware that is gaining high attention in online shopping is a head-mounted display. Increase in the number of people investing in head-mounted display for gaming purposes will lead to further significant interest diversification.
By application, the market is divided into apparel, furniture, electronics, and footwear among others. Rising consumer interest to analyze the product more carefully while purchasing it online to avoid unnecessary returns and exchange have led to the introduction of features which helps consumer taking the well-informed decision.
The apparel applications are held responsible for the maximum sales generated through online purchases. Wide product variety and economical pricing are the prime factors to lead sales in this segment.
Another major application that holds high potential in the future is the furniture industry. Through Virtual Reality features, the buyer can get a clear idea before choosing the right product. This feature enables the consumer to witness the same experience as in a physical store.
Due to the covid-19 pandemic, most of the stores have extended their sales platforms to online channels. Thus, with the advent of these technologically advanced products and offerings, the seller can engage more customers.
The North America led the overall regional demand and is expected to hold its dominance in the coming years. The region is projected to account for over 60% of the demand by the end of 2026. High penetration of AI infused products and services along with the presence of numerous providers have positively influenced the regional industry growth.
The Asia Pacific market is anticipated to grow at the highest rate during the forecast period. The wide target market of the potential users accompanied by increased digitalization in the region will promote the AI-powered product & services penetration. The region has witnessed an immense shift to e-commerce purchases in recent years. The majority of the consumers are preferring to purchase online rather than from physical stores. Thus, the adoption of Augmented Reality & Virtual Reality in E-Commerce will be a successful concept in the region. Also, the presence of numerous domestic players in China offering hardware at an economical cost will boost industry penetration.
Global Company Share in terms of market dominance, is in its developing stage owing to the niche nature of the industry. Technology advancement and improvement to gain high compatibility and enhance user experience are the prime focus of the industry leaders. Also, product knowledge programs and simulation events to create awareness & acquaintances among the consumers will be the key potential strategy adopted by the companies.
Apple Inc., Augment, Google Inc, Blippar Ltd, Holition Ltd., Imaginate Technologies, Marxent Labs LLC, Microsoft, ViewAR GmbH, PTC, Wikitude GmbH, Zugara, Inc., Shopify, Visartech, and VironIT are major identified players in the industry.
Please note: This is not an exhaustive list of companies profiled in the report.
As of now, the industry penetration is limited due to a limited number of users who have the access to components to avail the concept. However, rapid digital transformation and development in the e-commerce trade will result in the large number of users engaging in this kind of purchasing.
Chapter 1 Methodology
1.1 Market scope & definitions
1.2 Estimates & forecast calculation
1.3 Historical data overview and validation
1.4 Data sources
1.4.1 Secondary
1.4.2 Primary
Chapter 2 Report Outlook
2.1 AR & VR In E-Commerce industry overview, 2019-2026
2.1.1 Industry overview
2.1.2 Product overview
2.1.3 Function overview
2.1.4 Offering overview
2.1.5 Regional overview
Chapter 3 AR & VR In E-Commerce Market Trends
3.1 Market segmentation
3.2 Industry background, 2019-2026
3.3 Market key trends
3.3.1 Positive trends
3.3.2 Industry challenges
3.4 Prospective growth scenario
3.5 COVID-19 influence over industry growth
3.6 Porter’s analysis
3.7 PESTEL analysis
3.8 Value chain & supply chain analysis
3.9 Regulatory framework
3.9.1 North America
3.9.2 Europe
3.9.3 APAC
3.9.4 LATAM
3.9.5 MEA
3.10 Technology overview
3.11 Market share analysis, 2020
3.11.1 Company positioning overview, 2020
Chapter 4 AR & VR In E-Commerce Market, By Offering
4.1 Offering Outlook
4.2 Software
4.2.1 Market size, by region, 2019-2026 (USD Million)
4.3 Services
4.3.1 Market size, by region, 2019-2026 (USD Million)
Chapter 5 AR & VR In E-Commerce Market, By Hardware
5.1 Hardware Outlook
5.2 Head Mounted Display
5.2.1 Market size, by region, 2019-2026 (USD Million)
5.3 Head Up Display
5.3.1 Market size, by region, 2019-2026 (USD Million)
5.4 Handheld Device
5.4.1 Market size, by region, 2019-2026 (USD Million)
5.5 Mobile Devices
5.5.1 Market size, by region, 2019-2026 (USD Million)
5.6 Others
5.6.1 Market size, by region, 2019-2026 (USD Million)
Chapter 6 AR & VR In E-Commerce Market, By Application
6.1 Application Outlook
6.2 Apparel
6.2.1 Market size, by region, 2019-2026 (USD Million)
6.3 Furniture
6.3.1 Market size, by region, 2019-2026 (USD Million)
6.4 Electronics
6.4.1 Market size, by region, 2019-2026 (USD Million)
6.5 Footwear
6.5.1 Market size, by region, 2019-2026 (USD Million)
6.6 Others
6.6.1 Market size, by region, 2019-2026 (USD Million)
Chapter 7 AR & VR In E-Commerce Market, By Region
7.1 Regional outlook
7.2 North America
7.2.1 Market size, by country 2019-2026 (USD Million)
7.2.2 Market size, By Offering, 2019-2026 (USD Million)
7.2.3 Market size, By Application, 2019-2026 (USD Million)
7.2.4 Market size, By Hardware, 2019-2026 (USD Million)
7.2.5 U.S.
7.2.5.1 Market size, By Offering, 2019-2026 (USD Million)
7.2.5.2 Market size, By Application, 2019-2026 (USD Million)
7.2.5.3 Market size, By Hardware, 2019-2026 (USD Million)
7.2.6 Canada
7.2.6.1 Market size, By Offering, 2019-2026 (USD Million)
7.2.6.2 Market size, By Application, 2019-2026 (USD Million)
7.2.6.3 Market size, By Hardware, 2019-2026 (USD Million)
7.2.7 Mexico
7.2.7.1 Market size, By Offering, 2019-2026 (USD Million)
7.2.7.2 Market size, By Application, 2019-2026 (USD Million)
7.2.7.3 Market size, By Hardware, 2019-2026 (USD Million)
7.3 Europe
7.3.1 Market size, by country 2019-2026 (USD Million)
7.3.2 Market size, By Offering, 2019-2026 (USD Million)
7.3.3 Market size, By Application, 2019-2026 (USD Million)
7.3.4 Market size, By Hardware, 2019-2026 (USD Million)
7.3.5 Germany
7.2.5.1 Market size, By Offering, 2019-2026 (USD Million)
7.2.5.2 Market size, By Application, 2019-2026 (USD Million)
7.2.5.3 Market size, By Hardware, 2019-2026 (USD Million)
7.3.6 Spain
7.3.6.1 Market size, By Offering, 2019-2026 (USD Million)
7.3.6.2 Market size, By Application, 2019-2026 (USD Million)
7.3.6.3 Market size, By Hardware, 2019-2026 (USD Million)
7.3.7 France
7.3.7.1 Market size, By Offering, 2019-2026 (USD Million)
7.3.7.2 Market size, By Application, 2019-2026 (USD Million)
7.3.7.3 Market size, By Hardware, 2019-2026 (USD Million)
7.3.8 Italy
7.3.8.1 Market size, By Offering, 2019-2026 (USD Million)
7.3.8.2 Market size, By Application, 2019-2026 (USD Million)
7.3.8.3 Market size, By Hardware, 2019-2026 (USD Million)
7.4 Asia Pacific
7.4.1 Market size, by country 2019-2026 (USD Million)
7.4.2 Market size, By Offering, 2019-2026 (USD Million)
7.4.3 Market size, By Application, 2019-2026 (USD Million)
7.4.4 Market size, By Hardware, 2019-2026 (USD Million)
7.4.5 China
7.4.5.1 Market size, By Offering, 2019-2026 (USD Million)
7.4.5.2 Market size, By Application, 2019-2026 (USD Million)
7.4.5.3 Market size, By Hardware, 2019-2026 (USD Million)
7.4.6 India
7.4.6.1 Market size, By Offering, 2019-2026 (USD Million)
7.4.6.2 Market size, By Application, 2019-2026 (USD Million)
7.4.6.3 Market size, By Hardware, 2019-2026 (USD Million)
7.4.7 Malaysia
7.4.7.1 Market size, By Offering, 2019-2026 (USD Million)
7.4.7.2 Market size, By Application, 2019-2026 (USD Million)
7.4.7.3 Market size, By Hardware, 2019-2026 (USD Million)
7.4.8 Australia
7.4.8.1 Market size, By Offering, 2019-2026 (USD Million)
7.4.8.2 Market size, By Application, 2019-2026 (USD Million)
7.4.8.3 Market size, By Hardware, 2019-2026 (USD Million)
7.4.9 South Korea
7.4.9.1 Market size, By Offering, 2019-2026 (USD Million)
7.4.9.2 Market size, By Application, 2019-2026 (USD Million)
7.4.9.3 Market size, By Hardware, 2019-2026 (USD Million)
7.5 Central & South America
7.5.1 Market size, by country 2019-2026 (USD Million)
7.5.2 Market size, By Offering, 2019-2026 (USD Million)
7.5.3 Market size, By Application, 2019-2026 (USD Million)
7.5.4 Market size, By Hardware, 2019-2026 (USD Million)
7.5.5 Brazil
7.5.5.1 Market size, By Offering, 2019-2026 (USD Million)
7.5.5.2 Market size, By Application, 2019-2026 (USD Million)
7.5.5.3 Market size, By Hardware, 2019-2026 (USD Million)
7.5.6 Argentina
7.5.6.1 Market size, By Offering, 2019-2026 (USD Million)
7.5.6.2 Market size, By Application, 2019-2026 (USD Million)
7.5.6.3 Market size, By Hardware, 2019-2026 (USD Million)
7.6 MEA
7.6.1 Market size, by country 2019-2026 (USD Million)
7.6.2 Market size, By Offering, 2019-2026 (USD Million)
7.6.3 Market size, By Application, 2019-2026 (USD Million)
7.6.4 Market size, By Hardware, 2019-2026 (USD Million)
7.6.5 Saudi Arabia
7.6.5.1 Market size, By Offering, 2019-2026 (USD Million)
7.6.5.2 Market size, By Application, 2019-2026 (USD Million)
7.6.5.3 Market size, By Hardware, 2019-2026 (USD Million)
7.6.6 UAE
7.6.6.1 Market size, By Offering, 2019-2026 (USD Million)
7.6.6.2 Market size, By Application, 2019-2026 (USD Million)
7.6.6.3 Market size, By Hardware, 2019-2026 (USD Million)
7.6.7 South Africa
7.6.7.1 Market size, By Offering, 2019-2026 (USD Million)
7.6.7.2 Market size, By Application, 2019-2026 (USD Million)
7.6.7.3 Market size, By Hardware, 2019-2026 (USD Million)
Chapter 8 Company Landscape
8.1 Competitive analysis, 2020
8.2 Apple Inc.
8.2.1 Company overview
8.2.2 Financial analysis
8.2.3 Strategic positioning
8.2.4 Info graphic analysis
8.3 Augment
8.3.1 Company overview
8.3.2 Financial analysis
8.3.3 Strategic positioning
8.3.4 Info graphic analysis
8.4 Google Inc
8.4.1 Company overview
8.4.2 Financial analysis
8.4.3 Strategic positioning
8.4.4 Info graphic analysis
8.5 Blippar Ltd
8.5.1 Company overview
8.5.2 Financial analysis
8.5.3 Strategic positioning
8.5.4 Info graphic analysis
8.6 Holition Ltd.
8.6.1 Company overview
8.6.2 Financial analysis
8.6.3 Strategic positioning
8.6.4 Info graphic analysis
8.7 Imaginate Technologies
8.7.1 Company overview
8.7.2 Financial analysis
8.7.3 Strategic positioning
8.7.4 Info graphic analysis
8.8 Marxent Labs LLC
8.8.1 Company overview
8.8.2 Financial analysis
8.8.3 Strategic positioning
8.8.4 Info graphic analysis
8.9 Microsoft
8.9.1 Company overview
8.9.2 Financial analysis
8.9.3 Strategic positioning
8.9.4 Info graphic analysis
8.10 ViewAR GmbH
8.10.1 Company overview
8.10.2 Financial analysis
8.10.3 Strategic positioning
8.10.4 Info graphic analysis
8.11 PTC
8.11.1 Company overview
8.11.2 Financial analysis
8.11.3 Strategic positioning
8.11.4 Info graphic analysis
8.12 Wikitude GmbH
8.12.1 Company overview
8.12.2 Financial analysis
8.12.3 Strategic positioning
8.12.4 Info graphic analysis
8.13 Zugara, Inc.
8.13.1 Company overview
8.13.2 Financial analysis
8.13.3 Strategic positioning
8.13.4 Info graphic analysis
8.14 Shopify
8.14.1 Company overview
8.14.2 Financial analysis
8.14.3 Strategic positioning
8.14.4 Info graphic analysis
8.15 Visartech
8.15.1 Company overview
8.15.2 Financial analysis
8.15.3 Strategic positioning
8.15.4 Info graphic analysis
8.16 VironIT
8.16.1 Company overview
8.16.2 Financial analysis
8.16.3 Strategic positioning
8.16.4 Info graphic analysis
The Global AR & VR In E-Commerce Market has been studied from the year 2019 till 2026. However, the CAGR provided in the report is from the year 2021 to 2026. The research methodology involved three stages: Desk research, Primary research, and Analysis & Output from the entire research process.

The desk research involved a robust background study which meant referring to paid and unpaid databases to understand the market dynamics; mapping contracts from press releases; identifying the key players in the market, studying their product portfolio, competition level, annual reports/SEC filings & investor presentations; and learning the demand and supply-side analysis for the AR & VR In E-Commerce Market.

The primary research activity included telephonic conversations with more than 50 tier 1 industry consultants, distributors, and end-use product manufacturers.

Finally, based on the above thorough research process, an in-depth analysis was carried out considering the following aspects: market attractiveness, current & future market trends, market share analysis, SWOT analysis of the company and customer analytics.

Frequently Asked Questions

This FREE sample includes market data points, ranging from trend analyses to market estimates & forecasts. See for yourself.
Or view our licence options:
Tailor made solutions just for you
80% of our clients seek made-to-order reports. How do you want us to tailor yours?
OUR CLIENTS


