This report was recently updated on August 16 2025 with the latest and most recent
market numbers
Global Augmented and Virtual Reality in Education Market Size, Trends & Analysis - Forecasts to 2027 By Solutions (Content Management, Device Management, Unified Communications and Collaboration (UCC), Security, Analytics and Data Visualization), By Hardware (Interactive Whiteboards, Mobile Computing Devices, Virtual Reality Devices, Displays and Projectors, Security and Video Cameras and Others), By Services (Professional Services and Managed Services), By Deployment Modes (Cloud and On-premises), By User Types (K-12, Higher Education, Telecommunications and IT, Healthcare and Life Sciences, Retail and E-commerce, Banking, Financial Services, and Insurance, Manufacturing, Government and Public Sector), By Region (North America, Asia Pacific, CSA, Europe, and the Middle East and Africa), Company Market Share Analysis, and Competitor Analysis
The Global Augmented and Virtual Reality in Education Market is projected to grow at a CAGR value of 18.5% from 2022 to 2027.
As technological developments advance, augmented and virtual reality is increasingly being used in an educational setting. Augmented reality technology is used through software in various educational training programs to help students acquire knowledge and skills through experience of different forms of reality simulation games, among other things. Virtual reality helps in the creation of a simulated environment that imitates real-life objects, people and events. Through such an illusion, students are exposed to the environment of different industries, events, etc. Such technologies are primarily used in primary and secondary education, higher education, language learning programs, test preparation, among other things.
The market will be driven during the forecast period by a rise in digitalisation and advancement of technology, rise in innovation and adoption of AR/VR technologies in the educational sector, increased demand for personalised and experiential learning methods.
Furthermore, the rise in demand for such technology to improve the accessibility to education for students with learning disabilities, make learning less location-dependent, and rise in partnerships between corporate industries and educational institutions to deliver such AR/VR based learning and training programmes, are other market drivers.
The lack of skilled personnel to properly make use of such technology could prove to be a restraint to market growth.
The COVID-19 pandemic has through its imposed lockdowns and travel restrictions resulted in an increased demand for such AR and VR technology in the education sector that helps facilitate contact less and improved access to education. On the other hand, however, the various pandemic induced restrictions have disrupted the supply chain of such technology.
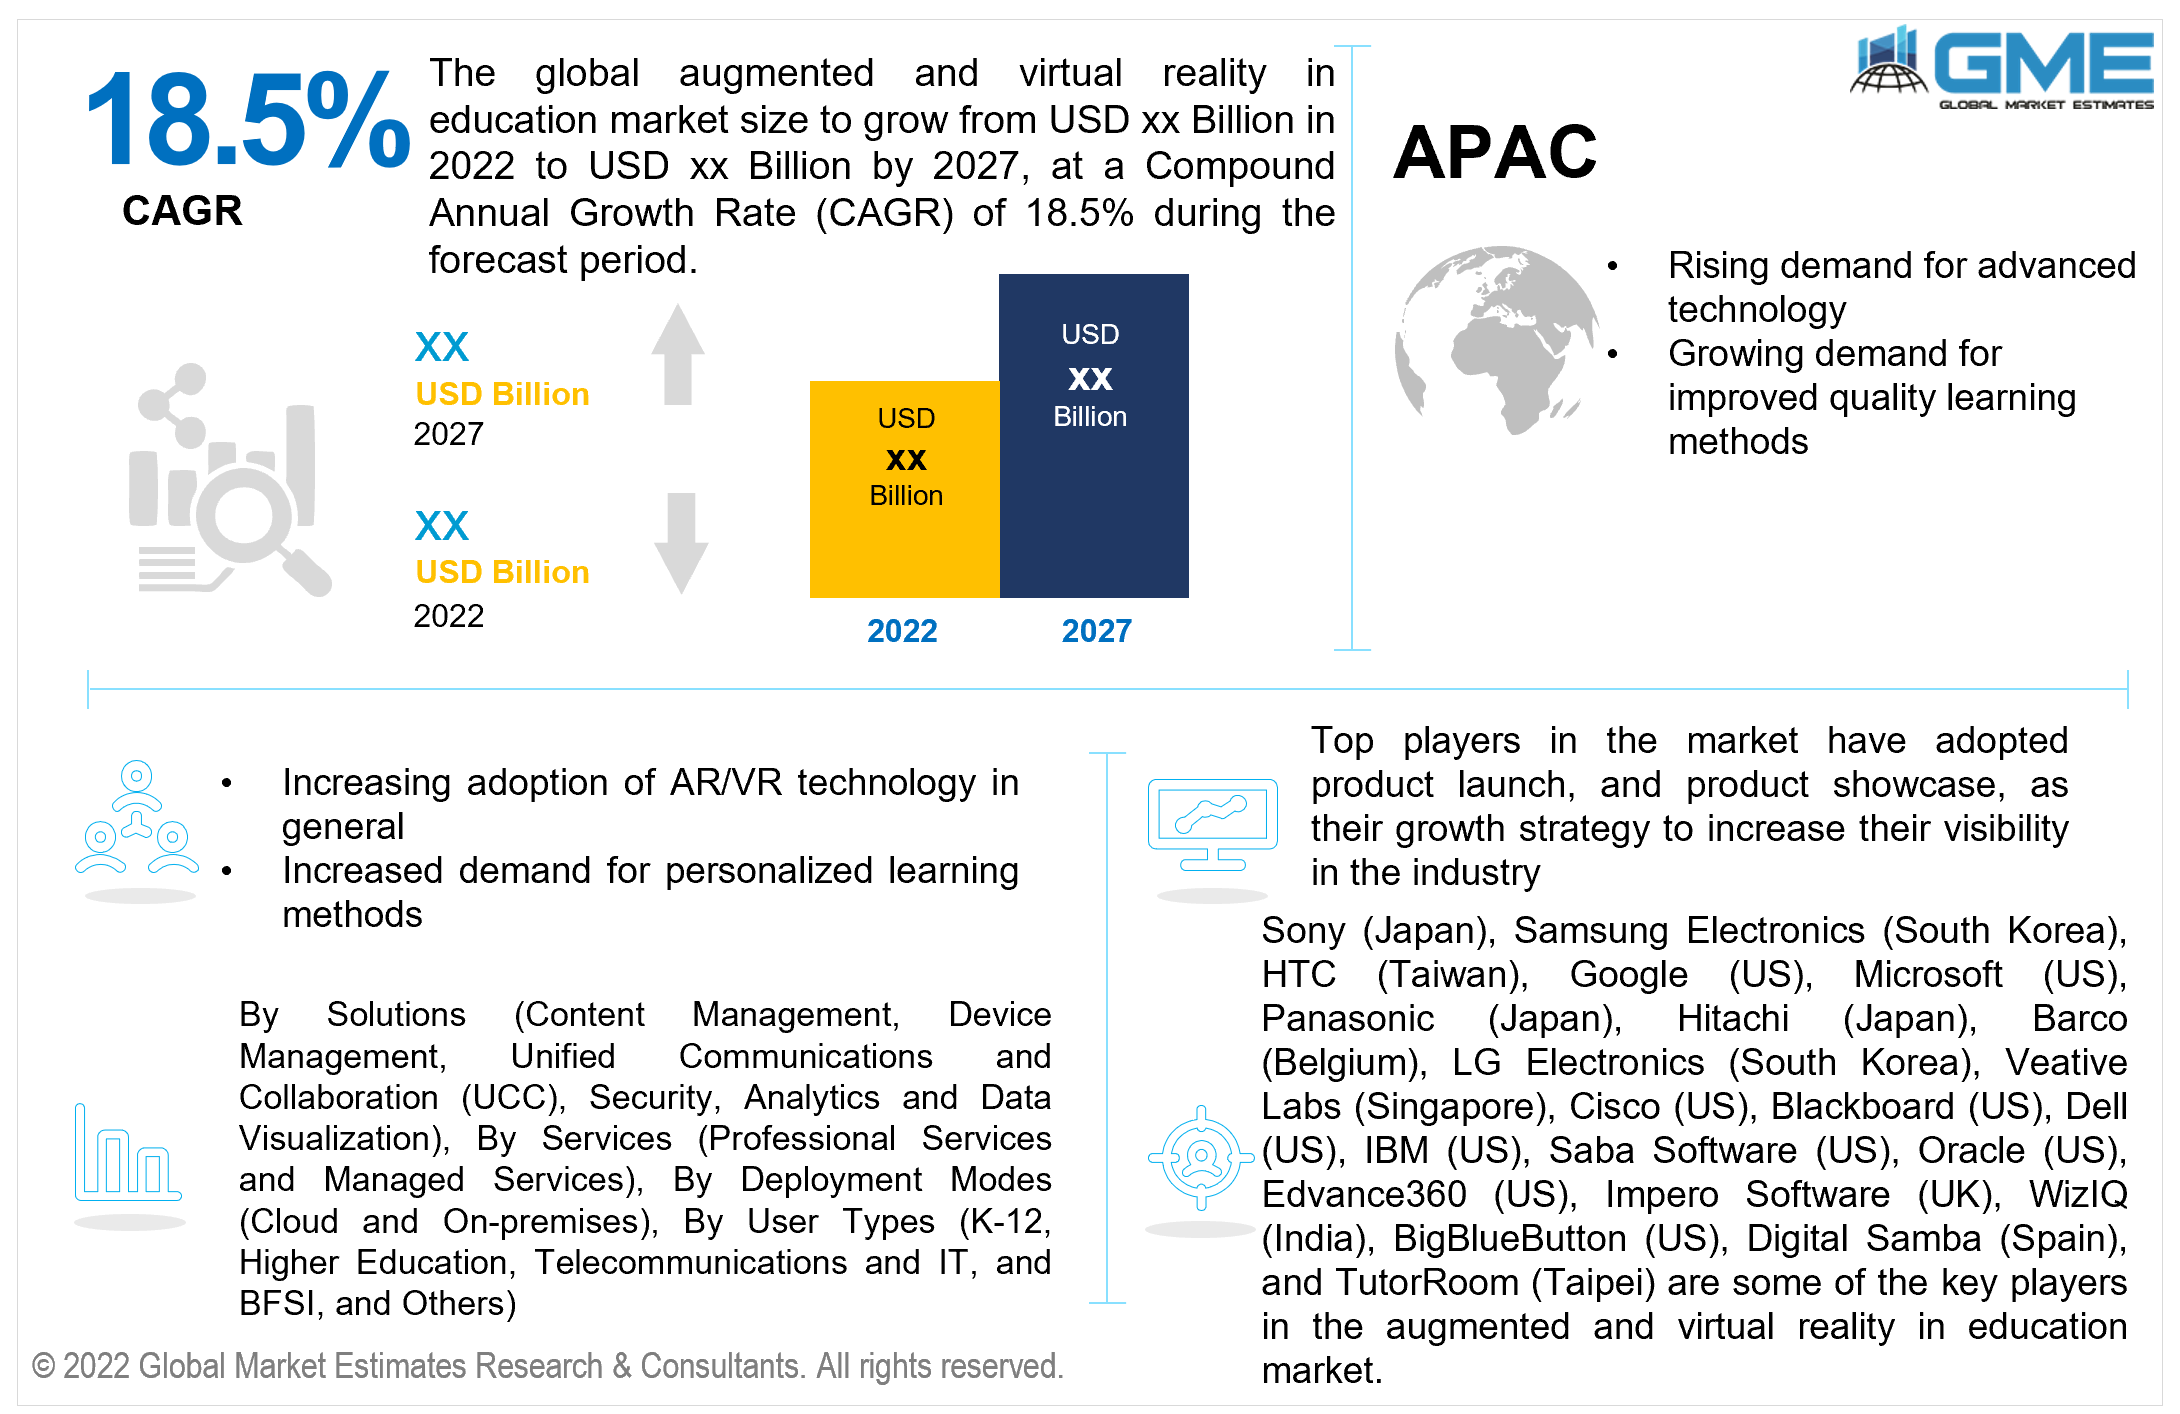
Based on the solution type, the augmented and virtual reality in education market is divided into content management, device management, Unified Communications and Collaboration (UCC), security, analytics and data visualization. The analytics and data visualization segment is expected to grow the fastest in the forecast period of 2022-2027.
AR/VR technologies are increasingly being used to make optimal utilisation of data to improve functioning of such educational institutions to deliver improved learning and skill training programmes. Such technology helps present only relevant information in a precise manner and also helps visualise such data systematically, thus, improving teaching as well as learning methods in an educational set-up.
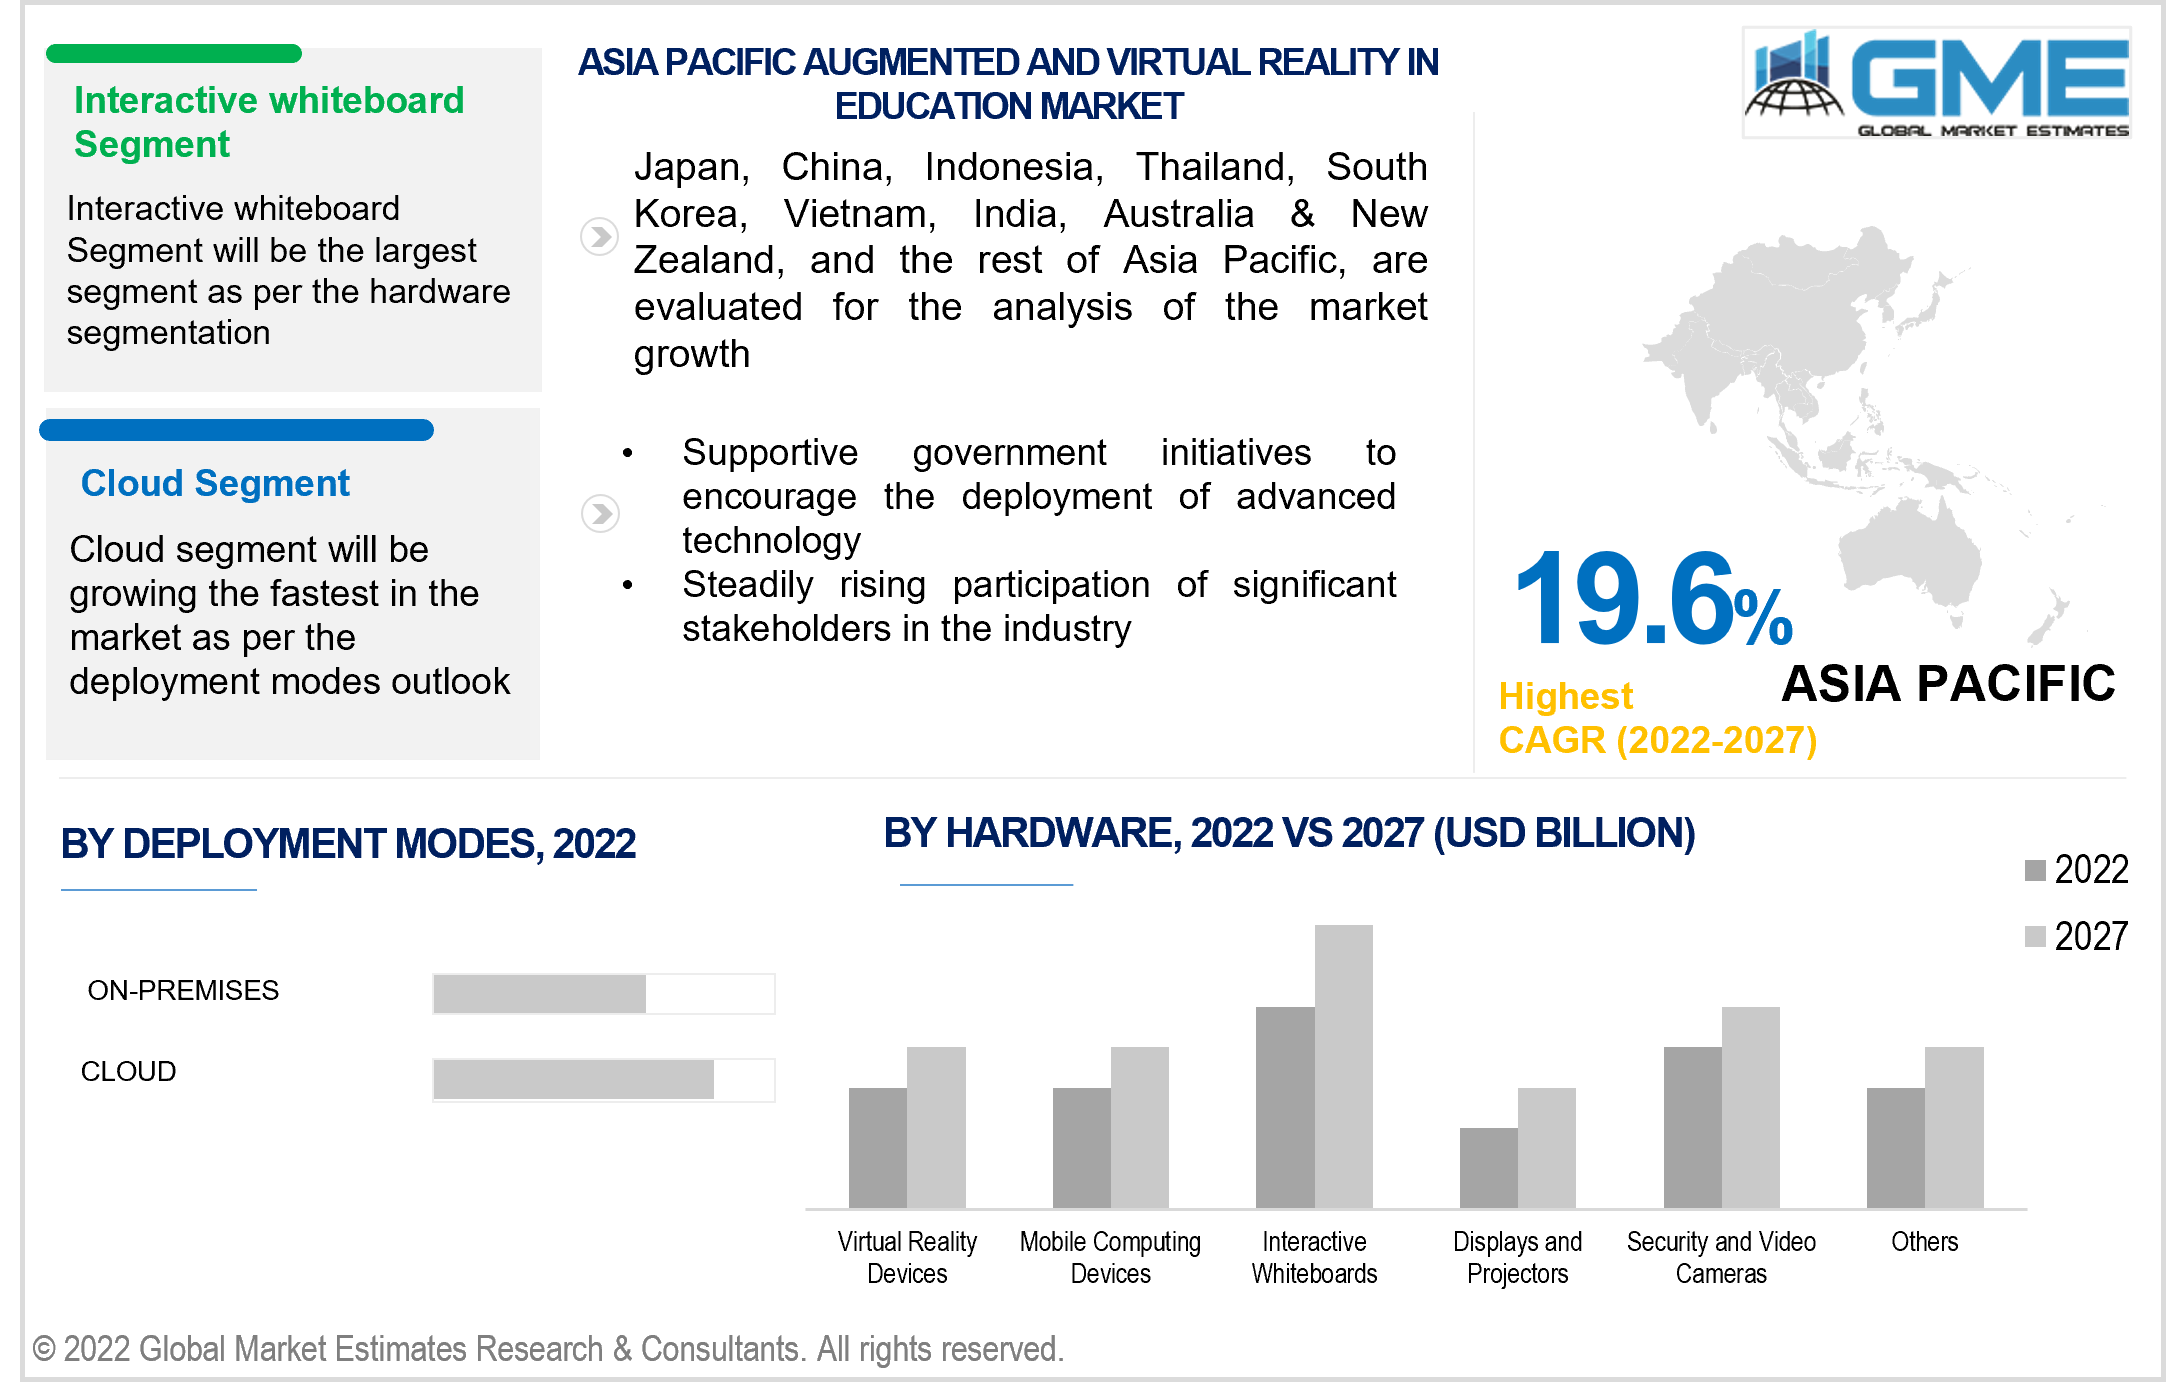
Based on the hardware type, the augmented and virtual reality in education market is divided into interactive whiteboards, mobile computing devices, virtual reality devices, displays and projectors, security and video cameras and others. The interactive whiteboard segment is expected to be the largest segment in the in the forecast period of 2022-2027.
Interactive whiteboards are specially designed based on such technology with features that improve learning and teaching methods. These boards are usually able to take dictation, identify speech, recognise symbols and formulae, screen recording and remote accessibility, among other things, thus facilitating the functioning of an educational institution.
Based on the services type, the augmented and virtual reality in education market is divided into Professional Services and Managed Services. The managed services segment is expected to be the largest segment in the in the forecast period of 2022-2027.
As adoption of AR/VR increases, the demand for required skilled personnel to maintain and manage such technology has also increased. Such division of work improves efficiency in utilising such technology in an educational set-up.
Based on the deployment mode type, the augmented and virtual reality in education market is divided into cloud and on-premises. The cloud segment is expected to grow the fastest in the forecast period of 2022-2027.
This segment is gaining popularity with time as it helps improve education accessibility to a wider audience. Cloud based learning allows remote learning and training programmes that can be accessed anywhere, anytime with better convenience.
Based on the user type segmentation, the augmented and virtual reality in education market is divided into K-12, higher education, telecommunications and IT, healthcare and life sciences, retail and e-commerce, banking, financial services, and insurance, manufacturing, government and public sector. The higher education segment is expected to grow the fastest and generate high revenue in the forecast period of 2022-2027.
There is a growing demand for AR/VR technology in higher education providing institutions as IT expenditure on such innovative technologies increases. These technologies provide time and space convenience and provide better quality, experimental learning while increasing student involvement greatly.
As per the geographical analysis, the Augmented and Virtual Reality in Education Market can be classified into North America (the United States, Canada, and Mexico), Asia Pacific (India, China, Japan, Malaysia, Singapore, and the Rest of Asia Pacific), Europe (Germany, United Kingdom, Italy, France, Spain, Netherlands, and Rest of Europe), Middle East & Africa (Saudi Arabia, United Arab Emirates, and Rest of the Middle East & Africa) and Central & South America (Brazil, Argentina, and Rest of Central and South America).
North America (the United States, Canada, and Mexico) will have a dominant share in the augmented and virtual reality in education market from 2022 to 2027. The major factor driving the growth of the market in the North American region is the presence of globally renowned higher education institutions that possess the demand and resources to adopt such advanced technology to improve quality of learning. Presence of multiple developers of such software, AR/VR based games, among other things also boosts market growth.
Moreover, the Asia Pacific (India, China, Japan, Malaysia, Singapore, and the Rest of Asia Pacific) region is expected to be the fastest-growing segment in the augmented and virtual reality in education market during the forecast period. Rapid advancement in technology and rise in internet penetration in several emerging economies in this region will drive demand for augmented reality and virtual reality technology in the education sector. The general cultural importance given to academia in general in countries like China, India, South Korea, and others will increase demand for quality improvising learning methods.
Sony (Japan), Samsung Electronics (South Korea), HTC (Taiwan), Google (US), Microsoft (US), Panasonic (Japan), Hitachi (Japan), Barco (Belgium), LG Electronics (South Korea), Veative Labs (Singapore), Cisco (US), Blackboard (US), Dell (US), IBM (US), Saba Software (US), Oracle (US), Edvance360 (US), Electa Communications (US), BrainCert (US), SKYPREP (Canada), Impero Software (UK), WizIQ (India), BigBlueButton (US), Digital Samba (Spain), and TutorRoom (Taipei) are the key players in the augmented and virtual reality in education market.
Please note: This is not an exhaustive list of companies profiled in the report.
Chapter 1 Methodology
1.1 Market Scope & Definitions
1.2 Estimates & Forecast Calculation
1.3 Historical Data Overview and Validation
1.4 Data Sources
1.4.1 Secondary
1.4.2 Primary
Chapter 2 Report Outlook
2.1 Augmented and Virtual Reality in Education Market Overview, 2022-2027
2.1.1 Industry Overview
2.1.2 Solutions Overview
2.1.3 Hardware Overview
2.1.4 Services Overview
2.1.5 Deployment Modes Overview
2.1.6 User Types Overview
2.1.7 Regional Overview
Chapter 3 Augmented and Virtual Reality in Education Market Trends
3.1 Market Segmentation
3.2 Industry Background, 2022-2027
3.3 Market Key Trends
3.3.1 Positive Trends
3.3.1.1 Rising demand for personalised and experiential learning and teaching methods
3.3.2 Industry Challenges
3.3.2.1 Lack of skill to operate such advanced technology
3.4 Prospective Growth Scenario
3.4.1 Solutions Growth Scenario
3.4.2 Hardware Growth Scenario
3.4.3 Services Growth Scenario
3.4.4 Deployment Modes Growth Scenario
3.4.5 User Types Growth Scenario
3.5 COVID-19 Influence over Industry Growth
3.6 Porter’s Analysis
3.7 PESTEL Analysis
3.8 Value Chain & Supply Chain Analysis
3.9 Regulatory Framework
3.9.1 North America
3.9.2 Europe
3.9.3 APAC
3.9.4 Central and South America
3.9.5 MEA
3.10 Application Overview
3.11 Market Share Analysis, 2022
3.11.1 Company Positioning Overview, 2022
Chapter 4 Augmented and Virtual Reality in Education Market, By Solutions
4.1 Solutions Outlook
4.2 Content Management
4.2.1 Market Size, By Region, 2022-2027 (USD Million)
4.3 Device Management
4.3.1 Market Size, By Region, 2022-2027 (USD Million)
4.4 Unified Communications and Collaboration (UCC)
4.4.1 Market Size, By Region, 2022-2027 (USD Million)
4.5 Security
4.5.1 Market Size, By Region, 2022-2027 (USD Million)
4.6 Analytics and Data Visualization
4.6.1 Market Size, By Region, 2022-2027 (USD Million)
Chapter 5 Augmented and Virtual Reality in Education Market, By Hardware
5.1 Hardware Outlook
5.2 Interactive Whiteboards
5.2.1 Market Size, By Region, 2022-2027 (USD Million)
5.3 Mobile Computing Devices
5.3.1 Market Size, By Region, 2022-2027 (USD Million)
5.4 Virtual Reality Devices
5.4.1 Market Size, By Region, 2022-2027 (USD Million)
5.5 Displays and Projectors
5.5.1 Market Size, By Region, 2022-2027 (USD Million)
5.6 Security and Video Cameras
5.6.1 Market Size, By Region, 2022-2027 (USD Million)
5.7 Others
5.7.1 Market Size, By Region, 2022-2027 (USD Million)
Chapter 6 Augmented and Virtual Reality in Education Market, By Services
6.1 Professional Services
6.1.1 Market Size, By Region, 2022-2027 (USD Million)
6.2 Managed Services
6.2.1 Market Size, By Region, 2022-2027 (USD Million)
Chapter 7 Augmented and Virtual Reality in Education Market, By Deployment Modes
7.1 Cloud
7.1.1 Market Size, By Region, 2022-2027 (USD Million)
7.2 On-premises
7.2.1 Market Size, By Region, 2022-2027 (USD Million)
Chapter 8 Augmented and Virtual Reality in Education Market, By User Types
8.1 K-12
8.1.1 Market Size, By Region, 2022-2027 (USD Million)
8.2 Higher Education
8.2.1 Market Size, By Region, 2022-2027 (USD Million)
8.3 Telecommunications and IT
8.3.1 Market Size, By Region, 2022-2027 (USD Million)
8.4 Healthcare and Life Sciences
8.4.1 Market Size, By Region, 2022-2027 (USD Million)
8.5 Retail and E-commerce
8.5.1 Market Size, By Region, 2022-2027 (USD Million)
8.6 Banking, Financial Services, and Insurance
8.6.1 Market Size, By Region, 2022-2027 (USD Million)
8.7 Manufacturing
8.7.1 Market Size, By Region, 2022-2027 (USD Million)
8.8 Government and Public Sector
8.8.1 Market Size, By Region, 2022-2027 (USD Million)
Chapter 9 Augmented and Virtual Reality in Education Market, By Region
9.1 Regional outlook
9.2 North America
9.2.1 Market Size, By Country 2022-2027 (USD Million)
9.2.2 Market Size, By Solutions, 2022-2027 (USD Million)
9.2.3 Market Size, By Hardware, 2022-2027 (USD Million)
9.2.4 Market Size, By Services, 2022-2027 (USD Million)
9.2.5 Market Size, By Deployment Modes, 2022-2027 (USD Million)
9.2.6 Market Size, By User Types, 2022-2027 (USD Million)
9.2.7 U.S.
9.2.7.1 Market Size, By Solutions, 2022-2027 (USD Million)
9.2.7.2 Market Size, By Hardware, 2022-2027 (USD Million)
9.2.7.3 Market Size, By Services, 2022-2027 (USD Million)
9.2.7.4 Market Size, By Deployment Modes, 2022-2027 (USD Million)
9.2.7.5 Market Size, By User Types, 2022-2027 (USD Million)
9.2.8 Canada
9.2.8.1 Market Size, By Solutions, 2022-2027 (USD Million)
9.2.8.2 Market Size, By Hardware, 2022-2027 (USD Million)
9.2.8.3 Market Size, By Services, 2022-2027 (USD Million)
9.2.8.4 Market Size, By Deployment Modes, 2022-2027 (USD Million)
9.2.8.5 Market Size, By User Types, 2022-2027 (USD Million)
9.2.9 Mexico
9.2.9.1 Market Size, By Solutions, 2022-2027 (USD Million)
9.2.9.2 Market Size, By Hardware, 2022-2027 (USD Million)
9.2.9.3 Market Size, By Services, 2022-2027 (USD Million)
9.2.9.4 Market Size, By Deployment Modes, 2022-2027 (USD Million)
9.2.9.5 Market Size, By User Types, 2022-2027 (USD Million)
9.3 Europe
9.3.1 Market Size, By Country 2022-2027 (USD Million)
9.3.2 Market Size, By Solutions, 2022-2027 (USD Million)
9.3.3 Market Size, By Hardware, 2022-2027 (USD Million)
9.3.4 Market Size, By Services, 2022-2027 (USD Million)
9.3.5 Market Size, By Deployment Modes, 2022-2027 (USD Million)
9.3.6 Market Size, By User Types, 2022-2027 (USD Million)
9.3.7 Germany
9.3.7.1 Market Size, By Solutions, 2022-2027 (USD Million)
9.3.7.2 Market Size, By Hardware, 2022-2027 (USD Million)
9.3.7.3 Market Size, By Services, 2022-2027 (USD Million)
9.3.7.4 Market Size, By Deployment Modes, 2022-2027 (USD Million)
9.3.7.5 Market Size, By User Types, 2022-2027 (USD Million)
9.3.8 UK
9.3.8.1 Market Size, By Solutions, 2022-2027 (USD Million)
9.3.8.2 Market Size, By Hardware, 2022-2027 (USD Million)
9.3.8.3 Market Size, By Services, 2022-2027 (USD Million)
9.3.8.4 Market Size, By Deployment Modes, 2022-2027 (USD Million)
9.3.8.5 Market Size, By User Types, 2022-2027 (USD Million)
9.3.9 France
9.3.9.1 Market Size, By Solutions, 2022-2027 (USD Million)
9.3.9.2 Market Size, By Hardware, 2022-2027 (USD Million)
9.3.9.3 Market Size, By Services, 2022-2027 (USD Million)
9.3.9.4 Market Size, By Deployment Modes, 2022-2027 (USD Million)
9.3.9.5 Market Size, By User Types, 2022-2027 (USD Million)
9.3.10 Italy
9.3.10.1 Market Size, By Solutions, 2022-2027 (USD Million)
9.3.10.2 Market Size, By Hardware, 2022-2027 (USD Million)
9.3.10.3 Market Size, By Services, 2022-2027 (USD Million)
9.3.10.4 Market Size, By Deployment Modes, 2022-2027 (USD Million)
9.3.10.5 Market Size, By User Types, 2022-2027 (USD Million)
9.4 Asia Pacific
9.4.1 Market Size, By Country 2022-2027 (USD Million)
9.4.2 Market Size, By Solutions, 2022-2027 (USD Million)
9.4.3 Market Size, By Hardware, 2022-2027 (USD Million)
9.4.4 Market Size, By Services, 2022-2027 (USD Million)
9.4.5 Market Size, By Deployment Modes, 2022-2027 (USD Million)
9.4.6 Market Size, By User Types, 2022-2027 (USD Million)
9.4.7 China
9.4.7.1 Market Size, By Solutions, 2022-2027 (USD Million)
9.4.7.2 Market Size, By Hardware, 2022-2027 (USD Million)
9.4.7.3 Market Size, By Services, 2022-2027 (USD Million)
9.4.7.4 Market Size, By Deployment Modes, 2022-2027 (USD Million)
9.4.7.5 Market Size, By User Types, 2022-2027 (USD Million)
9.4.8 India
9.4.8.1 Market Size, By Solutions, 2022-2027 (USD Million)
9.4.8.2 Market Size, By Hardware, 2022-2027 (USD Million)
9.4.8.3 Market Size, By Services, 2022-2027 (USD Million)
9.4.8.4 Market Size, By Deployment Modes, 2022-2027 (USD Million)
9.4.8.5 Market Size, By User Types, 2022-2027 (USD Million)
9.4.9 Japan
9.4.9.1 Market Size, By Solutions, 2022-2027 (USD Million)
9.4.9.2 Market Size, By Hardware, 2022-2027 (USD Million)
9.4.9.3 Market Size, By Services, 2022-2027 (USD Million)
9.4.9.4 Market Size, By Deployment Modes, 2022-2027 (USD Million)
9.4.9.5 Market Size, By User Types, 2022-2027 (USD Million)
9.5 Central & South America
9.5.1 Market Size, By Country 2022-2027 (USD Million)
9.5.2 Market Size, By Solutions, 2022-2027 (USD Million)
9.5.3 Market Size, By Hardware, 2022-2027 (USD Million)
9.5.4 Market Size, By Services, 2022-2027 (USD Million)
9.5.5 Market Size, By Deployment Modes, 2022-2027 (USD Million)
9.5.6 Market Size, By User Types, 2022-2027 (USD Million)
9.5.7 Brazil
9.5.7.1 Market Size, By Solutions, 2022-2027 (USD Million)
9.5.7.2 Market Size, By Hardware, 2022-2027 (USD Million)
9.5.7.3 Market Size, By Services, 2022-2027 (USD Million)
9.5.7.4 Market Size, By Deployment Modes, 2022-2027 (USD Million)
9.5.6 Market Size, By User Types, 2022-2027 (USD Million)
9.5.8 Mexico
9.5.8.1 Market Size, By Solutions, 2022-2027 (USD Million)
9.5.8.2 Market Size, By Hardware, 2022-2027 (USD Million)
9.5.8.3 Market Size, By Services, 2022-2027 (USD Million)
9.5.8.4 Market Size, By Deployment Modes, 2022-2027 (USD Million)
9.5.8.5 Market Size, By User Types, 2022-2027 (USD Million)
9.5.9 Argentina
9.5.9.1 Market Size, By Solutions, 2022-2027 (USD Million)
9.5.9.2 Market Size, By Hardware, 2022-2027 (USD Million)
9.5.9.3 Market Size, By Services, 2022-2027 (USD Million)
9.5.9.4 Market Size, By Deployment Modes, 2022-2027 (USD Million)
9.5.9.5 Market Size, By User Types, 2022-2027 (USD Million)
9.6 MEA
9.6.1 Market Size, By Country 2022-2027 (USD Million)
9.6.2 Market Size, By Solutions, 2022-2027 (USD Million)
9.6.3 Market Size, By Hardware, 2022-2027 (USD Million)
9.6.4 Market Size, By Services, 2022-2027 (USD Million)
9.6.5 Market Size, By Deployment Modes, 2022-2027 (USD Million)
9.6.6 Market Size, By User Types, 2022-2027 (USD Million)
9.6.7 Saudi Arabia
9.6.7.1 Market Size, By Solutions, 2022-2027 (USD Million)
9.6.7.2 Market Size, By Hardware, 2022-2027 (USD Million)
9.6.7.3 Market Size, By Services, 2022-2027 (USD Million)
9.6.7.4 Market Size, By Deployment Modes, 2022-2027 (USD Million)
9.6.7.5 Market Size, By User Types, 2022-2027 (USD Million)
9.6.8 UAE
9.6.8.1 Market Size, By Solutions, 2022-2027 (USD Million)
9.6.8.2 Market Size, By Hardware, 2022-2027 (USD Million)
9.6.8.3 Market Size, By Services, 2022-2027 (USD Million)
9.6.8.4 Market Size, By Deployment Modes, 2022-2027 (USD Million)
9.5.8.5 Market Size, By User Types, 2022-2027 (USD Million)
9.6.9 South Africa
9.6.9.1 Market Size, By Solutions, 2022-2027 (USD Million)
9.6.9.2 Market Size, By Hardware, 2022-2027 (USD Million)
9.6.9.3 Market Size, By Services, 2022-2027 (USD Million)
9.6.9.4 Market Size, By Deployment Modes, 2022-2027 (USD Million)
9.6.9.5 Market Size, By User Types, 2022-2027 (USD Million)
Chapter 10 Company Landscape
10.1 Competitive Analysis, 2022
10.2 Sony
10.2.1 Company Overview
10.2.2 Financial Analysis
10.2.3 Strategic Positioning
10.2.4 Info Graphic Analysis
10.3 Samsung Electronics
10.3.1 Company Overview
10.3.2 Financial Analysis
10.3.3 Strategic Positioning
10.3.4 Info Graphic Analysis
10.4 HTC
10.4.1 Company Overview
10.4.2 Financial Analysis
10.4.3 Strategic Positioning
10.4.4 Info Graphic Analysis
10.5 Google
10.5.1 Company Overview
10.5.2 Financial Analysis
10.5.3 Strategic Positioning
10.5.4 Info Graphic Analysis
10.6 Microsoft
10.6.1 Company Overview
10.6.2 Financial Analysis
10.6.3 Strategic Positioning
10.6.4 Info Graphic Analysis
10.7 Panasonic
10.7.1 Company Overview
10.7.2 Financial Analysis
10.7.3 Strategic Positioning
10.7.4 Info Graphic Analysis
10.8 Hitachi
10.10.1 Company Overview
10.10.2 Financial Analysis
10.10.3 Strategic Positioning
10.10.4 Info Graphic Analysis
10.9 Barco
10.9.1 Company Overview
10.9.2 Financial Analysis
10.9.3 Strategic Positioning
10.9.4 Info Graphic Analysis
10.10 LG Electronics
10.10.1 Company Overview
10.10.2 Financial Analysis
10.10.3 Strategic Positioning
10.10.4 Info Graphic Analysis
10.11 Veative Labs
10.11.1 Company Overview
10.11.2 Financial Analysis
10.11.3 Strategic Positioning
10.11.4 Info Graphic Analysis
10.12 Cisco
10.12.1 Company Overview
10.12.2 Financial Analysis
10.12.3 Strategic Positioning
10.12.4 Info Graphic Analysis
10.13 Blackboard
10.13.1 Company Overview
10.13.2 Financial Analysis
10.13.3 Strategic Positioning
10.13.4 Info Graphic Analysis
10.14 Dell
10.14.1 Company Overview
10.14.2 Financial Analysis
10.14.3 Strategic Positioning
10.14.4 Info Graphic Analysis
10.15 IBM
10.15.1 Company Overview
10.15.2 Financial Analysis
10.15.3 Strategic Positioning
10.15.4 Info Graphic Analysis
10.16 Saba Software
10.16.1 Company Overview
10.16.2 Financial Analysis
10.16.3 Strategic Positioning
10.16.4 Info Graphic Analysis
10.17 Oracle
10.17.1 Company Overview
10.17.2 Financial Analysis
10.17.3 Strategic Positioning
10.17.4 Info Graphic Analysis
10.18 Edvance360
10.18.1 Company Overview
10.18.2 Financial Analysis
10.18.3 Strategic Positioning
10.18.4 Info Graphic Analysis
10.19 Electa Communications
10.19.1 Company Overview
10.19.2 Financial Analysis
10.19.3 Strategic Positioning
10.19.4 Info Graphic Analysis
10.20 BrainCert
10.20.1 Company Overview
10.20.2 Financial Analysis
10.20.3 Strategic Positioning
10.20.4 Info Graphic Analysis
10.21 SKYPREP
10.21.1 Company Overview
10.21.2 Financial Analysis
10.21.3 Strategic Positioning
10.21.4 Info Graphic Analysis
10.22 Impero Software
10.22.1 Company Overview
10.22.2 Financial Analysis
10.22.3 Strategic Positioning
10.22.4 Info Graphic Analysis
10.23 WizIQ
10.23.1 Company Overview
10.23.2 Financial Analysis
10.23.3 Strategic Positioning
10.23.4 Info Graphic Analysis
10.24 BigBlueButton
10.24.1 Company Overview
10.24.2 Financial Analysis
10.24.3 Strategic Positioning
10.24.4 Info Graphic Analysis
10.25 Digital Samba
10.25.1 Company Overview
10.25.2 Financial Analysis
10.25.3 Strategic Positioning
10.25.4 Info Graphic Analysis
10.26 TutorRoom
10.26.1 Company Overview
10.26.2 Financial Analysis
10.26.3 Strategic Positioning
10.26.4 Info Graphic Analysis
The Global Augmented and Virtual Reality in Education Market has been studied from the year 2019 till 2027. However, the CAGR provided in the report is from the year 2022 to 2027. The research methodology involved three stages: Desk research, Primary research, and Analysis & Output from the entire research process.

The desk research involved a robust background study which meant referring to paid and unpaid databases to understand the market dynamics; mapping contracts from press releases; identifying the key players in the market, studying their product portfolio, competition level, annual reports/SEC filings & investor presentations; and learning the demand and supply-side analysis for the Augmented and Virtual Reality in Education Market.

The primary research activity included telephonic conversations with more than 50 tier 1 industry consultants, distributors, and end-use product manufacturers.

Finally, based on the above thorough research process, an in-depth analysis was carried out considering the following aspects: market attractiveness, current & future market trends, market share analysis, SWOT analysis of the company and customer analytics.

Frequently Asked Questions

This FREE sample includes market data points, ranging from trend analyses to market estimates & forecasts. See for yourself.
Or view our licence options:
Tailor made solutions just for you
80% of our clients seek made-to-order reports. How do you want us to tailor yours?
OUR CLIENTS


