This report was recently updated on August 15 2025 with the latest and most recent
market numbers
Global Augmented-connected Workforce Market Size, Trends & Analysis - Forecasts to 2029 By Component (Hardware, Software, and Service), By Enterprise (SME and Large Enterprise), By Deployment (On-premise and Cloud), By End User (Manufacturing, Healthcare, Construction, Mining, and Oil & Gas), and By Region (North America, Asia Pacific, Central and South America, Europe, and Middle East and Africa), Competitive Landscape, Company Market Share Analysis, and End User Analysis
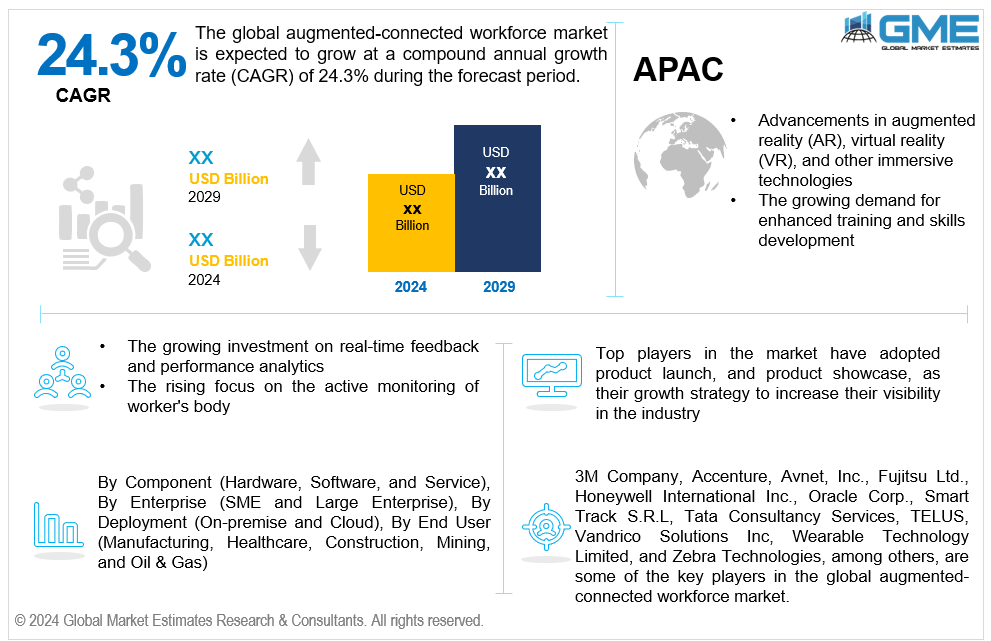
The global augmented-connected workforce market is estimated to exhibit a CAGR of 24.3% from 2024 to 2029.
The primary factors propelling the market growth are the advancements in augmented reality (AR), virtual reality (VR), and other immersive technologies and the growing demand for enhanced training and skills development. Virtual reality (VR) and augmented reality (AR) technologies offer more immersive learning experiences than traditional training methods. This enables workers to participate in dynamic scenarios and realistic simulations, improving skill application and retention. Organizations can establish virtual environments where employees can obtain hands-on training without physical resources by utilizing augmented-connected workforce solutions. This is especially helpful in fields where in-person instruction can be prohibitively costly, hazardous, or impossible. For instance, VR safety training in the mining sector has led to a remarkable 43% decrease in lost time from injuries, according to the Minesafe International Conference. This indicates the substantial influence of virtual reality on improving safety protocols in mining activities.
The growing investment on real-time feedback and performance analytics along with the rising focus on the active monitoring of worker's health condition are expected to support the market growth. Companies can ensure that workers adhere to health and safety laws by implementing active monitoring. Wearable technology with sensors can monitor the surroundings and identify possible risks, making the workplace safer. Real-time monitoring of workers' physiological data can assist in preventing workplace injuries by enabling the early detection of physical stress or weariness. Wearable technology data can reveal information about an employee's posture, motions, and general health, enabling prompt adjustments. For instance, the Personal Safety Division of 3M and Cority, a global enterprise environmental, health, and safety (EHS) software supplier, collaborated in March 2021 to offer workers Connected Safety technology.
The global shift toward remote and distributed workforces and the rising adoption of the Internet of Things (IoT) propel market growth. The integration of different sensors and devices into the office setting is made possible by IoT. These devices can monitor and gather information on worker behaviors, ambient factors, and equipment usage, giving valuable insights for enhancing operations. IoT also allows companies to monitor and manage a variety of operational factors remotely. This is especially helpful for overseeing field operations, distant sites, and dispersed workforces. Remote monitoring enhances visibility and control over different work environments.
Tailoring augmented-connected workforce solutions to specific industries presents opportunities for providers. Industry-specific challenges and needs can be addressed by tailoring solutions to various industries' specific requirements, including manufacturing, healthcare, logistics, and field services. Additionally, the enormous volumes of data produced by workforce solutions that are augmented and connected offer opportunities for sophisticated analysis and comprehension. Organizations can gain insight into employee performance, productivity, and growth prospects by using this information to make data-driven decisions.
However, the high cost of implementation and a lack of industry-wide standardization hinder market growth.
The hardware segment is expected to hold the largest share of the market over the forecast period. Wearables, IoT devices, smart glasses, and other hardware components are frequently needed for augmented-connected workforce solutions. These physical devices serve as the fundamental building blocks of the augmented-connected ecosystem, providing the necessary infrastructure for data gathering, communication, and interaction in real-time. Moreover, the adoption of augmented-connected workforce solutions is fueled by continuous developments in hardware technologies, such as enhanced form factors, connectivity, and sensors. Organizations are more likely to invest in modern, cutting-edge gadgets as hardware capabilities change to remain competitive.
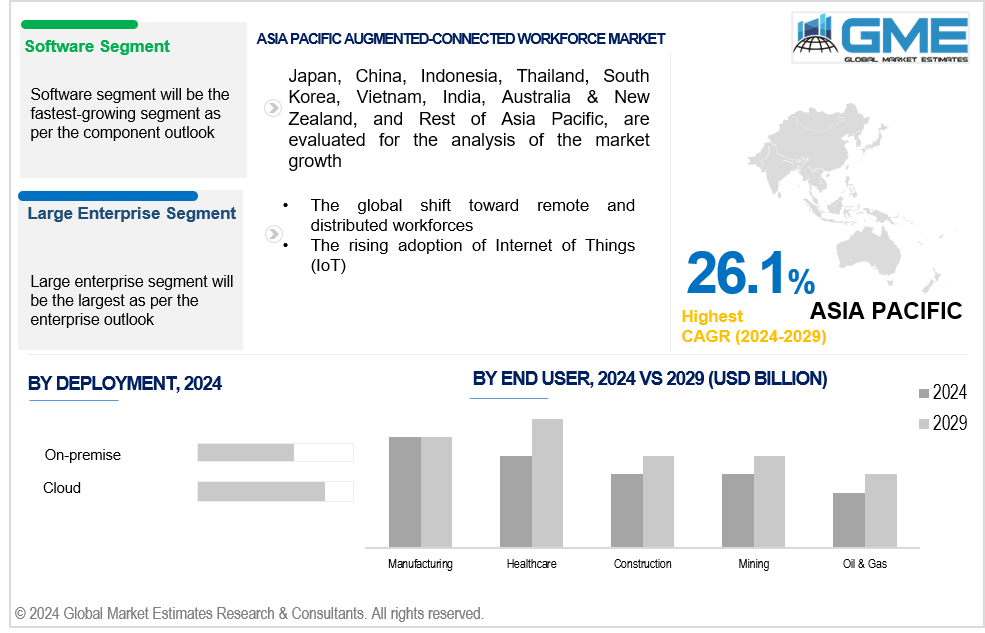
The software segment is expected to be the fastest-growing segment in the market from 2024-2029. The creation of immersive training and simulation applications is driven by the software segment. Software for virtual reality (VR) and augmented reality (AR) offers realistic and engaging training experiences, improving onboarding procedures, skill development, and overall workforce readiness.
The large enterprise segment is expected to hold the largest share of the market over the forecast period. Large enterprises usually have complex procedures, a large workforce, and expansive operations. Given the scope and complexity of jobs and processes in such environments, the adoption of augmented-connected workforce solutions becomes more prominent.
The SME segment is anticipated to be the fastest-growing segment in the market from 2024-2029. Solution providers are creating augmented-connected workforce solutions specially designed to meet the demands of smaller enterprises as they understand the unique needs of SMEs. Since these solutions are frequently flexible, SMEs can adopt and alter features to suit their unique processes.
The cloud segment is expected to hold the largest share of the market over the forecast period. Cloud-based solutions provide the flexibility to adjust to changing company needs and the scalability to handle variable workloads. This is especially helpful given how quickly augmented-connected workforce technologies are developing.
The on-premise segment is anticipated to be the fastest-growing segment in the market from 2024-2029. On-premise solutions offer a higher degree of customization and tailoring to meet specific organizational needs. This is especially important for companies that have distinct workflows, specialized procedures, or particular integration needs and would benefit from a more customized deployment.
The manufacturing segment is expected to hold the largest share of the market over the forecast period. The manufacturing industry is at the forefront of adopting Industry 4.0 principles, which emphasize the integration of digital technologies for smart and connected manufacturing. Solutions for an augmented-connected workforce support Industry 4.0 objectives by enabling the integration of analog and digital industrial processes.
The healthcare segment is anticipated to be the fastest-growing segment in the market from 2024-2029. The healthcare industry increasingly relies on telemedicine and remote assistance. Healthcare providers can offer remote consultations, real-time help during procedures, and improved teamwork among medical teams, particularly in critical and emergency situations, owing to augmented-connected workforce solutions.
North America is expected to be the largest region in the global market. In North America, particularly the U.S. places a great importance on technological innovation. Advancements in augmented reality (AR), virtual reality (VR), and Internet of Things (IoT) technologies are driving the development and adoption of augmented-connected workforce solutions. For instance, according to IoT Analytics, the healthcare industry is in accountable for 6% of all IoT projects globally, with 55% of those projects taking place in the Americas.
Asia Pacific is anticipated to witness rapid growth during the forecast period. Asia Pacific’s prominence as a manufacturing and industrial hub is driving the adoption of augmented-connected workforce solutions across supply chain, logistics, and manufacturing processes. This implementation is enhancing productivity, quality, and efficiency within these domains, thereby propelling market growth. For instance, the manufacturing sector's index of industrial production for the fiscal year 2021–2022 in India was 116.9 in January 2022, according to MOSPI. The manufacturing sector in India has steadily become one of the fastest-growing industries.
3M Company, Accenture, Avnet, Inc., Fujitsu Ltd., Honeywell International Inc., Oracle Corp., Smart Track S.R.L, Tata Consultancy Services, TELUS, Vandrico Solutions Inc, Wearable Technology Limited, and Zebra Technologies among others, are some of the key players in the global augmented-connected workforce market.
Please note: This is not an exhaustive list of companies profiled in the report.
In March 2023, 3M announced the collaboration with Guardhat, an industry-leading connected safety software company. With connection becoming an increasingly important part of safety programs, 3M is migrating its Safety Inspection Management (SIM) software to Guardhat.
In November 2023, Accenture and Workday, Inc. announced the expanded collaboration to help companies accelerate their adoption of skills-based talent strategies and help unlock greater agility and potential.
1 STRATEGIC INSIGHTS ON NEW REVENUE POCKETS
1.1 Strategic Opportunity & Attractiveness Analysis
1.1.1 Hot Revenue Pockets
1.1.2 Market Attractiveness Score
1.1.3 Revenue Impacting Opportunity
1.1.4 High Growing Region/Country
1.1.5 Competitor Analysis
1.1.6 Consumer Analysis
1.2 Global Market Estimates' View
1.3 Strategic Insights across Business Functions
1.3.1 For Chief Executive Officers
1.3.2 For Chief Marketing Officers
1.3.3 For Chief Strategy Officers
1.4 Evaluate the Potential of your Existing Business Lines vs. New Lines to Enter Into
2 TECHNOLOGICAL TRENDS
2.1 Technological Adoption Rate
2.2 Current Trend Impact Analysis
2.3 Future Trend Impact Analysis
3 GLOBAL MARKET OUTLOOK
3.1 Market Pyramid Analysis
3.1.1 Introduction
3.1.2 Adjacent Market Opportunities
3.1.3 Ancillary Market Opportunities
3.2 Demand Side Analysis
3.2.1 Market Drivers: Impact Analysis
3.2.2 Market Restraints: Impact Analysis
3.2.3 Market Opportunities: Impact Analysis
3.2.4 Market Challenges: Impact Analysis
3.3 Supply Side Analysis
3.3.1 Porter’s Five Forces Analysis
3.3.1.1 Threat of New Entrants
3.3.1.2 Threat of New Substitutes
3.3.1.3 Bargaining Power of Suppliers
3.3.1.4 Bargaining Power of Buyers
3.3.1.5 Intensity of Competitive Rivalry
3.3.2 SWOT Analysis; By Factor (Political & Legal, Economic, and Technological)
3.3.2.1 Political Landscape
3.3.2.2 Economic Landscape
3.3.2.3 Social Landscape
3.3.2.4 Component Landscape
3.3.3 Value Chain Analysis
3.3.4 Trend Analysis
3.3.5 Gap Analysis
3.3.6 Cost Analysis
4 GLOBAL AUGMENTED-CONNECTED WORKFORCE MARKET, BY COMPONENT
4.1 Introduction
4.2 Augmented-connected Workforce Market: Component Scope Key Takeaways
4.3 Revenue Growth Analysis, 2023 & 2029
4.4 Software
4.4.1 Software Market Estimates and Forecast, 2021-2029 (USD Billion)
4.5 Hardware
4.5.1 Hardware Market Estimates and Forecast, 2021-2029 (USD Billion)
4.6 Services
4.6.1 Services Market Estimates and Forecast, 2021-2029 (USD Billion)
5 GLOBAL AUGMENTED-CONNECTED WORKFORCE MARKET, BY ENTERPRISE
5.1 Introduction
5.2 Augmented-connected Workforce Market: Enterprise Scope Key Takeaways
5.3 Revenue Growth Analysis, 2023 & 2029
5.4 SME
5.4.1 SME Market Estimates and Forecast, 2021-2029 (USD Billion)
5.5 Large Enterprise
5.5.1 Large Enterprise Market Estimates and Forecast, 2021-2029 (USD Billion)
6 GLOBAL AUGMENTED-CONNECTED WORKFORCE MARKET, BY DEPLOYMENT
6.1 Introduction
6.2 Augmented-connected Workforce Market: Deployment Scope Key Takeaways
6.3 Revenue Growth Analysis, 2023 & 2029
6.4 On-premise
6.4.1 On-premise Market Estimates and Forecast, 2021-2029 (USD Billion)
6.5 Cloud
6.5.1 Cloud Market Estimates and Forecast, 2021-2029 (USD Billion)
7 GLOBAL AUGMENTED-CONNECTED WORKFORCE MARKET, BY END USER
7.1 Introduction
7.2 Augmented-connected Workforce Market: End User Scope Key Takeaways
7.3 Revenue Growth Analysis, 2023 & 2029
7.4 Manufacturing
7.4.1 Manufacturing Market Estimates and Forecast, 2021-2029 (USD Billion)
7.5 Healthcare
7.5.1 Healthcare Market Estimates and Forecast, 2021-2029 (USD Billion)
7.6 Construction
7.6.1 Construction Market Estimates and Forecast, 2021-2029 (USD Billion)
7.7 Mining
7.7.1 Mining Market Estimates and Forecast, 2021-2029 (USD Billion)
7.8 Oil & Gas
7.8.1 Oil & Gas Market Estimates and Forecast, 2021-2029 (USD Billion)
8 GLOBAL AUGMENTED-CONNECTED WORKFORCE MARKET, BY REGION
8.1 Introduction
8.2 North America Augmented-connected Workforce Market Estimates and Forecast, 2021-2029 (USD Billion)
8.2.1 By Component
8.2.2 By Enterprise
8.2.3 By Deployment
8.2.4 By End User
8.2.5 By Country
8.2.5.1 U.S. Augmented-connected Workforce Market Estimates and Forecast, 2021-2029 (USD Billion)
8.2.5.1.1 By Component
8.2.5.1.2 By Enterprise
8.2.5.1.3 By Deployment
8.2.5.1.4 By End User
8.2.5.2 Canada Augmented-connected Workforce Market Estimates and Forecast, 2021-2029 (USD Billion)
8.2.5.2.1 By Component
8.2.5.2.2 By Enterprise
8.2.5.2.3 By Deployment
8.2.5.2.4 By End User
8.2.5.3 Mexico Augmented-connected Workforce Market Estimates and Forecast, 2021-2029 (USD Billion)
8.2.5.3.1 By Component
8.2.5.3.2 By Enterprise
8.2.5.3.3 By Deployment
8.2.5.3.4 By End User
8.3 Europe Augmented-connected Workforce Market Estimates and Forecast, 2021-2029 (USD Billion)
8.3.1 By Component
8.3.2 By Enterprise
8.3.3 By Deployment
8.3.4 By End User
8.3.5 By Country
8.3.5.1 Germany Augmented-connected Workforce Market Estimates and Forecast, 2021-2029 (USD Billion)
8.3.5.1.1 By Component
8.3.5.1.2 By Enterprise
8.3.5.1.3 By Deployment
8.3.5.1.4 By End User
8.3.5.2 U.K. Presered Flowers Market Estimates and Forecast, 2021-2029 (USD Billion)
8.3.5.2.1 By Component
8.3.5.2.2 By Enterprise
8.3.5.2.3 By Deployment
8.3.5.2.4 By End User
8.3.5.3 France Augmented-connected Workforce Market Estimates and Forecast, 2021-2029 (USD Billion)
8.3.5.3.1 By Component
8.3.5.3.2 By Enterprise
8.3.5.3.3 By Deployment
8.3.5.3.4 By End User
8.3.5.4 Italy Augmented-connected Workforce Market Estimates and Forecast, 2021-2029 (USD Billion)
8.3.5.4.1 By Component
8.3.5.4.2 By Enterprise
8.3.5.4.3 By Deployment
8.3.5.4.4 By End User
8.3.5.5 Spain Augmented-connected Workforce Market Estimates and Forecast, 2021-2029 (USD Billion)
8.3.5.5.1 By Component
8.3.5.5.2 By Enterprise
8.3.5.5.3 By Deployment
8.3.5.5.4 By End User
8.3.5.6 Netherlands Augmented-connected Workforce Market Estimates and Forecast, 2021-2029 (USD Billion)
8.3.5.6.1 By Component
8.3.5.6.2 By Enterprise
8.3.5.6.3 By Deployment
8.3.5.6.4 By End User
8.3.5.7 Rest of Europe Augmented-connected Workforce Market Estimates and Forecast, 2021-2029 (USD Billion)
8.3.5.7.1 By Component
8.3.5.7.2 By Enterprise
8.3.5.7.3 By Deployment
8.3.5.7.4 By End User
8.4 Asia Pacific Augmented-connected Workforce Market Estimates and Forecast, 2021-2029 (USD Billion)
8.4.1 By Component
8.4.2 By Enterprise
8.4.3 By Deployment
8.4.4 By End User
8.4.5 By Country
8.4.5.1 China Augmented-connected Workforce Market Estimates and Forecast, 2021-2029 (USD Billion)
8.4.5.1.1 By Component
8.4.5.1.2 By Enterprise
8.4.5.1.3 By Deployment
8.4.5.1.4 By End User
8.4.5.2 Japan Augmented-connected Workforce Market Estimates and Forecast, 2021-2029 (USD Billion)
8.4.5.2.1 By Component
8.4.5.2.2 By Enterprise
8.4.5.2.3 By Deployment
8.4.5.2.4 By End User
8.4.5.3 India Augmented-connected Workforce Market Estimates and Forecast, 2021-2029 (USD Billion)
8.4.5.3.1 By Component
8.4.5.3.2 By Enterprise
8.4.5.3.3 By Deployment
8.4.5.3.4 By End User
8.4.5.4 South Korea Augmented-connected Workforce Market Estimates and Forecast, 2021-2029 (USD Billion)
8.4.5.4.1 By Component
8.4.5.4.2 By Enterprise
8.4.5.4.3 By Deployment
8.4.5.4.4 By End User
8.4.5.5 Singapore Augmented-connected Workforce Market Estimates and Forecast, 2021-2029 (USD Billion)
8.4.5.5.1 By Component
8.4.5.5.2 By Enterprise
8.4.5.5.3 By Deployment
8.4.5.5.4 By End User
8.4.5.6 Malaysia Augmented-connected Workforce Market Estimates and Forecast, 2021-2029 (USD Billion)
8.4.5.6.1 By Component
8.4.5.6.2 By Enterprise
8.4.5.6.3 By Deployment
8.4.5.6.4 By End User
8.4.5.7 Thailand Augmented-connected Workforce Market Estimates and Forecast, 2021-2029 (USD Billion)
8.4.5.7.1 By Component
8.4.5.7.2 By Enterprise
8.4.5.7.3 By Deployment
8.4.5.7.4 By End User
8.4.5.8 Indonesia Augmented-connected Workforce Market Estimates and Forecast, 2021-2029 (USD Billion)
8.4.5.8.1 By Component
8.4.5.8.2 By Enterprise
8.4.5.8.3 By Deployment
8.4.5.8.4 By End User
8.4.5.9 Vietnam Augmented-connected Workforce Market Estimates and Forecast, 2021-2029 (USD Billion)
8.4.5.9.1 By Component
8.4.5.9.2 By Enterprise
8.4.5.9.3 By Deployment
8.4.5.9.4 By End User
8.4.5.10 Taiwan Augmented-connected Workforce Market Estimates and Forecast, 2021-2029 (USD Billion)
8.4.5.10.1 By Component
8.4.5.10.2 By Enterprise
8.4.5.10.3 By Deployment
8.4.5.10.4 By End User
8.4.5.11 Rest of Asia Pacific Augmented-connected Workforce Market Estimates and Forecast, 2021-2029 (USD Billion)
8.4.5.11.1 By Component
8.4.5.11.2 By Enterprise
8.4.5.11.3 By Deployment
8.4.5.11.4 By End User
8.5 Middle East and Africa Augmented-connected Workforce Market Estimates and Forecast, 2021-2029 (USD Billion)
8.5.1 By Component
8.5.2 By Enterprise
8.5.3 By Deployment
8.5.4 By End User
8.5.5 By Country
8.5.5.1 Saudi Arabia Augmented-connected Workforce Market Estimates and Forecast, 2021-2029 (USD Billion)
8.5.5.1.1 By Component
8.5.5.1.2 By Enterprise
8.5.5.1.3 By Deployment
8.5.5.1.4 By End User
8.5.5.2 U.A.E. Augmented-connected Workforce Market Estimates and Forecast, 2021-2029 (USD Billion)
8.5.5.2.1 By Component
8.5.5.2.2 By Enterprise
8.5.5.2.3 By Deployment
8.5.5.2.4 By End User
8.5.5.3 Israel Augmented-connected Workforce Market Estimates and Forecast, 2021-2029 (USD Billion)
8.5.4.3.1 By Component
8.5.4.3.2 By Enterprise
8.5.4.3.3 By Deployment
8.5.5.3.4 By End User
8.5.5.4 South Africa Augmented-connected Workforce Market Estimates and Forecast, 2021-2029 (USD Billion)
8.5.5.4.1 By Component
8.5.5.4.2 By Enterprise
8.5.5.4.3 By Deployment
8.5.5.4.4 By End User
8.5.5.5 Rest of Middle East and Africa Augmented-connected Workforce Market Estimates and Forecast, 2021-2029 (USD Billion)
8.5.5.5.1 By Component
8.5.5.5.2 By Enterprise
8.5.5.5.2 By Deployment
8.5.5.5.4 By End User
8.6 Central and South America Augmented-connected Workforce Market Estimates and Forecast, 2021-2029 (USD Billion)
8.6.1 By Component
8.6.2 By Enterprise
8.6.3 By Deployment
8.6.4 By End User
8.6.5 By Country
8.6.5.1 Brazil Augmented-connected Workforce Market Estimates and Forecast, 2021-2029 (USD Billion)
8.6.5.1.1 By Component
8.6.5.1.2 By Enterprise
8.6.5.1.3 By Deployment
8.6.5.1.4 By End User
8.6.5.2 Argentina Augmented-connected Workforce Market Estimates and Forecast, 2021-2029 (USD Billion)
8.6.5.2.1 By Component
8.6.5.2.2 By Enterprise
8.6.5.2.3 By Deployment
8.6.5.2.4 By End User
8.6.5.3 Chile Augmented-connected Workforce Market Estimates and Forecast, 2021-2029 (USD Billion)
8.6.5.3.1 By Component
8.6.5.3.2 By Enterprise
8.6.5.3.3 By Deployment
8.6.5.5.4 By End User
8.6.5.4 Rest of Central and South America Augmented-connected Workforce Market Estimates and Forecast, 2021-2029 (USD Billion)
8.6.5.4.1 By Component
8.6.5.4.2 By Enterprise
8.6.5.4.3 By Deployment
8.6.5.4.4 By End User
9 COMPETITIVE LANDCAPE
9.1 Company Market Share Analysis
9.2 Four Quadrant Positioning Matrix
9.2.1 Market Leaders
9.2.2 Market Visionaries
9.2.3 Market Challengers
9.2.4 Niche Market Players
9.3 Vendor Landscape
9.3.1 North America
9.3.2 Europe
9.3.3 Asia Pacific
9.3.4 Rest of the World
9.4 Company Profiles
9.4.1 3M Company
9.4.1.1 Business Description & Financial Analysis
9.4.1.2 SWOT Analysis
9.4.1.3 Products & Services Offered
9.4.1.4 Strategic Alliances between Business Partners
9.4.2 Accenture
9.4.2.1 Business Description & Financial Analysis
9.4.2.2 SWOT Analysis
9.4.2.3 Products & Services Offered
9.4.2.4 Strategic Alliances between Business Partners
9.4.3 Avnet, Inc.
9.4.3.1 Business Description & Financial Analysis
9.4.3.2 SWOT Analysis
9.4.3.3 Products & Services Offered
9.4.3.4 Strategic Alliances between Business Partners
9.4.4 Fujitsu Ltd.
9.4.4.1 Business Description & Financial Analysis
9.4.4.2 SWOT Analysis
9.4.4.3 Products & Services Offered
9.4.4.4 Strategic Alliances between Business Partners
9.4.5 Honeywell International Inc.
9.4.5.1 Business Description & Financial Analysis
9.4.5.2 SWOT Analysis
9.4.5.3 Products & Services Offered
9.4.5.4 Strategic Alliances between Business Partners
9.4.6 ORACLE CORP.
9.4.6.1 Business Description & Financial Analysis
9.4.6.2 SWOT Analysis
9.4.6.3 Products & Services Offered
9.4.6.4 Strategic Alliances between Business Partners
9.4.7 Smart Track S.R.L
9.4.7.1 Business Description & Financial Analysis
9.4.7.2 SWOT Analysis
9.4.7.3 Products & Services Offered
9.4.8.4 Strategic Alliances between Business Partners
9.4.8 Tata Consultancy Services
9.4.8.1 Business Description & Financial Analysis
9.4.8.2 SWOT Analysis
9.4.8.3 Products & Services Offered
9.4.8.4 Strategic Alliances between Business Partners
9.4.9 TELUS
9.4.9.1 Business Description & Financial Analysis
9.4.9.2 SWOT Analysis
9.4.9.3 Products & Services Offered
9.4.9.4 Strategic Alliances between Business Partners
9.4.10 Vandrico Solutions Inc
9.4.10.1 Business Description & Financial Analysis
9.4.10.2 SWOT Analysis
9.4.10.3 Products & Services Offered
9.4.10.4 Strategic Alliances between Business Partners
9.4.11 Other Companies
9.4.11.1 Business Description & Financial Analysis
9.4.11.2 SWOT Analysis
9.4.11.3 Products & Services Offered
9.4.11.4 Strategic Alliances between Business Partners
10 RESEARCH METHODOLOGY
10.1 Market Introduction
10.1.1 Market Definition
10.1.2 Market Scope & Segmentation
10.2 Information Procurement
10.2.1 Secondary Research
10.2.1.1 Purchased Databases
10.2.1.2 GMEs Internal Data Repository
10.2.1.3 Secondary Resources & Third Party Perspectives
10.2.1.4 Company Information Sources
10.2.2 Primary Research
10.2.2.1 Various Types of Respondents for Primary Interviews
10.2.2.2 Number of Interviews Conducted throughout the Research Process
10.2.2.3 Primary Stakeholders
10.2.2.4 Discussion Guide for Primary Participants
10.2.3 Expert Panels
10.2.3.1 Expert Panels Across 30+ Industry
10.2.4 Paid Local Experts
10.2.4.1 Paid Local Experts Across 30+ Industry Across each Region
10.3 Market Estimation
10.3.1 Top-Down Approach
10.3.1.1 Macro-Economic Indicators Considered
10.3.1.2 Micro-Economic Indicators Considered
10.3.2 Bottom Up Approach
10.3.2.1 Company Share Analysis Approach
10.3.2.2 Estimation of Potential Product Sales
10.4 Data Triangulation
10.4.1 Data Collection
10.4.2 Time Series, Cross Sectional & Panel Data Analysis
10.4.3 Cluster Analysis
10.5 Analysis and Output
10.5.1 Inhouse AI Based Real Time Analytics Tool
10.5.2 Output From Desk & Primary Research
10.6 Research Assumptions & Limitations
10.7.1 Research Assumptions
10.7.2 Research Limitations
LIST OF TABLES
1 Global Augmented-connected Workforce Market, By Component, 2021-2029 (USD Billion)
2 Software Market, By Region, 2021-2029 (USD Billion)
3 Hardware Market, By Region, 2021-2029 (USD Billion)
4 Services Market, By Region, 2021-2029 (USD Billion)
5 Global Augmented-connected Workforce Market, By Enterprise, 2021-2029 (USD Billion)
6 SME Market, By Region, 2021-2029 (USD Billion)
7 Large Enterprise Market, By Region, 2021-2029 (USD Billion)
8 Global Augmented-connected Workforce Market, By Deployment, 2021-2029 (USD Billion)
9 On-premise Market, By Region, 2021-2029 (USD Billion)
10 Cloud Market, By Region, 2021-2029 (USD Billion)
11 Global Augmented-connected Workforce Market, By END USER, 2021-2029 (USD Billion)
12 Manufacturing Market, By Region, 2021-2029 (USD Billion)
13 Healthcare Market, By Region, 2021-2029 (USD Billion)
14 Construction Market, By Region, 2021-2029 (USD Billion)
15 Mining Market, By Region, 2021-2029 (USD Billion)
16 Oil & Gas Market, By Region, 2021-2029 (USD Billion)
17 Regional Analysis, 2021-2029 (USD Billion)
18 North America Augmented-connected Workforce Market, By Component, 2021-2029 (USD Billion)
19 North America Augmented-connected Workforce Market, By Enterprise, 2021-2029 (USD Billion)
20 North America Augmented-connected Workforce Market, By Deployment, 2021-2029 (USD Billion)
21 North America Augmented-connected Workforce Market, By End User, 2021-2029 (USD Billion)
22 North America Augmented-connected Workforce Market, By Country, 2021-2029 (USD Billion)
23 U.S Augmented-connected Workforce Market, By Component, 2021-2029 (USD Billion)
24 U.S Augmented-connected Workforce Market, By Enterprise, 2021-2029 (USD Billion)
25 U.S Augmented-connected Workforce Market, By Deployment, 2021-2029 (USD Billion)
26 U.S Augmented-connected Workforce Market, By End User, 2021-2029 (USD Billion)
27 Canada Augmented-connected Workforce Market, By Component, 2021-2029 (USD Billion)
28 Canada Augmented-connected Workforce Market, By Enterprise, 2021-2029 (USD Billion)
29 Canada Augmented-connected Workforce Market, By Deployment, 2021-2029 (USD Billion)
30 CANADA Augmented-connected Workforce Market, By End User, 2021-2029 (USD Billion)
31 Mexico Augmented-connected Workforce Market, By Component, 2021-2029 (USD Billion)
32 Mexico Augmented-connected Workforce Market, By Enterprise, 2021-2029 (USD Billion)
33 Mexico Augmented-connected Workforce Market, By Deployment, 2021-2029 (USD Billion)
34 mexico Augmented-connected Workforce Market, By End User, 2021-2029 (USD Billion)
35 Europe Augmented-connected Workforce Market, By Component, 2021-2029 (USD Billion)
36 Europe Augmented-connected Workforce Market, By Enterprise, 2021-2029 (USD Billion)
37 Europe Augmented-connected Workforce Market, By Deployment, 2021-2029 (USD Billion)
38 europe Augmented-connected Workforce Market, By End User, 2021-2029 (USD Billion)
39 europe Augmented-connected Workforce Market, By COUNTRY, 2021-2029 (USD Billion)
40 Germany Augmented-connected Workforce Market, By Component, 2021-2029 (USD Billion)
41 Germany Augmented-connected Workforce Market, By Enterprise, 2021-2029 (USD Billion)
42 Germany Augmented-connected Workforce Market, By Deployment, 2021-2029 (USD Billion)
43 germany Augmented-connected Workforce Market, By End User, 2021-2029 (USD Billion)
44 UK Augmented-connected Workforce Market, By Component, 2021-2029 (USD Billion)
45 UK Augmented-connected Workforce Market, By Enterprise, 2021-2029 (USD Billion)
46 UK Augmented-connected Workforce Market, By Deployment, 2021-2029 (USD Billion)
47 U.kAugmented-connected Workforce Market, By End User, 2021-2029 (USD Billion)
48 France Augmented-connected Workforce Market, By Component, 2021-2029 (USD Billion)
49 France Augmented-connected Workforce Market, By Enterprise, 2021-2029 (USD Billion)
50 France Augmented-connected Workforce Market, By Deployment, 2021-2029 (USD Billion)
51 france Augmented-connected Workforce Market, By End User, 2021-2029 (USD Billion)
52 Italy Augmented-connected Workforce Market, By Component, 2021-2029 (USD Billion)
53 Italy Augmented-connected Workforce Market, By T Enterprise Type, 2021-2029 (USD Billion)
54 Italy Augmented-connected Workforce Market, By Deployment, 2021-2029 (USD Billion)
55 italy Augmented-connected Workforce Market, By End User, 2021-2029 (USD Billion)
56 Spain Augmented-connected Workforce Market, By Component, 2021-2029 (USD Billion)
57 Spain Augmented-connected Workforce Market, By Enterprise, 2021-2029 (USD Billion)
58 Spain Augmented-connected Workforce Market, By Deployment, 2021-2029 (USD Billion)
59 spain Augmented-connected Workforce Market, By End User, 2021-2029 (USD Billion)
60 Netherlands Augmented-connected Workforce Market, By Component, 2021-2029 (USD Billion)
61 Netherlands Augmented-connected Workforce Market, By Enterprise, 2021-2029 (USD Billion)
62 Netherlands Augmented-connected Workforce Market, By Deployment, 2021-2029 (USD Billion)
63 Netherlands Augmented-connected Workforce Market, By END USER, 2021-2029 (USD Billion)
64 Rest Of Europe Augmented-connected Workforce Market, By Component, 2021-2029 (USD Billion)
65 Rest Of Europe Augmented-connected Workforce Market, By Enterprise, 2021-2029 (USD Billion)
66 Rest of Europe Augmented-connected Workforce Market, By Deployment, 2021-2029 (USD Billion)
67 REST OF EUROPE Augmented-connected Workforce Market, By End User, 2021-2029 (USD Billion)
68 Asia Pacific Augmented-connected Workforce Market, By Component, 2021-2029 (USD Billion)
69 Asia Pacific Augmented-connected Workforce Market, By Enterprise, 2021-2029 (USD Billion)
70 Asia Pacific Augmented-connected Workforce Market, By Deployment, 2021-2029 (USD Billion)
71 asia Augmented-connected Workforce Market, By End User, 2021-2029 (USD Billion)
72 Asia Pacific Augmented-connected Workforce Market, By Country, 2021-2029 (USD Billion)
73 China Augmented-connected Workforce Market, By Component, 2021-2029 (USD Billion)
74 China Augmented-connected Workforce Market, By Enterprise, 2021-2029 (USD Billion)
75 China Augmented-connected Workforce Market, By Deployment, 2021-2029 (USD Billion)
76 china Augmented-connected Workforce Market, By End User, 2021-2029 (USD Billion)
77 India Augmented-connected Workforce Market, By Component, 2021-2029 (USD Billion)
78 India Augmented-connected Workforce Market, By Enterprise, 2021-2029 (USD Billion)
79 India Augmented-connected Workforce Market, By Deployment, 2021-2029 (USD Billion)
80 india Augmented-connected Workforce Market, By End User, 2021-2029 (USD Billion)
81 Japan Augmented-connected Workforce Market, By Component, 2021-2029 (USD Billion)
82 Japan Augmented-connected Workforce Market, By Enterprise, 2021-2029 (USD Billion)
83 Japan Augmented-connected Workforce Market, By Deployment, 2021-2029 (USD Billion)
84 japan Augmented-connected Workforce Market, By End User, 2021-2029 (USD Billion)
85 South Korea Augmented-connected Workforce Market, By Component, 2021-2029 (USD Billion)
86 South Korea Augmented-connected Workforce Market, By Enterprise, 2021-2029 (USD Billion)
87 South Korea Augmented-connected Workforce Market, By Deployment, 2021-2029 (USD Billion)
88 south korea Augmented-connected Workforce Market, By End User, 2021-2029 (USD Billion)
89 Singapore Augmented-connected Workforce Market, By Component, 2021-2029 (USD Billion)
90 Singapore Augmented-connected Workforce Market, By Enterprise, 2021-2029 (USD Billion)
91 Singapore Augmented-connected Workforce Market, By Deployment, 2021-2029 (USD Billion)
92 Singapore Augmented-connected Workforce Market, By End User, 2021-2029 (USD Billion)
93 Thailand Augmented-connected Workforce Market, By Component, 2021-2029 (USD Billion)
94 Thailand Augmented-connected Workforce Market, By Enterprise, 2021-2029 (USD Billion)
95 Thailand Augmented-connected Workforce Market, By Deployment, 2021-2029 (USD Billion)
96 Thailand Augmented-connected Workforce Market, By End User, 2021-2029 (USD Billion)
97 MALAYSIA Augmented-connected Workforce Market, By Component, 2021-2029 (USD Billion)
98 MALAYSIA Augmented-connected Workforce Market, By Enterprise, 2021-2029 (USD Billion)
99 MALAYSIA Augmented-connected Workforce Market, By Deployment, 2021-2029 (USD Billion)
100 MALAYSIA Augmented-connected Workforce Market, By End User, 2021-2029 (USD Billion)
101 Vietnam Augmented-connected Workforce Market, By Component, 2021-2029 (USD Billion)
102 Vietnam Augmented-connected Workforce Market, By Enterprise, 2021-2029 (USD Billion)
103 Vietnam Augmented-connected Workforce Market, By Deployment, 2021-2029 (USD Billion)
104 Taiwan Augmented-connected Workforce Market, By Component, 2021-2029 (USD Billion)
105 Taiwan Augmented-connected Workforce Market, By Enterprise, 2021-2029 (USD Billion)
106 Taiwan Augmented-connected Workforce Market, By Deployment, 2021-2029 (USD Billion)
107 Taiwan Augmented-connected Workforce Market, By End User, 2021-2029 (USD Billion)
108 REST OF APAC Augmented-connected Workforce Market, By Component, 2021-2029 (USD Billion)
109 REST OF APAC Augmented-connected Workforce Market, By Enterprise, 2021-2029 (USD Billion)
110 REST OF APAC Augmented-connected Workforce Market, By Deployment, 2021-2029 (USD Billion)
111 Rest of APAC Augmented-connected Workforce Market, By End User, 2021-2029 (USD Billion)
112 Middle East and Africa Augmented-connected Workforce Market, By Component, 2021-2029 (USD Billion)
113 Middle East and Africa Augmented-connected Workforce Market, By Enterprise, 2021-2029 (USD Billion)
114 Middle East and Africa Augmented-connected Workforce Market, By Deployment, 2021-2029 (USD Billion)
115 MIDDLE EAST AND AFRICA Augmented-connected Workforce Market, By End User, 2021-2029 (USD Billion)
116 Middle East and Africa Augmented-connected Workforce Market, By Country, 2021-2029 (USD Billion)
117 Saudi Arabia Augmented-connected Workforce Market, By Component, 2021-2029 (USD Billion)
118 Saudi Arabia Augmented-connected Workforce Market, By Enterprise, 2021-2029 (USD Billion)
119 Saudi Arabia Augmented-connected Workforce Market, By Deployment, 2021-2029 (USD Billion)
120 saudi arabia Augmented-connected Workforce Market, By End User, 2021-2029 (USD Billion)
121 UAE Augmented-connected Workforce Market, By Component, 2021-2029 (USD Billion)
122 UAE Augmented-connected Workforce Market, By Enterprise, 2021-2029 (USD Billion)
123 UAE Augmented-connected Workforce Market, By Deployment, 2021-2029 (USD Billion)
124 uae Augmented-connected Workforce Market, By End User, 2021-2029 (USD Billion)
125 Israel Augmented-connected Workforce Market, By Component, 2021-2029 (USD Billion)
126 Israel Augmented-connected Workforce Market, By Enterprise, 2021-2029 (USD Billion)
127 Israel Augmented-connected Workforce Market, By Deployment, 2021-2029 (USD Billion)
128 Israel Augmented-connected Workforce Market, By End User, 2021-2029 (USD Billion)
129 South Africa Augmented-connected Workforce Market, By Component, 2021-2029 (USD Billion)
130 South Africa Augmented-connected Workforce Market, By Enterprise, 2021-2029 (USD Billion)
131 South Africa Augmented-connected Workforce Market, By Deployment, 2021-2029 (USD Billion)
132 South Africa Augmented-connected Workforce Market, By End User, 2021-2029 (USD Billion)
133 REST OF MIDDLE EAST AND AFRICA Augmented-connected Workforce Market, By Component, 2021-2029 (USD Billion)
134 REST OF MIDDLE EAST AND AFRICA Augmented-connected Workforce Market, By Enterprise, 2021-2029 (USD Billion)
135 REST OF MIDDLE EAST AND AFRICA Augmented-connected Workforce Market, By Deployment, 2021-2029 (USD Billion)
136 REST OF MIDDLE EAST AND AFRICA Augmented-connected Workforce Market, By End User, 2021-2029 (USD Billion)
137 Central and South America Augmented-connected Workforce Market, By Component, 2021-2029 (USD Billion)
138 Central and South America Augmented-connected Workforce Market, By Enterprise, 2021-2029 (USD Billion)
139 Central and South America Augmented-connected Workforce Market, By Deployment, 2021-2029 (USD Billion)
140 CENTRAL AND SOUTH AMERICA Augmented-connected Workforce Market, By End User, 2021-2029 (USD Billion)
141 Central and South America Augmented-connected Workforce Market, By Country, 2021-2029 (USD Billion)
142 Brazil Augmented-connected Workforce Market, By Component, 2021-2029 (USD Billion)
143 Brazil Augmented-connected Workforce Market, By Enterprise, 2021-2029 (USD Billion)
144 Brazil Augmented-connected Workforce Market, By Deployment, 2021-2029 (USD Billion)
145 brazil Augmented-connected Workforce Market, By End User, 2021-2029 (USD Billion)
146 Chile Augmented-connected Workforce Market, By Component, 2021-2029 (USD Billion)
147 Chile Augmented-connected Workforce Market, By Enterprise, 2021-2029 (USD Billion)
148 Chile Augmented-connected Workforce Market, By Deployment, 2021-2029 (USD Billion)
149 Chile Augmented-connected Workforce Market, By End User, 2021-2029 (USD Billion)
150 Argentina Augmented-connected Workforce Market, By Component, 2021-2029 (USD Billion)
151 Argentina Augmented-connected Workforce Market, By Enterprise, 2021-2029 (USD Billion)
152 Argentina Augmented-connected Workforce Market, By Deployment, 2021-2029 (USD Billion)
153 Argentina Augmented-connected Workforce Market, By End User, 2021-2029 (USD Billion)
154 REST OF CENTRAL AND SOUTH AMERICA Augmented-connected Workforce Market, By Component, 2021-2029 (USD Billion)
155 REST OF CENTRAL AND SOUTH AMERICA Augmented-connected Workforce Market, By Enterprise, 2021-2029 (USD Billion)
156 REST OF CENTRAL AND SOUTH AMERICA Augmented-connected Workforce Market, By Deployment, 2021-2029 (USD Billion)
157 REST OF CENTRAL AND SOUTH AMERICA Augmented-connected Workforce Market, By End User, 2021-2029 (USD Billion)
158 3M Company: Products & Services Offering
159 Accenture: Products & Services Offering
160 Avnet, Inc.: Products & Services Offering
161 Fujitsu Ltd.: Products & Services Offering
162 Honeywell International Inc.: Products & Services Offering
163 ORACLE CORP.: Products & Services Offering
164 Smart Track S.R.L : Products & Services Offering
165 Tata Consultancy Services: Products & Services Offering
166 TELUS, Inc: Products & Services Offering
167 Vandrico Solutions Inc: Products & Services Offering
168 Other Companies: Products & Services Offering
LIST OF FIGURES
1 Global Augmented-connected Workforce Market Overview
2 Global Augmented-connected Workforce Market Value From 2021-2029 (USD Billion)
3 Global Augmented-connected Workforce Market Share, By Component (2023)
4 Global Augmented-connected Workforce Market Share, By Enterprise (2023)
5 Global Augmented-connected Workforce Market Share, By Deployment (2023)
6 Global Augmented-connected Workforce Market Share, By End User (2023)
7 Global Augmented-connected Workforce Market, By Region (Asia Pacific Market)
8 Technological Trends In Global Augmented-connected Workforce Market
9 Four Quadrant Competitor Positioning Matrix
10 Impact Of Macro & Micro Indicators On The Market
11 Impact Of Key Drivers On The Global Augmented-connected Workforce Market
12 Impact Of Challenges On The Global Augmented-connected Workforce Market
13 Porter’s Five Forces Analysis
14 Global Augmented-connected Workforce Market: By Component Scope Key Takeaways
15 Global Augmented-connected Workforce Market, By Component Segment: Revenue Growth Analysis
16 Software Market, By Region, 2021-2029 (USD Billion)
17 Hardware Market, By Region, 2021-2029 (USD Billion)
18 Services Market, By Region, 2021-2029 (USD Billion)
19 Global Augmented-connected Workforce Market: By Enterprise Scope Key Takeaways
20 Global Augmented-connected Workforce Market, By Enterprise Segment: Revenue Growth Analysis
21 SME Market, By Region, 2021-2029 (USD Billion)
22 Large Enterprise Market, By Region, 2021-2029 (USD Billion)
23 Global Augmented-connected Workforce Market: By Deployment Scope Key Takeaways
24 Global Augmented-connected Workforce Market, By Deployment Segment: Revenue Growth Analysis
25 On-premise Market, By Region, 2021-2029 (USD Billion)
26 Cloud Market, By Region, 2021-2029 (USD Billion)
27 Global Augmented-connected Workforce Market: By End User Scope Key Takeaways
28 Global Augmented-connected Workforce Market, By End User Segment: Revenue Growth Analysis
29 Manufacturing Market, By Region, 2021-2029 (USD Billion)
30 Healthcare Market, By Region, 2021-2029 (USD Billion)
31 Construction Market, By Region, 2021-2029 (USD Billion)
32 Mining Market, By Region, 2021-2029 (USD Billion)
33 Oil & Gas Market, By Region, 2021-2029 (USD Billion)
34 Regional Segment: Revenue Growth Analysis
35 Global Augmented-connected Workforce Market: Regional Analysis
36 North America Augmented-connected Workforce Market Overview
37 North America Augmented-connected Workforce Market, By Component
38 North America Augmented-connected Workforce Market, By Enterprise
39 North America Augmented-connected Workforce Market, By Deployment
40 North America Augmented-connected Workforce Market, By End User
41 North America Augmented-connected Workforce Market, By Country
42 U.S. Augmented-connected Workforce Market, By Component
43 U.S. Augmented-connected Workforce Market, By Enterprise
44 U.S. Augmented-connected Workforce Market, By Deployment
45 U.S. Augmented-connected Workforce Market, By End User
46 Canada Augmented-connected Workforce Market, By Component
47 Canada Augmented-connected Workforce Market, By Enterprise
48 Canada Augmented-connected Workforce Market, By Deployment
49 Canada Augmented-connected Workforce Market, By End User
50 Mexico Augmented-connected Workforce Market, By Component
51 Mexico Augmented-connected Workforce Market, By Enterprise
52 Mexico Augmented-connected Workforce Market, By Deployment
53 Mexico Augmented-connected Workforce Market, By End User
54 Four Quadrant Positioning Matrix
55 Company Market Share Analysis
56 3M Company: Company Snapshot
57 3M Company: SWOT Analysis
58 3M Company: Geographic Presence
59 Accenture: Company Snapshot
60 Accenture: SWOT Analysis
61 Accenture: Geographic Presence
62 Avnet, Inc.: Company Snapshot
63 Avnet, Inc.: SWOT Analysis
64 Avnet, Inc.: Geographic Presence
65 Fujitsu Ltd.: Company Snapshot
66 Fujitsu Ltd.: Swot Analysis
67 Fujitsu Ltd.: Geographic Presence
68 Honeywell International Inc.: Company Snapshot
69 Honeywell International Inc.: SWOT Analysis
70 Honeywell International Inc.: Geographic Presence
71 ORACLE CORP.: Company Snapshot
72 ORACLE CORP.: SWOT Analysis
73 ORACLE CORP.: Geographic Presence
74 Smart Track S.R.L : Company Snapshot
75 Smart Track S.R.L : SWOT Analysis
76 Smart Track S.R.L : Geographic Presence
77 Tata Consultancy Services: Company Snapshot
78 Tata Consultancy Services: SWOT Analysis
79 Tata Consultancy Services: Geographic Presence
80 TELUS, Inc.: Company Snapshot
81 TELUS, Inc.: SWOT Analysis
82 TELUS, Inc.: Geographic Presence
83 Vandrico Solutions Inc: Company Snapshot
84 Vandrico Solutions Inc: SWOT Analysis
85 Vandrico Solutions Inc: Geographic Presence
86 Other Companies: Company Snapshot
87 Other Companies: SWOT Analysis
88 Other Companies: Geographic Presence
The Global Augmented-connected Workforce Market has been studied from the year 2019 till 2029. However, the CAGR provided in the report is from the year 2024 to 2029. The research methodology involved three stages: Desk research, Primary research, and Analysis & Output from the entire research process.

The desk research involved a robust background study which meant referring to paid and unpaid databases to understand the market dynamics; mapping contracts from press releases; identifying the key players in the market, studying their product portfolio, competition level, annual reports/SEC filings & investor presentations; and learning the demand and supply-side analysis for the Augmented-connected Workforce Market.

The primary research activity included telephonic conversations with more than 50 tier 1 industry consultants, distributors, and end-use product manufacturers.

Finally, based on the above thorough research process, an in-depth analysis was carried out considering the following aspects: market attractiveness, current & future market trends, market share analysis, SWOT analysis of the company and customer analytics.

Frequently Asked Questions

This FREE sample includes market data points, ranging from trend analyses to market estimates & forecasts. See for yourself.
Or view our licence options:
Tailor made solutions just for you
80% of our clients seek made-to-order reports. How do you want us to tailor yours?
OUR CLIENTS


