This report was recently updated on August 20 2025 with the latest and most recent
market numbers
Global Automated Cell Imaging System Market Size, Trends & Analysis - Forecasts to 2027 By Methodology (Time Lapse, Colocalization), By Application (Live Cell Vivo Imaging, Screening), By End-Users (Hospitals, Diagnostic Laboratories), By Region (North America, Asia Pacific, Central & South America, Europe, and the Middle East & Africa), End-User Landscape Analysis, Company Market Share Analysis, and Competitor Analysis
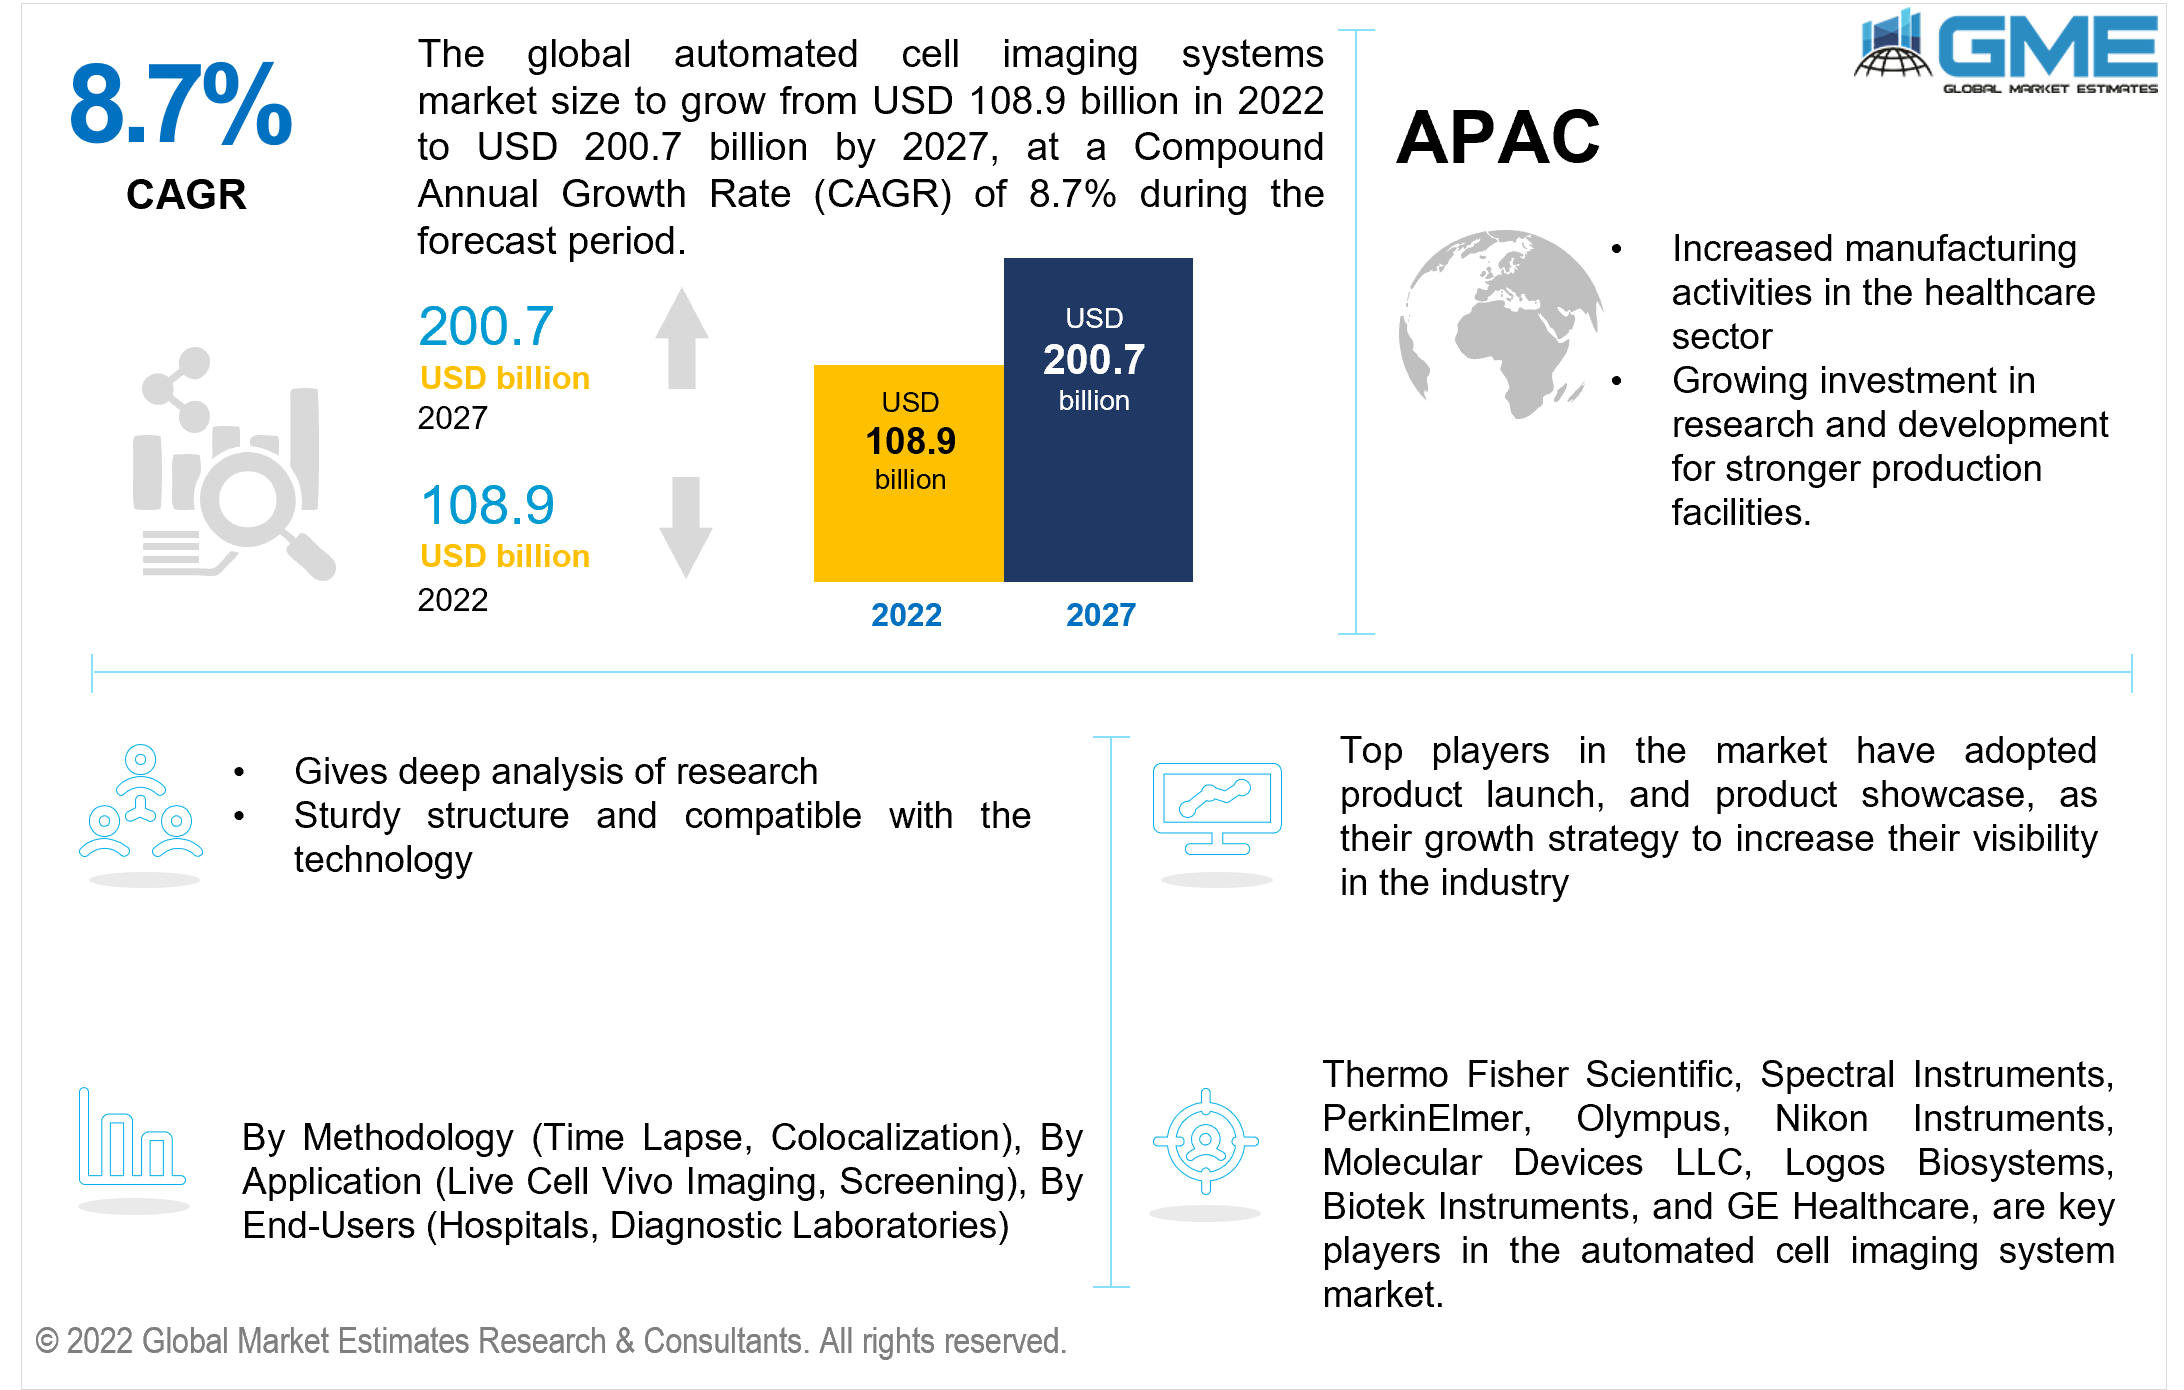
The Global Automated Cell Imaging System Market is projected to grow from USD 108.9 billion in 2022 to USD 200.7 billion in 2027 at a CAGR of 8.7%.
An automated cell imaging system can be defined as an examination of live cells. Cell imaging is a process done by researchers and scientists via a microscope to understand functions in the body via molecular dynamics. To understand live imaging better, various research projects are underway. The growing investment in cell imaging system research ad development by major corporations is expected to have a positive impact on the automated cell imaging system market.
The major drivers in the automated cell imaging system are its use in making drugs and medical therapies for several life-threatening diseases such as cancer. An automated cell imaging system gives deep analysis for better diagnosis. These diagnostic tests are important in combating the rising cases of cancer. Automated cell imaging uses the time-lapse microscopy method which helps monitor live cells over a specified duration.
The major market restraints in the global automated cell imaging system market are the rise in the prices of tests and other hospital costs.
The COVID-19 pandemic impacted the global automated cell imaging system market significantly. With the spread of diseases since the pandemic, the growth rate for global automated cell imaging systems has seen a significant market share. The imaging system market size has grown rapidly and the healthcare sector heavily depends on live-cell testing for better and enhanced results. The growing demand for the automated cell imaging system market will boost the market's revenue between 2022 and 2027.
The war between Russia and Ukraine had a substantial impact on the global automated cell imaging system market. Ukraine and Russia are facing production delays, a rise in transportation costs, and low sales due to the ongoing war. This has also affected the other regions in Europe. Many countries trade with Russia and they are facing stockpiling and low demand due to increased prices. Europe is one of the significant exporters of automated cell imaging systems. Healthcare facilities are being heavily burdened and restrictions on trade imposed by Russia on Ukraine are restraining the consumption of consumables in the country. With production delays, many regions in Europe and the world are facing supply shortages. This impacts the political relations in the international market. Many companies are shutting down their business in Russia temporarily and this affects their other production plants as they have increased pressure of producing goods.
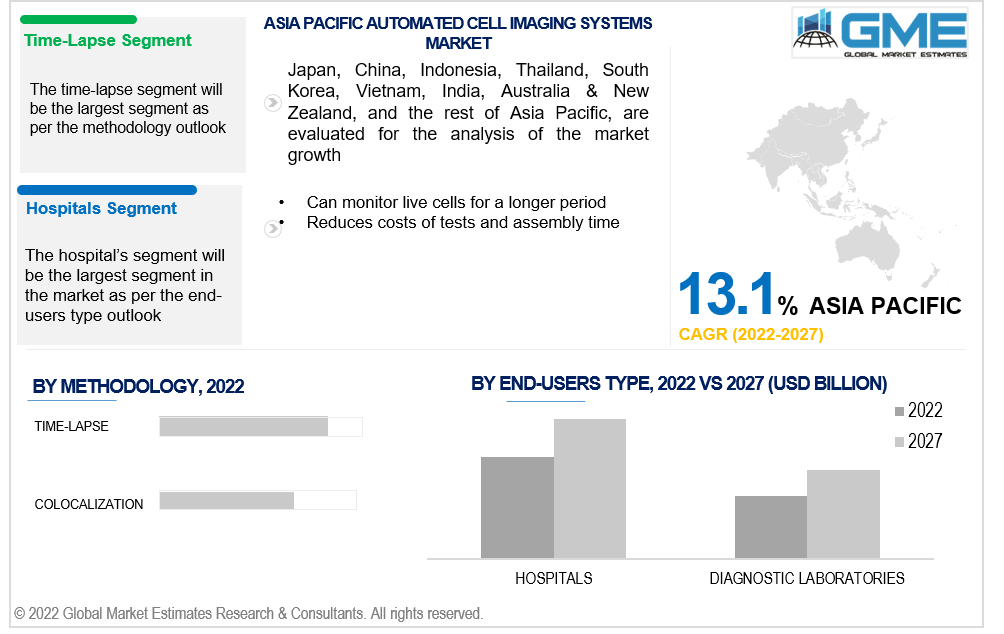
The time-lapse type segment is expected to witness the largest share in the global automated cell imaging system market during the forecast period of 2022-2027. The time-lapse technique helps in capturing images over a period of time which gives better diagnostics. Time-lapse imaging is extremely useful in the process of IVF fertilization to monitor embryos over a period of time. Furthermore, it is reliable and gives detailed information. Hence, considering these advantages the time-lapse segment is expected to witness the largest share.
The colocalization type segment is expected to grow the fastest during 2022-2027. To understand cellular functions, molecular devices are extremely important. Colocalization is a process that uses quantitative tools such as fluorescence technology. This helps understand the detailed function of a cell and compares it with ongoing treatments.
The live-cell vivo imaging segment is expected to witness the largest share in the global automated cell imaging system market during the forecast period of 2022-2027. The major driver of live-cell vivo imaging is the structural and detailed information obtained by it. The whole process saves time because many results are obtained in a single test. This saves the cost of production and is also less time-consuming as it accelerates the process of drug development.
The screening segment is expected to grow the fastest during 2022-2027. Automated cell imaging system has evolved over the years. Screening systems use high technology for better results. They are less expensive than other products which drive the market during the forecast period.
The hospital’s segment is expected to witness the largest share in the global automated cell imaging system market during the forecast period of 2022-2027. Hospitals need automated cell imagining systems for various tests in vast verticals like oncology, and general medicine. Cell imaging gives detailed information about the development of the disease and helps in the treatment plan. Hence, considering these advantages, the hospital segment is expected to witness the largest share.
The diagnostics laboratories segment is expected to grow the fastest during 2022-2027. Diagnostic laboratories help in identifying stem cell research, cancer cell therapies, and also many other clinical trials. During the ongoing pandemic, diagnostic laboratories saw an increased demand for testing the virus. These reasons drive the market during the forecast period.
The North America segment is expected to witness the largest share in the global automated cell imaging system market during the forecast period of 2022-2027. Due to the increase in cases of cancer and the need for better and sustainable treatment plans, the North America segment will dominate the global automated cell imaging system market.
An increase in the standard of living, and new technologies in the healthcare sector are a few reasons which drive the market in the United States. As one of the most developed nations in the world, the United States is a hub for complex medical treatments for many people around the world. The automated cell imaging system market industry in the United States has been substantially strong for a few years and due to the increasing demand for consumers in the automotive hub, it is estimated to grow further during the forecast period. Latin America is one of the prime bases for many foreign companies which invest in the country for better opportunities and to expand the market.
Asia-Pacific is expected to grow the fastest during 2022-2027. The Asia-Pacific region has been developing huge infrastructure for the healthcare sector. Furthermore, it has been rising technology and other advancements in the field of medical innovation. This boosts the global automated cell imaging system market.
The markets in India, China, and South Korea are developing new technologies in several medical fields. Life sciences are one of the top research wings in these countries with high-tech diagnostic centers. Hence, considering these advantages the global automated cell imaging system market is expected to grow.
Europe accounts for a significant market share as it is one of the largest medical device industries. Countries like Germany, France, and the UK are the prime exporters in the healthcare sector. There is also substantial growth due to investments in research and development, increased industrial activities, and businesses that are expanding in the global economy. This competitive landscape helps in the growth rate of the global automated cell imaging system market.
Thermo Fisher Scientific, Spectral Instruments, PerkinElmer, Olympus, Nikon Instruments, Molecular Devices LLC, Logos Biosystems, Biotek Instruments, and GE Healthcare, among others, are the key players in the automated cell imaging system market.
Please note: This is not an exhaustive list of companies profiled in the report.
The global automated cell imaging system market has observed several strategic alliances between company profiles to launch new products with added functionalities and maintain revenue share & profitability. Organic and inorganic growth strategies adopted by small players have been the highlight of this market.
Chapter 1 Research Methodology
1.1 Research Assumptions
1.2 Research Methodology
1.2.1 Estimates and Forecast Timeline
1.3 Information Procurement
1.3.1 Purchased Database
1.3.2 GME’s Internal Database
1.3.3 Primary Research
1.3.4 Secondary Sources & Third-Party Perspectives
1.3.4.1 Company Information Sources
1.3.4.2 Secondary Data Sources
1.4 Information or Data Analysis
1.4.1 Data Analysis Models
1.5 Market Formulation & Data Visualization
1.6 Data Validation & Publishing
1.7 Market Model
1.7.1 Model Details
1.7.1.1 Top-Down Approach
1.7.1.2 Bottom-Up Approach
1.8 Market Segmentation & Scope
1.9 Market Definition
Chapter 2 Executive Summary
2.1 Global Market Outlook
2.2 By Methodology Outlook
2.3 By End-Users Type Outlook
2.4 Application Outlook
2.5 Regional Outlook
Chapter 3 Global Automated Cell Imaging System Market Trend Analysis
3.1. Market Introduction
3.2 Penetration & Growth Prospect Mapping
3.3 Impact of COVID-19 on the Automated Cell Imaging System Market
3.4 Metric Data based on the industry
3.5 Market Dynamic Analysis
3.5.1 Market Driver Analysis
3.5.2 Market Restraint Analysis
3.5.3 Industry Challenges
3.5.4 Industry Opportunities
3.6 Porter’s Five Analysis
3.6.1 Supplier Power
3.6.2 Buyer Power
3.6.3 Substitution Threat
3.6.4 Threat from New Entrant
3.7 Market Entry Strategies
Chapter 4 Automated Cell Imaging System Market: By Methodology Trend Analysis
4.1 By Methodology: Historic Data vs. Forecast Data Analysis, 2021 vs. 2027
4.2 Time-Lapse
4.2.1 Market Estimates & Forecast Analysis of Time-Lapse Segment, By Region, 2019-2027 (USD Billion)
4.3 Colocalization
4.3.1 Market Estimates & Forecast Analysis of Colocalization Segment, By Region, 2019-2027 (USD Billion)
Chapter 5 Automated Cell Imaging System Market: By Application Trend Analysis
5.1 By Application: Historic Data vs. Forecast Data Analysis, 2021 vs. 2027
5.2 Live Cell Vivo Imaging
5.2.1 Market Estimates & Forecast Analysis of Live Cell Vivo Imaging, By Region, 2019-2027 (USD Billion)
5.3 Screening
5.3.1 Market Estimates & Forecast Analysis of Screening Market Segment, By Region, 2019-2027 (USD Billion)
Chapter 6 Automated Cell Imaging System Market: By End-Users Type Trend Analysis
6.1 By End-Users Type: Historic Data vs. Forecast Data Analysis, 2022 vs. 2027
6.2 Hospitals
6.2.1 Market Estimates & Forecast Analysis of Hospitals Segment, By Region, 2019-2027 (USD Billion)
6.3 Diagnostic Laboratories
6.3.1 Market Estimates & Forecast Analysis of Diagnostic Laboratories Segment, By Region, 2019-2027 (USD Billion)
Chapter 7 Automated Cell Imaging System Market, By Region
7.1 Regional Outlook
7.2 North America
7.2.1 Market Estimates & Forecast Analysis, By Country 2019-2027 (USD Billion)
7.2.2 Market Estimates & Forecast Analysis, By Methodology, 2019-2027 (USD Billion)
7.2.3 Market Estimates & Forecast Analysis, By Application, 2019-2027 (USD Billion)
7.2.4 Market Estimates & Forecast Analysis, By End-Users Type, 2019-2027 (USD Billion)
7.2.5 U.S.
7.2.5.1 Market Estimates & Forecast Analysis, By Methodology, 2019-2027 (USD Billion)
7.2.5.2 Market Estimates & Forecast Analysis, By Application, 2019-2027 (USD Billion)
7.2.5.3 Market Estimates & Forecast Analysis, By End-Users Type, 2019-2027 (USD Billion)
7.2.6 Canada
7.2.6.1 Market Estimates & Forecast Analysis, By Methodology, 2019-2027 (USD Billion)
7.2.6.2 Market Estimates & Forecast Analysis, By Application, 2019-2027 (USD Billion)
7.2.6.3 Market Estimates & Forecast Analysis, By End-Users Type, 2019-2027 (USD Billion)
7.5.7 Mexico
7.5.5.1 Market Estimates & Forecast Analysis, By Methodology, 2019-2027 (USD Billion)
7.5.5.2 Market Estimates & Forecast Analysis, By Application, 2019-2027 (USD Billion)
7.5.5.3 Market Estimates & Forecast Analysis, By End-Users Type, 2019-2027 (USD Billion)
7.3 Europe
7.3.1 Market Estimates & Forecast Analysis, By Country 2019-2027 (USD Billion)
7.3.2 Market Estimates & Forecast Analysis, By Methodology, 2019-2027 (USD Billion)
7.3.3 Market Estimates & Forecast Analysis, By Application, 2019-2027 (USD Billion)
7.3.4 Market Estimates & Forecast Analysis, By End-Users Type, 2019-2027 (USD Billion)
7.3.5 Germany
7.3.5.1 Market Estimates & Forecast Analysis, By Methodology, 2019-2027 (USD Billion)
7.3.5.2 Market Estimates & Forecast Analysis, By Application, 2019-2027 (USD Billion)
7.3.5.3 Market Estimates & Forecast Analysis, By End-Users Type, 2019-2027 (USD Billion)
7.3.6 UK
7.3.6.1 Market Estimates & Forecast Analysis, By Methodology, 2019-2027 (USD Billion)
7.3.6.2 Market Estimates & Forecast Analysis, By Application, 2019-2027 (USD Billion)
7.3.6.3 Market Estimates & Forecast Analysis, By End-Users Type, 2019-2027 (USD Billion)
7.3.7 France
7.3.7.1 Market Estimates & Forecast Analysis, By Methodology, 2019-2027 (USD Billion)
7.3.7.2 Market Estimates & Forecast Analysis, By Application, 2019-2027 (USD Billion)
7.3.7.3 Market Estimates & Forecast Analysis, By End-Users Type, 2019-2027 (USD Billion)
7.3.8 Russia
7.3.8.1 Market Estimates & Forecast Analysis, By Methodology, 2019-2027 (USD Billion)
7.3.8.2 Market Estimates & Forecast Analysis, By Application, 2019-2027 (USD Billion)
7.3.8.3 Market Estimates & Forecast Analysis, By End-Users Type, 2019-2027 (USD Billion)
7.3.9 Italy
7.3.9.1 Market Estimates & Forecast Analysis, By Methodology, 2019-2027 (USD Billion)
7.3.9.2 Market Estimates & Forecast Analysis, By Application, 2019-2027 (USD Billion)
7.3.9.3 Market Estimates & Forecast Analysis, By End-Users Type, 2019-2027 (USD Billion)
7.3.10 Spain
7.3.10.1 Market Estimates & Forecast Analysis, By Methodology, 2019-2027 (USD Billion)
7.3.10.2 Market Estimates & Forecast Analysis, By Application, 2019-2027 (USD Billion)
7.3.10.3 Market Estimates & Forecast Analysis, By End-Users Type, 2019-2027 (USD Billion)
7.3.11 Rest of Europe
7.3.11.1 Market Estimates & Forecast Analysis, By Methodology, 2019-2027 (USD Billion)
7.3.11.2 Market Estimates & Forecast Analysis, By Application, 2019-2027 (USD Billion)
7.3.11.3 Market Estimates & Forecast Analysis, By End-Users Type, 2019-2027 (USD Billion)
7.4 Asia Pacific
7.4.1 Market Estimates & Forecast Analysis, By Country 2019-2027 (USD Billion)
7.4.2 Market Estimates & Forecast Analysis, By Methodology, 2019-2027 (USD Billion)
7.4.3 Market Estimates & Forecast Analysis, By Application, 2019-2027 (USD Billion)
7.4.4 Market Estimates & Forecast Analysis, By End-Users Type, 2019-2027 (USD Billion)
7.4.5 China
7.4.5.1 Market Estimates & Forecast Analysis, By Methodology, 2019-2027 (USD Billion)
7.4.5.2 Market Estimates & Forecast Analysis, By Application, 2019-2027 (USD Billion)
7.4.5.3 Market Estimates & Forecast Analysis, By End-Users Type, 2019-2027 (USD Billion)
7.4.6 India
7.4.6.1 Market Estimates & Forecast Analysis, By Methodology, 2019-2027 (USD Billion)
7.4.6.2 Market Estimates & Forecast Analysis, By Application, 2019-2027 (USD Billion)
7.4.6.3 Market Estimates & Forecast Analysis, By End-Users Type, 2019-2027 (USD Billion)
7.4.7 Japan
7.4.7.1 Market Estimates & Forecast Analysis, By Methodology, 2019-2027 (USD Billion)
7.4.7.2 Market Estimates & Forecast Analysis, By Application, 2019-2027 (USD Billion)
7.4.7.3 Market Estimates & Forecast Analysis, By End-Users Type, 2019-2027 (USD Billion)
7.4.8 Australia
7.4.8.1 Market Estimates & Forecast Analysis, By Methodology, 2019-2027 (USD Billion)
7.4.8.2 Market Estimates & Forecast Analysis, By Application, 2019-2027 (USD Billion)
7.4.8.3 Market Estimates & Forecast Analysis, By End-Users Type, 2019-2027 (USD Billion)
7.4.9 South Korea
7.4.9.1 Market Estimates & Forecast Analysis, By Methodology, 2019-2027 (USD Billion)
7.4.9.2 Market Estimates & Forecast Analysis, By Application, 2019-2027 (USD Billion)
7.4.9.3 Market Estimates & Forecast Analysis, By End-Users Type, 2019-2027 (USD Billion)
7.3.10 Rest of Asia Pacific
7.3.10.1 Market Estimates & Forecast Analysis, By Methodology, 2019-2027 (USD Billion)
7.3.10.2 Market Estimates & Forecast Analysis, By Application, 2019-2027 (USD Billion)
7.3.10.3 Market Estimates & Forecast Analysis, By End-Users Type, 2019-2027 (USD Billion)
7.5 Central & South America
7.5.1 Market Estimates & Forecast Analysis, By Country 2019-2027 (USD Billion)
7.5.2 Market Estimates & Forecast Analysis, By Methodology, 2019-2027 (USD Billion)
7.5.3 Market Estimates & Forecast Analysis, By Application, 2019-2027 (USD Billion)
7.5.4 Market Estimates & Forecast Analysis, By End-Users Type, 2019-2027 (USD Billion)
7.5.5 Brazil
7.5.5.1 Market Estimates & Forecast Analysis, By Methodology, 2019-2027 (USD Billion)
7.5.5.2 Market Estimates & Forecast Analysis, By Application, 2019-2027 (USD Billion)
7.5.5.3 Market Estimates & Forecast Analysis, By End-Users Type, 2019-2027 (USD Billion)
7.5.6 Rest of Central & South America
7.5.6.1 Market Estimates & Forecast Analysis, By Methodology, 2019-2027 (USD Billion)
7.5.6.2 Market Estimates & Forecast Analysis, By Application, 2019-2027 (USD Billion)
7.5.6.3 Market Estimates & Forecast Analysis, By End-Users Type, 2019-2027 (USD Billion)
7.6 Middle East & Africa
7.6.1 Market Estimates & Forecast Analysis, By Country 2019-2027 (USD Billion)
7.6.2 Market Estimates & Forecast Analysis, By Methodology, 2019-2027 (USD Billion)
7.6.3 Market Estimates & Forecast Analysis, By Application, 2019-2027 (USD Billion)
7.6.4 Market Estimates & Forecast Analysis, By End-Users Type, 2019-2027 (USD Billion)
7.6.5 Saudi Arabia
7.6.5.1 Market Estimates & Forecast Analysis, By Methodology, 2019-2027 (USD Billion)
7.6.5.2 Market Estimates & Forecast Analysis, By Application, 2019-2027 (USD Billion)
7.6.5.3 Market Estimates & Forecast Analysis, By End-Users Type, 2019-2027 (USD Billion)
7.6.6 United Arab Emirates
7.6.6.1 Market Estimates & Forecast Analysis, By Methodology, 2019-2027 (USD Billion)
7.6.6.2 Market Estimates & Forecast Analysis, By Application, 2019-2027 (USD Billion)
7.6.6.3 Market Estimates & Forecast Analysis, By End-Users Type, 2019-2027 (USD Billion)
7.6.7 South Africa
7.6.7.1 Market Estimates & Forecast Analysis, By Methodology, 2019-2027 (USD Billion)
7.6.7.2 Market Estimates & Forecast Analysis, By Application, 2019-2027 (USD Billion)
7.6.7.3 Market Estimates & Forecast Analysis, By End-Users Type, 2019-2027 (USD Billion)
7.5.8 Rest of Middle East & Africa
7.5.8.1 Market Estimates & Forecast Analysis, By Methodology, 2019-2027 (USD Billion)
7.5.8.2 Market Estimates & Forecast Analysis, By Application, 2019-2027 (USD Billion)
7.5.8.3 Market Estimates & Forecast Analysis, By End-Users Type, 2019-2027 (USD Billion)
Chapter 8 Competitive Analysis
8.1 Key Global Players, Recent Developments & their Impact on the Industry
8.2 Four Quadrant Competitor Positioning Matrix
8.2.1 Key Innovators
8.2.2 Market Leaders
8.2.3 Emerging Players
8.2.4 Market Challengers
8.3 Vendor Landscape Analysis
8.4 End-User Landscape Analysis
8.5 Company Market Share Analysis, 2021
Chapter 9 Company Profile Analysis
9.1 Thermo Fisher Scientific
9.1.1 Company Overview
9.1.2 Financial Analysis
9.1.3 Strategic Initiatives
9.1.4 Product Benchmarking
9.2 Spectral Instruments
9.2.1 Company Overview
9.2.2 Financial Analysis
9.2.3 Strategic Initiatives
9.2.4 Product Benchmarking
9.3 PerkinElmer
9.3.1 Company Overview
9.3.2 Financial Analysis
9.3.3 Strategic Initiatives
9.3.4 Product Benchmarking
9.4 Olympus
9.4.1 Company Overview
9.4.2 Financial Analysis
9.4.3 Strategic Initiatives
9.4.4 Product Benchmarking
9.5 Nikon Instruments
9.5.1 Company Overview
9.5.2 Financial Analysis
9.5.3 Strategic Initiatives
9.5.4 Product Benchmarking
9.6 Molecular Devices LLC
9.6.1 Company Overview
9.6.2 Financial Analysis
9.6.3 Strategic Initiatives
9.6.4 Product Benchmarking
9.7 Logos Biosystems
9.7.1 Company Overview
9.7.2 Financial Analysis
9.7.3 Strategic Initiatives
9.7.4 Product Benchmarking
9.8 Biotek Instruments
9.8.1 Company Overview
9.8.2 Financial Analysis
9.8.3 Strategic Initiatives
9.8.4 Product Benchmarking
9.9 GE Healthcare
9.9.1 Company Overview
9.9.2 Financial Analysis
9.9.3 Strategic Initiatives
9.9.4 Product Benchmarking
9.10 Other Companies
9.10.1 Company Overview
9.10.2 Financial Analysis
9.10.3 Strategic Initiatives
9.10.4 Product Benchmarking
List of Tables
1 Technological Advancements in Automated Cell Imaging System Market
2 Global Automated Cell Imaging System Market: Key Market Drivers
3 Global Automated Cell Imaging System Market: Key Market Challenges
4 Global Automated Cell Imaging System Market: Key Market Opportunities
5 Global Automated Cell Imaging System Market: Key Market Restraints
6 Global Automated Cell Imaging System Market Estimates & Forecast Analysis, 2019-2027 (USD Billion)
7 Global Automated Cell Imaging System Market, By Methodology, 2019-2027 (USD Billion)
8 Time-Lapse: Global Automated Cell Imaging System Market, By Region, 2019-2027 (USD Billion)
9 Colocalization: Global Automated Cell Imaging System Market, By Region, 2019-2027 (USD Billion)
10 Global Automated Cell Imaging System Market, By Application, 2019-2027 (USD Billion)
11 Live Cell Vivo Imaging: Global Automated Cell Imaging System Market, By Region, 2019-2027 (USD Billion)
12 Screening: Global Automated Cell Imaging System Market, By Region, 2019-2027 (USD Billion)
13 Global Automated Cell Imaging System Market, By End-Users Type, 2019-2027 (USD Billion)
14 Hospitals: Global Automated Cell Imaging System Market, By Region, 2019-2027 (USD Billion)
15 Diagnostic Laboratories: Global Automated Cell Imaging System Market, By Region, 2019-2027 (USD Billion)
16 Regional Analysis: Global Automated Cell Imaging System Market, By Region, 2019-2027 (USD Billion)
17 North America: Automated Cell Imaging System Market, By Methodology, 2019-2027 (USD Billion)
18 North America: Automated Cell Imaging System Market, By Application, 2019-2027 (USD Billion)
19 North America: Automated Cell Imaging System Market, By End-Users Type, 2019-2027 (USD Billion)
20 North America: Automated Cell Imaging System Market, By Country, 2019-2027 (USD Billion)
21 U.S: Automated Cell Imaging System Market, By Methodology, 2019-2027 (USD Billion)
22 U.S: Automated Cell Imaging System Market, By Application, 2019-2027 (USD Billion)
23 U.S: Automated Cell Imaging System Market, By End-Users Type, 2019-2027 (USD Billion)
24 Canada: Automated Cell Imaging System Market, By Methodology, 2019-2027 (USD Billion)
25 Canada: Automated Cell Imaging System Market, By Application, 2019-2027 (USD Billion)
26 Canada: Automated Cell Imaging System Market, By End-Users Type, 2019-2027 (USD Billion)
27 Mexico: Automated Cell Imaging System Market, By Methodology, 2019-2027 (USD Billion)
28 Mexico: Automated Cell Imaging System Market, By Application, 2019-2027 (USD Billion)
29 Mexico: Automated Cell Imaging System Market, By End-Users Type, 2019-2027 (USD Billion)
30 Europe: Automated Cell Imaging System Market, By Methodology, 2019-2027 (USD Billion)
31 Europe: Automated Cell Imaging System Market, By Application, 2019-2027 (USD Billion)
32 Europe: Automated Cell Imaging System Market, By End-Users Type, 2019-2027 (USD Billion)
33 Europe: Automated Cell Imaging System Market, By Country, 2019-2027 (USD Billion)
34 Germany: Automated Cell Imaging System Market, By Methodology, 2019-2027 (USD Billion)
35 Germany: Automated Cell Imaging System Market, By Application, 2019-2027 (USD Billion)
36 Germany: Automated Cell Imaging System Market, By End-Users Type, 2019-2027 (USD Billion)
37 UK: Automated Cell Imaging System Market, By Methodology, 2019-2027 (USD Billion)
38 UK: Automated Cell Imaging System Market, By Application, 2019-2027 (USD Billion)
39 UK: Automated Cell Imaging System Market, By End-Users Type, 2019-2027 (USD Billion)
40 France: Automated Cell Imaging System Market, By Methodology, 2019-2027 (USD Billion)
41 France: Automated Cell Imaging System Market, By Application, 2019-2027 (USD Billion)
42 France: Automated Cell Imaging System Market, By End-Users Type, 2019-2027 (USD Billion)
43 Italy: Automated Cell Imaging System Market, By Methodology, 2019-2027 (USD Billion)
44 Italy: Automated Cell Imaging System Market, By Application, 2019-2027 (USD Billion)
45 Italy: Automated Cell Imaging System Market, By End-Users Type, 2019-2027 (USD Billion)
46 Spain: Automated Cell Imaging System Market, By Methodology, 2019-2027 (USD Billion)
47 Spain: Automated Cell Imaging System Market, By Application, 2019-2027 (USD Billion)
48 Spain: Automated Cell Imaging System Market, By End-Users Type, 2019-2027 (USD Billion)
49 Rest Of Europe: Automated Cell Imaging System Market, By Methodology, 2019-2027 (USD Billion)
50 Rest Of Europe: Automated Cell Imaging System Market, By Application, 2019-2027 (USD Billion)
51 Rest Of Europe: Automated Cell Imaging System Market, By End-Users Type, 2019-2027 (USD Billion)
52 Asia Pacific: Automated Cell Imaging System Market, By Methodology, 2019-2027 (USD Billion)
53 Asia Pacific: Automated Cell Imaging System Market, By Application, 2019-2027 (USD Billion)
54 Asia Pacific: Automated Cell Imaging System Market, By End-Users Type, 2019-2027 (USD Billion)
55 Asia Pacific: Automated Cell Imaging System Market, By Country, 2019-2027 (USD Billion)
56 China: Automated Cell Imaging System Market, By Methodology, 2019-2027 (USD Billion)
57 China: Automated Cell Imaging System Market, By Application, 2019-2027 (USD Billion)
58 China: Automated Cell Imaging System Market, By End-Users Type, 2019-2027 (USD Billion)
59 India: Automated Cell Imaging System Market, By Methodology, 2019-2027 (USD Billion)
60 India: Automated Cell Imaging System Market, By Application, 2019-2027 (USD Billion)
61 India: Automated Cell Imaging System Market, By End-Users Type, 2019-2027 (USD Billion)
62 Japan: Automated Cell Imaging System Market, By Methodology, 2019-2027 (USD Billion)
63 Japan: Automated Cell Imaging System Market, By Application, 2019-2027 (USD Billion)
64 Japan: Automated Cell Imaging System Market, By End-Users Type, 2019-2027 (USD Billion)
65 South Korea: Automated Cell Imaging System Market, By Methodology, 2019-2027 (USD Billion)
66 South Korea: Automated Cell Imaging System Market, By Application, 2019-2027 (USD Billion)
67 South Korea: Automated Cell Imaging System Market, By End-Users Type, 2019-2027 (USD Billion)
68 Middle East & Africa: Automated Cell Imaging System Market, By Methodology, 2019-2027 (USD Billion)
69 Middle East & Africa: Automated Cell Imaging System Market, By Application, 2019-2027 (USD Billion)
70 Middle East & Africa: Automated Cell Imaging System Market, By End-Users Type, 2019-2027 (USD Billion)
71 Middle East & Africa: Automated Cell Imaging System Market, By Country, 2019-2027 (USD Billion)
72 Saudi Arabia: Automated Cell Imaging System Market, By Methodology, 2019-2027 (USD Billion)
73 Saudi Arabia: Automated Cell Imaging System Market, By Application, 2019-2027 (USD Billion)
74 Saudi Arabia: Automated Cell Imaging System Market, By End-Users Type, 2019-2027 (USD Billion)
75 UAE: Automated Cell Imaging System Market, By Methodology, 2019-2027 (USD Billion)
76 UAE: Automated Cell Imaging System Market, By Application, 2019-2027 (USD Billion)
77 UAE: Automated Cell Imaging System Market, By End-Users Type, 2019-2027 (USD Billion)
78 Central & South America: Automated Cell Imaging System Market, By Methodology, 2019-2027 (USD Billion)
79 Central & South America: Automated Cell Imaging System Market, By Application, 2019-2027 (USD Billion)
80 Central & South America: Automated Cell Imaging System Market, By End-Users Type, 2019-2027 (USD Billion)
81 Central & South America: Automated Cell Imaging System Market, By Country, 2019-2027 (USD Billion)
82 Brazil: Automated Cell Imaging System Market, By Methodology, 2019-2027 (USD Billion)
83 Brazil: Automated Cell Imaging System Market, By Application, 2019-2027 (USD Billion)
84 Brazil: Automated Cell Imaging System Market, By End-Users Type, 2019-2027 (USD Billion)
85 Thermo Fisher Scientific: By Types Offered
86 Spectral Instruments: By Types Offered
87 PerkinElmer: By Types Offered
88 Olympus: By Types Offered
89 Nikon Instruments: By Types Offered
90 Molecular Devices LLC: By Types Offered
91 GE Healthcare: By Types Offered
92 Logos Biosystems: By Types Offered
93 Biotek Instruments: By Types Offered
94 Other Companies: By Types Offered
List of Figures
1. Global Automated Cell Imaging System Market Segmentation & Research Scope
2. Primary Research Partners and Local Informers
3. Primary Research Process
4. Primary Research Approaches
5. Primary Research Responses
6. Global Automated Cell Imaging System Market: Penetration & Growth Prospect Mapping
7. Global Automated Cell Imaging System Market: Value Chain Analysis
8. Global Automated Cell Imaging System Market Drivers
9. Global Automated Cell Imaging System Market Restraints
10. Global Automated Cell Imaging System Market Opportunities
11. Global Automated Cell Imaging System Market Challenges
12. Key Automated Cell Imaging System Market Manufacturer Analysis
13. Global Automated Cell Imaging System Market: Porter’s Five Forces Analysis
14. PESTLE Analysis & Impact Analysis
15. Thermo Fisher Scientific: Company Snapshot
16. Thermo Fisher Scientific: SWOT Analysis
17. Spectral Instruments: Company Snapshot
18. Spectral Instruments: SWOT Analysis
19. PerkinElmer: Company Snapshot
20. PerkinElmer: SWOT Analysis
21. Olympus: Company Snapshot
22. Olympus: SWOT Analysis
23. Nikon Instruments: Company Snapshot
24. Nikon Instruments: SWOT Analysis
25. GE Healthcare: Company Snapshot
26. GE Healthcare: SWOT Analysis
27. Logos Biosystems: Company Snapshot
28. Logos Biosystems: SWOT Analysis
29. Biotek Instruments: Company Snapshot
30. Biotek Instruments: SWOT Analysis
31. Molecular Devices LLC: Company Snapshot
32. Molecular Devices LLC: SWOT Analysis
33. Other Companies: Company Snapshot
34. Other Companies: SWOT Analysis
The Global Automated Cell Imaging System Market has been studied from the year 2019 till 2027. However, the CAGR provided in the report is from the year 2022 to 2027. The research methodology involved three stages: Desk research, Primary research, and Analysis & Output from the entire research process.

The desk research involved a robust background study which meant referring to paid and unpaid databases to understand the market dynamics; mapping contracts from press releases; identifying the key players in the market, studying their product portfolio, competition level, annual reports/SEC filings & investor presentations; and learning the demand and supply-side analysis for the Automated Cell Imaging System Market.

The primary research activity included telephonic conversations with more than 50 tier 1 industry consultants, distributors, and end-use product manufacturers.

Finally, based on the above thorough research process, an in-depth analysis was carried out considering the following aspects: market attractiveness, current & future market trends, market share analysis, SWOT analysis of the company and customer analytics.

Frequently Asked Questions

This FREE sample includes market data points, ranging from trend analyses to market estimates & forecasts. See for yourself.
Or view our licence options:
Tailor made solutions just for you
80% of our clients seek made-to-order reports. How do you want us to tailor yours?
OUR CLIENTS


