This report was recently updated on June 10 2025 with the latest and most recent
market numbers
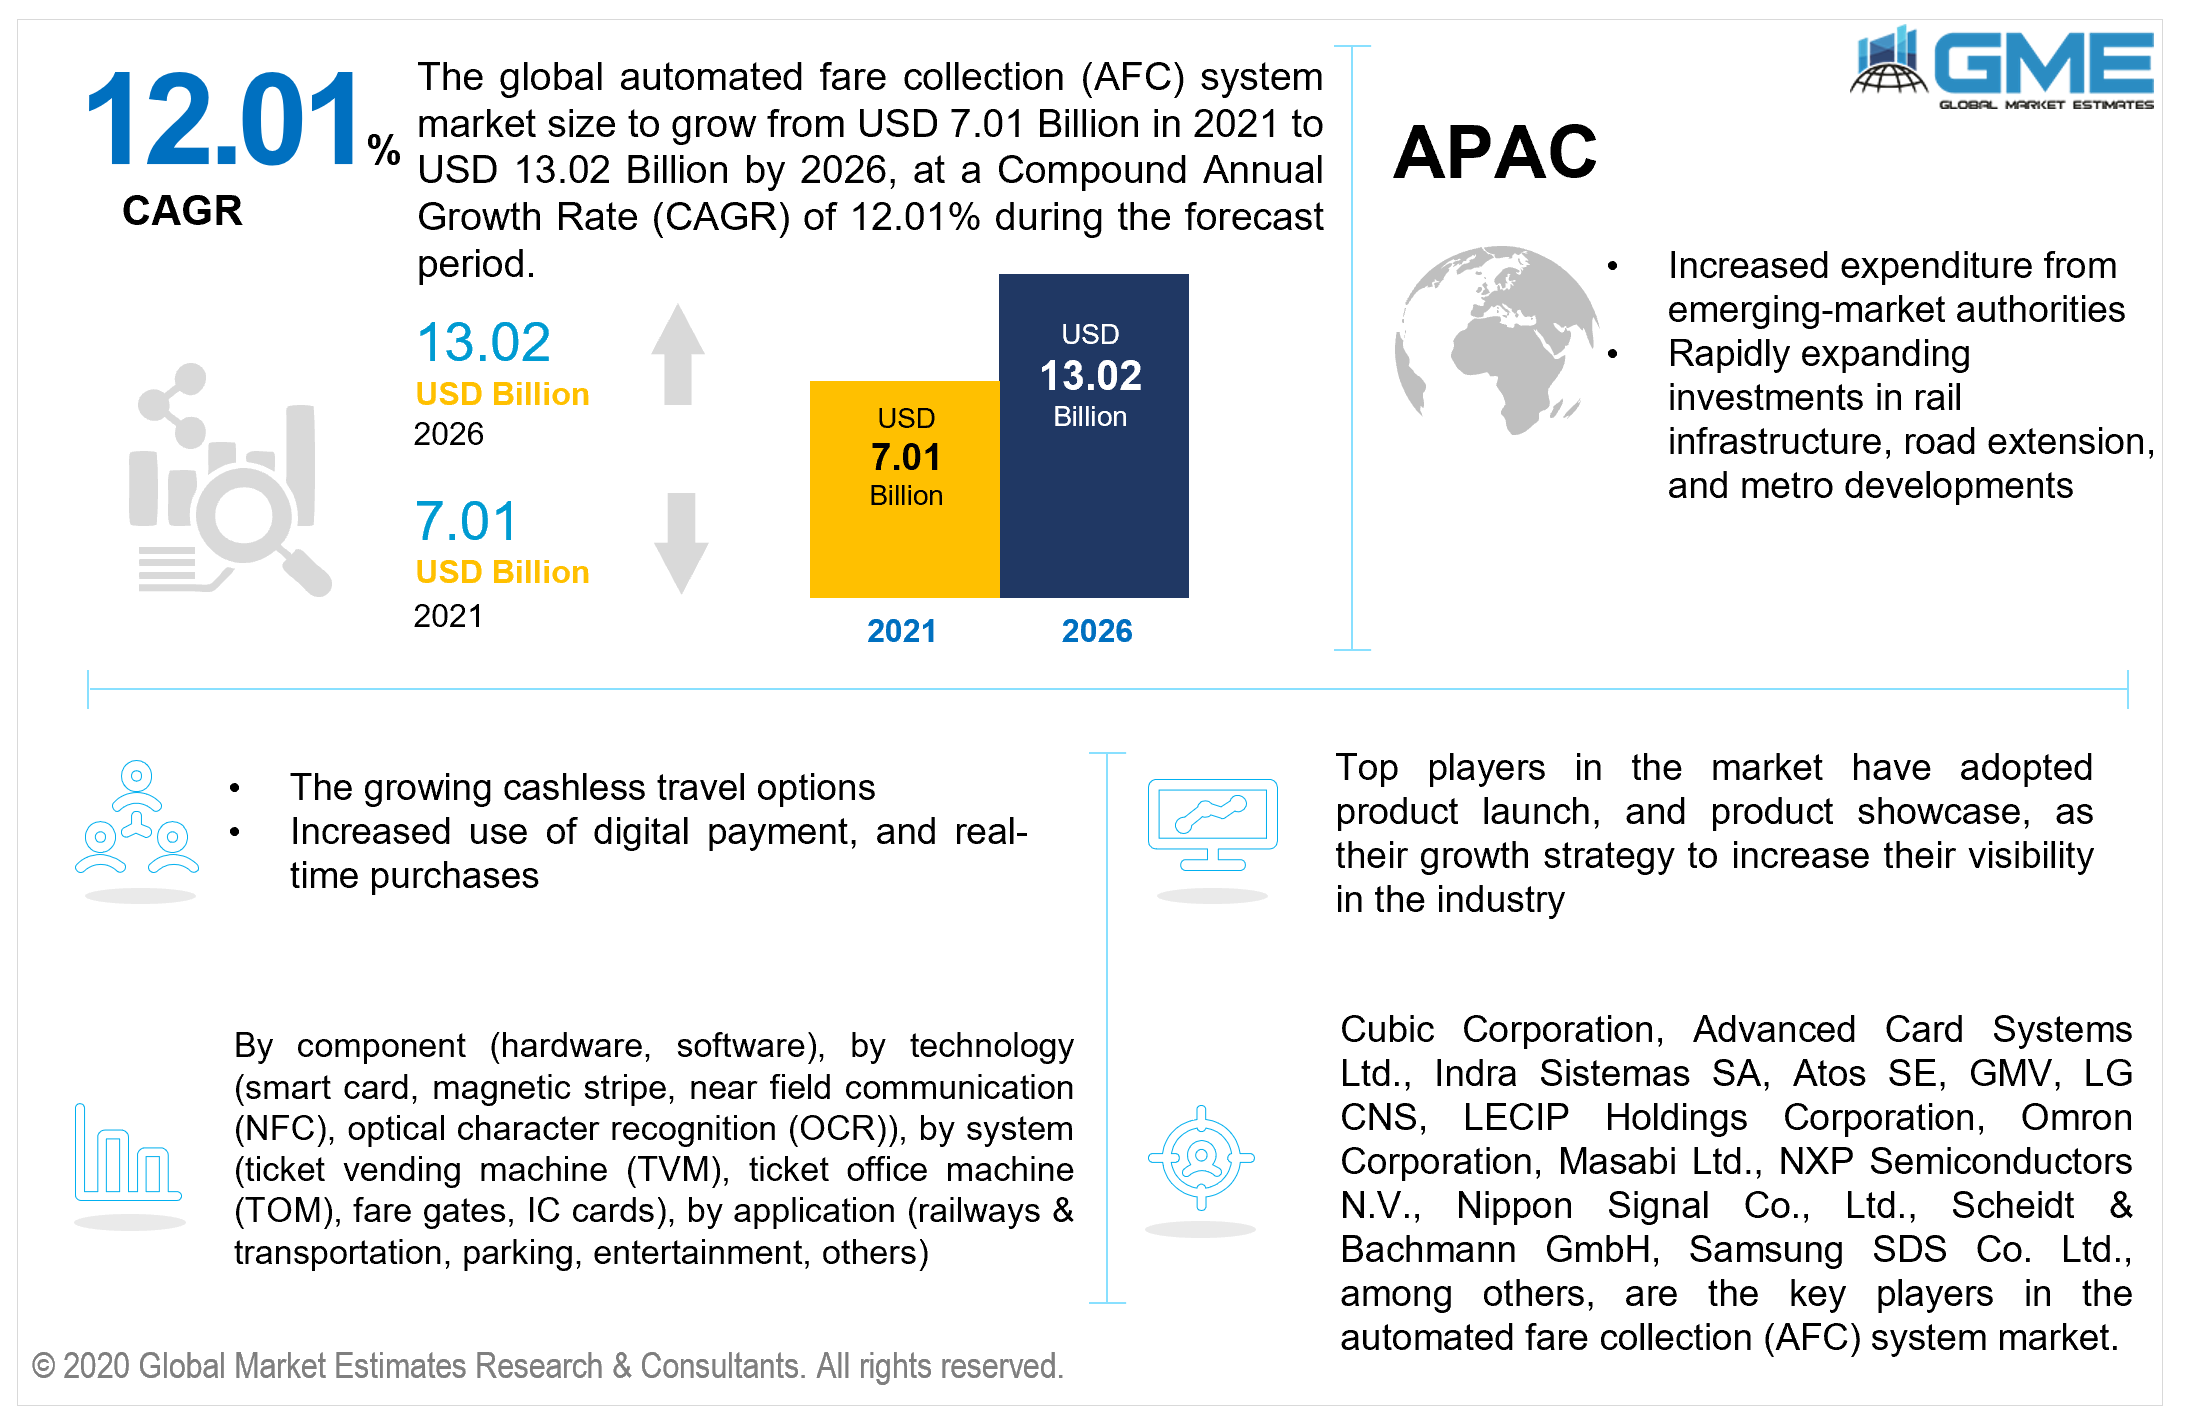
Global Automated Fare Collection (AFC) System Market Size, Trends & Analysis - Forecasts to 2026 By Component (Hardware, Software), By Technology (Smart Card, Magnetic Stripe, Near Field Communication (NFC), Optical Character Recognition (OCR)), By System (Ticket Vending Machine (TVM), Ticket Office Machine (TOM), Fare Gates, IC Cards), By Application (Railways & Transportation, Parking, Entertainment, Others), By Region (North America, Asia Pacific, CSA, Europe, and the Middle East and Africa), Company Market Share Analysis, and Competitor Analysis
The global automated fare collection (AFC) system market is projected to grow from USD 7.01 billion in 2021 and is expected to reach USD 13.02 billion by 2026 at a CAGR of 12.01% from 2021 to 2026. Automatic ticket vending machines, card recharging stations, gateway machinery, and ticket verification machines are all part of AFC systems. One of the main drivers propelling the market growth is predicted to be the growing desire for hassle-free and economical transport systems.
Growing cashless travel options and a shift towards open road tolling are important drivers of market growth during the forecast period. Increased use of digital payment and digital wallet portals which includes debit card, credit card, and Near Field Communication (NFC) payment applications, are anticipated to fuel market expansion.
Contactless open payment, increased demand for smartphones, improved efficiency, low fraudulent risks, improved transportation infrastructure, and surveillance system, along with customizable fare plans are all key influencing elements in the expansion of the automated fare collecting system market. Furthermore, variables such as a growth in population transportation's high speed, the development of technological payment, and global interconnectivity have a beneficial impact on the market.
The covid-19 outbreak has had a substantial impact on the market for autonomous fare collection systems. The majority of countries were subjected to regulations, which resulted in limits on public and private transportation, resulting in low use of automatic fare collection systems. Furthermore, the media and entertainment business were one of the first to adopt these systems, but owing to the outbreak of COVID-19, there were fewer events, which led to the AFC market's decline.
The rapid public investment in infrastructure in emerging nations around the world has opened up numerous commercial prospects. Increased regional integration among system integrators and transit agencies, such as airports, railways, and parking spaces, is also boosting industry expansion. The industry is predicted to develop because of the growing use of wireless connections, smartphones, and cashless technologies for digital transactions. However, expensive repair and commissioning costs, particularly in developing economies, may limit market expansion.
Based on the component, the market is segmented into hardware and software. The hardware segment is expected to have the largest share in the market during the forecast period. The growth is attributable to a rise in the number of new AFC systems being deployed by governments throughout the world to provide better public transportation services. Central Computer Systems (CCS), Station Computer Systems (SCS), and Station Equipment are common hardware components.
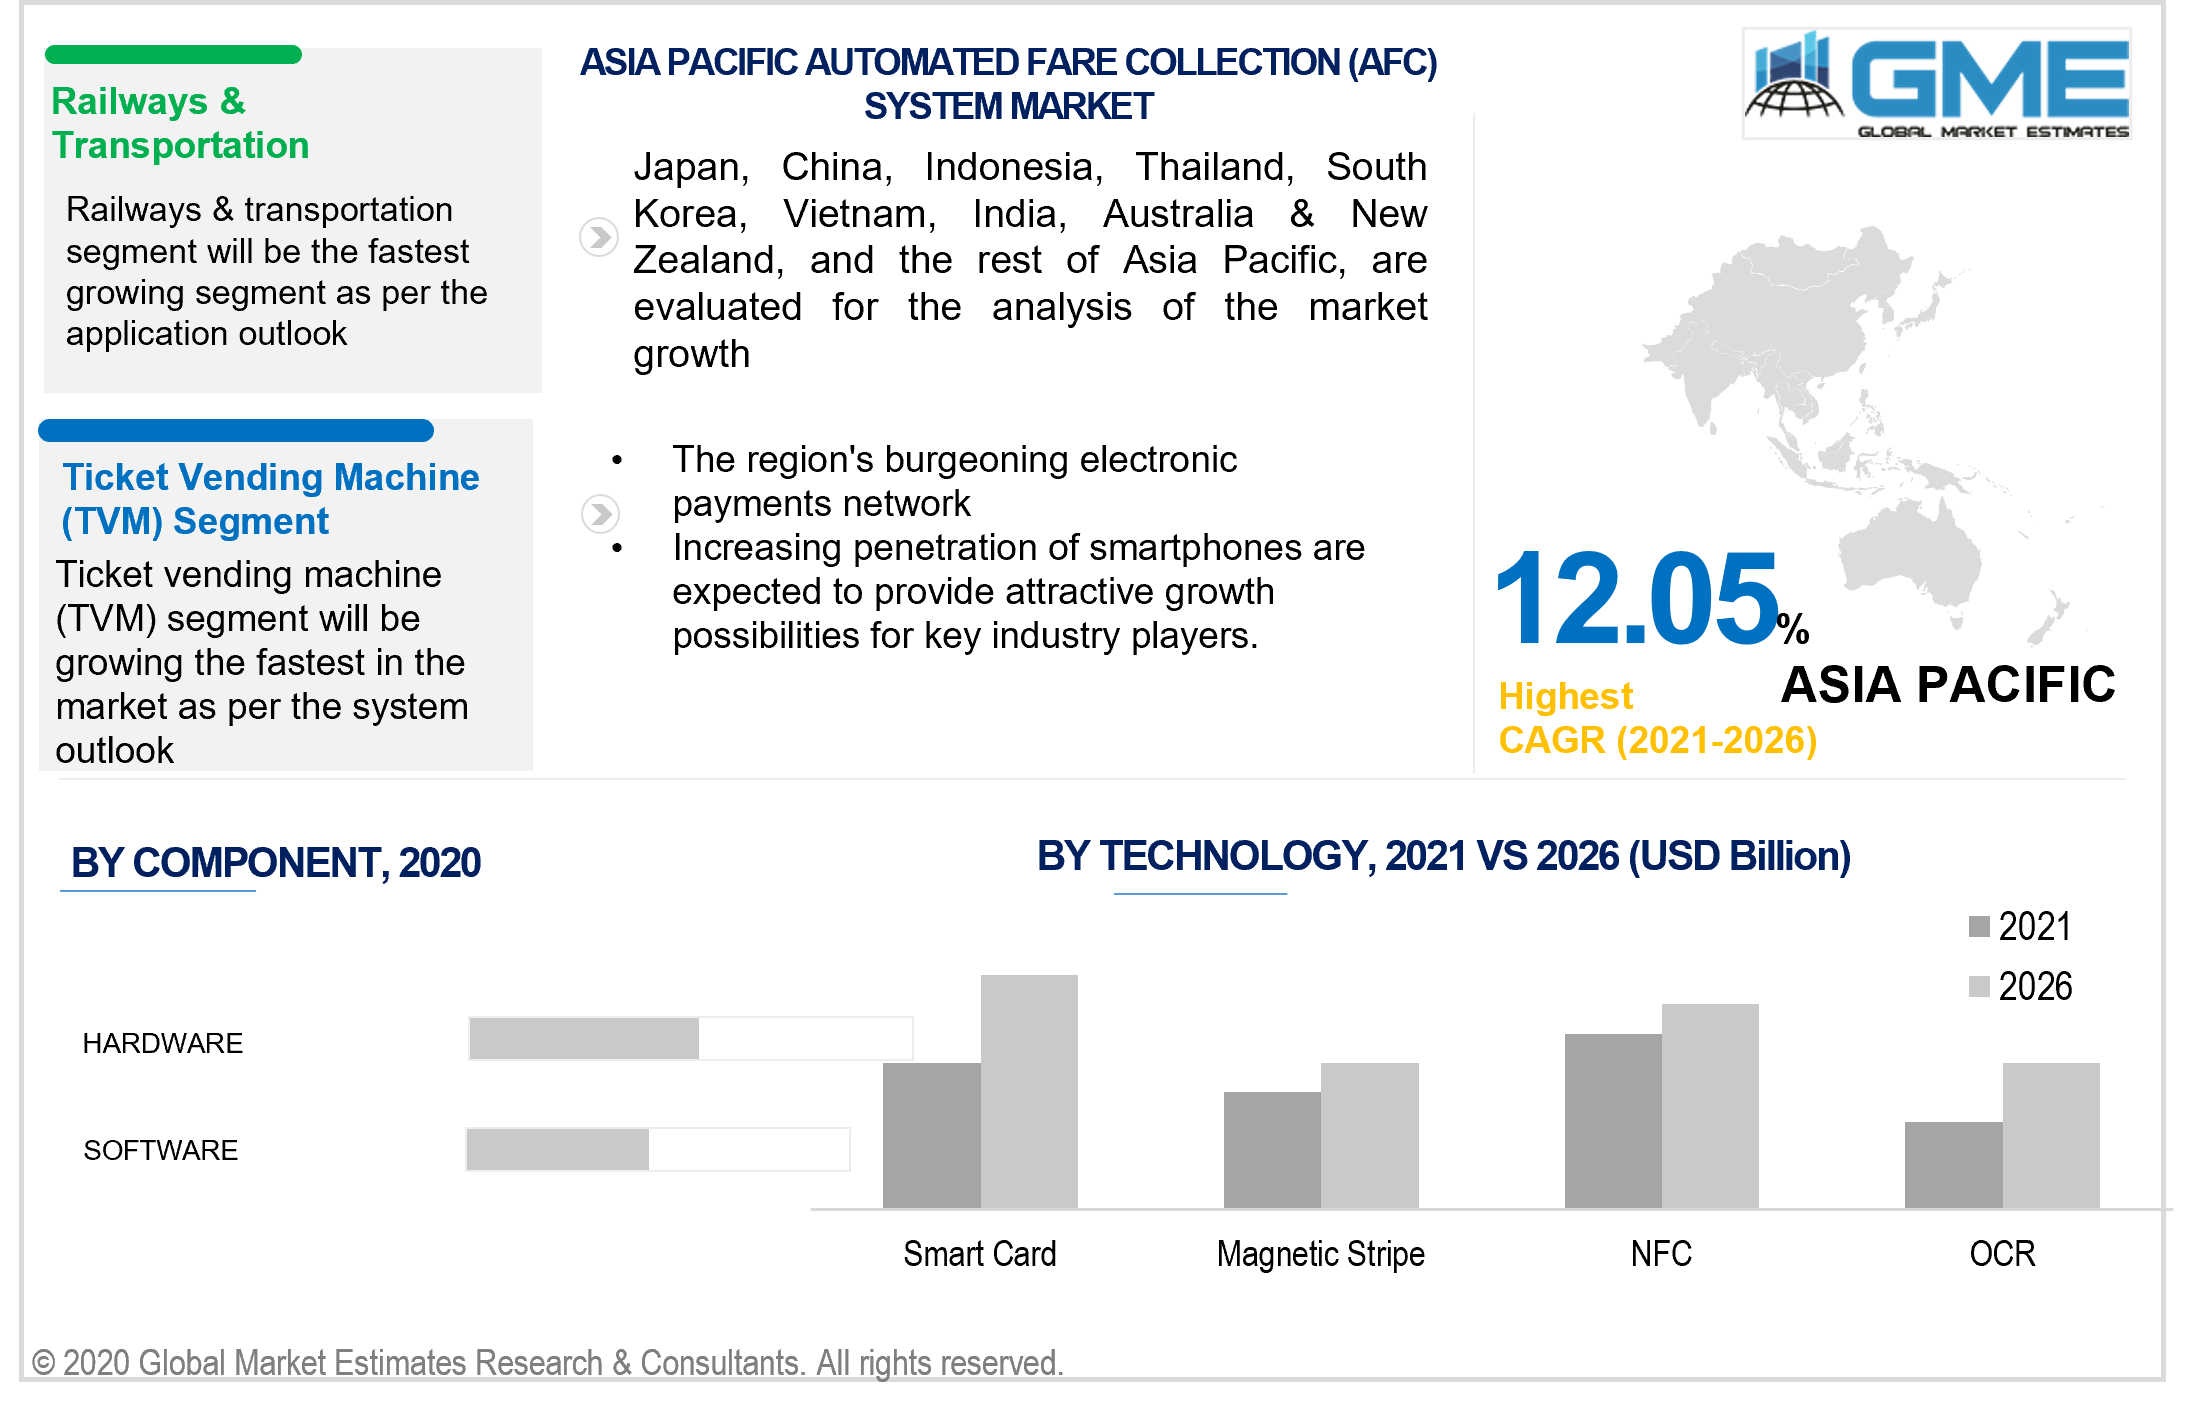
Based on technology, the market is divided into smart card, magnetic stripe, near field communication (NFC), and optical character recognition (OCR). The smart card technology segment is anticipated to have the largest share in the market during the forecast period. This is owing to its greater operational versatility and information processing as compared to magnetic stripe cards. Smart cards enable network operators to handle the heterogeneous distance and time-based price systems and allow fare unification across many modes of transportation.
Based on the system, the market is divided into ticket vending machine (TVM), ticket office machine (TOM), fare gates, and IC cards. The ticket vending machine (TVM) segment is anticipated to have the largest share in the market during the forecast period. The increased dependability and correctness of operations carried out by autonomous machines, such as TVM, can lower the risk of inaccuracies and provide greater transaction security than previous techniques. Several governmental organizations are investing in the deployment of TVMs and automated fare gates in high-traffic areas as a result of these causes.
Based on application, the market is segmented into railways & transportation, parking, entertainment, others. The railways and transportation segment are anticipated to witness the largest share in the market during the forecast period. The rapid proliferation of railway infrastructure, motorway networks, and expressway development in several countries have been the major drivers of the growth of the railway and transportation segment. These systems assist government agencies and transit system operators in alleviating traffic congestion and enhancing overall traffic flow on critical transit routes. Due to their frictionless transactional processing capability and the growing number of implementations at highway toll collecting stations, these systems are projected to gain widespread use.
Based on region, the market can be broken into various regions such as North America, Europe, Central, and South America, the Middle East and Africa, and Asia Pacific regions. The North American region is expected to have a lion’s share in the market during the forecast period. Factors including a booming tech population, enhanced technology, and telecommunications technology deployment, and a large number of mobile users have all contributed to the region's extensive adoption and use of AFC systems throughout time. Furthermore, the region's growth will be aided by the presence of a large number of AFC system integrators and producers that are always striving the design and delivery cutting-edge solutions.
The regional market for AFC systems in the Asia Pacific is witnessing an increase in demand. This is partly due to increased expenditure from emerging-market authorities in rail infrastructure, road extension, and metro developments to promote inter-city and intra-city travel. In the future years, the region's burgeoning electronic payments network and increasing penetration of smartphones is expected to provide attractive growth possibilities for key industry players.
Cubic Corporation, Advanced Card Systems Ltd., Indra Sistemas SA, Atos SE, GMV, LG CNS, LECIP Holdings Corporation, Omron Corporation, Masabi Ltd., NXP Semiconductors N.V., Nippon Signal Co., Ltd., Scheidt & Bachmann GmbH, Samsung SDS Co. Ltd., among others, are the key players in the automated fare collection (AFC) system market.
Please note: This is not an exhaustive list of companies profiled in the report.
Chapter 1 Methodology
1.1 Market Scope & Definitions
1.2 Estimates & Forecast Calculation
1.3 Historical Data Overview and Validation
1.4 Data Sources
1.4.1 Secondary
1.4.2 Primary
Chapter 2 Report Outlook
2.1 Automated Fare Collection (AFC) System Industry Overview, 2020-2026
2.1.1 Industry Overview
2.1.2 Application Overview
2.1.3 Component Overview
2.1.4 System Overview
2.1.5 Technology Overview
2.1.6 Regional Overview
Chapter 3 Automated Fare Collection (AFC) System Market Trends
3.1 Market Segmentation
3.2 Industry Background, 2020-2026
3.3 Market Key Trends
3.3.1 Positive Trends
3.3.1.1 Growing cashless travel options and a shift towards open road tolling
3.3.2 Industry Challenges
3.3.2.1 Expensive repair and commissioning costs
3.4 Prospective Growth Scenario
3.4.1 Application Growth Scenario
3.4.2 System Growth Scenario
3.4.3 Component Growth Scenario
3.4.4 Technology Growth Scenario
3.5 COVID-19 Influence over Industry Growth
3.6 Porter’s Analysis
3.7 PESTEL Analysis
3.8 Value Chain & Supply Chain Analysis
3.9 Regulatory Framework
3.9.1 North America
3.9.2 Europe
3.9.3 APAC
3.9.4 LATAM
3.9.5 MEA
3.10 Application Overview
3.11 Market Share Analysis, 2020
3.11.1 Company Positioning Overview, 2020
Chapter 4 Automated Fare Collection (AFC) System Market, By Application
4.1 Application Outlook
4.2 Railways & Transportation
4.2.1 Market Size, By Region, 2020-2026 (USD Billion)
4.3 Parking
4.3.1 Market Size, By Region, 2020-2026 (USD Billion)
4.4 Entertainment
4.4.1 Market Size, By Region, 2020-2026 (USD Billion)
4.5 Others
4.5.1 Market Size, By Region, 2020-2026 (USD Billion)
Chapter 5 Automated Fare Collection (AFC) System Market, By Component
5.1 Component Outlook
5.2 Hardware
5.2.1 Market Size, By Region, 2020-2026 (USD Billion)
5.3 Software
5.3.1 Market Size, By Region, 2020-2026 (USD Billion)
Chapter 6 Automated Fare Collection (AFC) System Market, By System
6.1 Ticket Vending Machine (TVM)
6.1.1 Market Size, By Region, 2020-2026 (USD Billion)
6.2 Ticket Office Machine (TOM)
6.2.1 Market Size, By Region, 2020-2026 (USD Billion)
6.3 Ticket Office Machine (TOM) Fare Gates
6.3.1 Market Size, By Region, 2020-2026 (USD Billion)
6.4 IC Cards
6.4.1 Market Size, By Region, 2020-2026 (USD Billion)
Chapter 7 Automated Fare Collection (AFC) System Market, By Technology
7.1 Smart Card, Magnetic Stripe
7.1.1 Market Size, By Region, 2020-2026 (USD Billion)
7.2 Magnetic Stripe
7.2.1 Market Size, By Region, 2020-2026 (USD Billion)
7.3 Near Field Communication (NFC)
7.3.1 Market Size, By Region, 2020-2026 (USD Billion)
7.4 Optical Character Recognition (OCR)
7.4.1 Market Size, By Region, 2020-2026 (USD Billion)
Chapter 8 Automated Fare Collection (AFC) System Market, By Region
8.1 Regional outlook
8.2 North America
8.2.1 Market Size, By Country 2020-2026 (USD Billion)
8.2.2 Market Size, By Application, 2020-2026 (USD Billion)
8.2.3 Market Size, By Component, 2020-2026 (USD Billion)
8.2.4 Market Size, By System, 2020-2026 (USD Billion)
8.2.5 Market Size, By Technology, 2020-2026 (USD Billion)
8.2.6 U.S.
8.2.6.1 Market Size, By Application, 2020-2026 (USD Billion)
8.2.4.2 Market Size, By Component, 2020-2026 (USD Billion)
8.2.4.3 Market Size, By System, 2020-2026 (USD Billion)
Market Size, By Technology, 2020-2026 (USD Billion)
8.2.7 Canada
8.2.7.1 Market Size, By Application, 2020-2026 (USD Billion)
8.2.7.2 Market Size, By Component, 2020-2026 (USD Billion)
8.2.7.3 Market Size, By System, 2020-2026 (USD Billion)
8.2.7.4 Market Size, By Technology, 2020-2026 (USD Billion)
8.3 Europe
8.3.1 Market Size, By Country 2020-2026 (USD Billion)
8.3.2 Market Size, By Application, 2020-2026 (USD Billion)
8.3.3 Market Size, By Component, 2020-2026 (USD Billion)
8.3.4 Market Size, By System, 2020-2026 (USD Billion)
8.3.5 Market Size, By Technology, 2020-2026 (USD Billion)
8.3.6 Germany
8.3.6.1 Market Size, By Application, 2020-2026 (USD Billion)
8.3.6.2 Market Size, By Component, 2020-2026 (USD Billion)
8.3.6.3 Market Size, By System, 2020-2026 (USD Billion)
8.3.6.4 Market Size, By Technology, 2020-2026 (USD Billion)
8.3.7 UK
8.3.7.1 Market Size, By Application, 2020-2026 (USD Billion)
8.3.7.2 Market Size, By Component, 2020-2026 (USD Billion)
8.3.7.3 Market Size, By System, 2020-2026 (USD Billion)
8.3.7.4 Market Size, By Technology, 2020-2026 (USD Billion)
8.3.8 France
8.3.8.1 Market Size, By Application, 2020-2026 (USD Billion)
8.3.8.2 Market Size, By Component, 2020-2026 (USD Billion)
8.3.8.3 Market Size, By System, 2020-2026 (USD Billion)
8.3.8.4 Market Size, By Technology, 2020-2026 (USD Billion)
8.3.9 Italy
8.3.9.1 Market Size, By Application, 2020-2026 (USD Billion)
8.3.9.2 Market Size, By Component, 2020-2026 (USD Billion)
8.3.9.3 Market Size, By System, 2020-2026 (USD Billion)
8.3.9.4 Market Size, By Technology, 2020-2026 (USD Billion)
8.3.10 Spain
8.3.10.1 Market Size, By Application, 2020-2026 (USD Billion)
8.3.10.2 Market Size, By Component, 2020-2026 (USD Billion)
8.3.10.3 Market Size, By System, 2020-2026 (USD Billion)
8.3.10.4 Market Size, By Technology, 2020-2026 (USD Billion)
8.3.11 Russia
8.3.11.1 Market Size, By Application, 2020-2026 (USD Billion)
8.3.11.2 Market Size, By Component, 2020-2026 (USD Billion)
8.3.11.3 Market Size, By System, 2020-2026 (USD Billion)
8.3.11.4 Market Size, By Technology, 2020-2026 (USD Billion)
8.4 Asia Pacific
8.4.1 Market Size, By Country 2020-2026 (USD Billion)
8.4.2 Market Size, By Application, 2020-2026 (USD Billion)
8.4.3 Market Size, By Component, 2020-2026 (USD Billion)
8.4.4 Market Size, By System, 2020-2026 (USD Billion)
8.4.5 Market Size, By Technology, 2020-2026 (USD Billion)
8.4.6 China
8.4.6.1 Market Size, By Application, 2020-2026 (USD Billion)
8.4.6.2 Market Size, By Component, 2020-2026 (USD Billion)
8.4.6.3 Market Size, By System, 2020-2026 (USD Billion)
8.4.6.4 Market Size, By Technology, 2020-2026 (USD Billion)
8.4.7 India
8.4.7.1 Market Size, By Application, 2020-2026 (USD Billion)
8.4.7.2 Market Size, By Component, 2020-2026 (USD Billion)
8.4.7.3 Market Size, By System, 2020-2026 (USD Billion)
8.4.7.4 Market Size, By Technology, 2020-2026 (USD Billion)
8.4.8 Japan
8.4.8.1 Market Size, By Application, 2020-2026 (USD Billion)
8.4.8.2 Market Size, By Component, 2020-2026 (USD Billion)
8.4.8.3 Market Size, By System, 2020-2026 (USD Billion)
8.4.8.4 Market Size, By Technology, 2020-2026 (USD Billion)
8.4.9 Australia
8.4.9.1 Market Size, By Application, 2020-2026 (USD Billion)
8.4.9.2 Market size, By Component, 2020-2026 (USD Billion)
8.4.9.3 Market Size, By System, 2020-2026 (USD Billion)
8.4.9.4 Market Size, By Technology, 2020-2026 (USD Billion)
8.4.10 South Korea
8.4.10.1 Market Size, By Application, 2020-2026 (USD Billion)
8.4.10.2 Market Size, By Component, 2020-2026 (USD Billion)
8.4.10.3 Market Size, By System, 2020-2026 (USD Billion)
8.4.10.4 Market Size, By Technology, 2020-2026 (USD Billion)
8.5 Latin America
8.5.1 Market Size, By Country 2020-2026 (USD Billion)
8.5.2 Market Size, By Application, 2020-2026 (USD Billion)
8.5.3 Market Size, By Component, 2020-2026 (USD Billion)
8.5.4 Market Size, By System, 2020-2026 (USD Billion)
8.5.5 Market Size, By Technology, 2020-2026 (USD Billion)
8.5.6 Brazil
8.5.6.1 Market Size, By Application, 2020-2026 (USD Billion)
8.5.6.2 Market Size, By Component, 2020-2026 (USD Billion)
8.5.6.3 Market Size, By System, 2020-2026 (USD Billion)
8.5.6.4 Market Size, By Technology, 2020-2026 (USD Billion)
8.5.7 Mexico
8.5.7.1 Market Size, By Application, 2020-2026 (USD Billion)
8.5.7.2 Market Size, By Component, 2020-2026 (USD Billion)
8.5.7.3 Market Size, By System, 2020-2026 (USD Billion)
8.5.7.4 Market Size, By Technology, 2020-2026 (USD Billion)
8.5.8 Argentina
8.5.8.1 Market Size, By Application, 2020-2026 (USD Billion)
8.5.8.2 Market Size, By Component, 2020-2026 (USD Billion)
8.5.8.3 Market Size, By System, 2020-2026 (USD Billion)
8.5.8.4 Market Size, By Technology, 2020-2026 (USD Billion)
8.6 MEA
8.6.1 Market Size, By Country 2020-2026 (USD Billion)
8.6.2 Market Size, By Application, 2020-2026 (USD Billion)
8.6.3 Market Size, By Component, 2020-2026 (USD Billion)
8.6.4 Market Size, By System, 2020-2026 (USD Billion)
8.6.5 Market Size, By Technology, 2020-2026 (USD Billion)
8.6.6 Saudi Arabia
8.6.6.1 Market Size, By Application, 2020-2026 (USD Billion)
8.6.6.2 Market Size, By Component, 2020-2026 (USD Billion)
8.6.6.3 Market Size, By System, 2020-2026 (USD Billion)
8.6.6.4 Market Size, By Technology, 2020-2026 (USD Billion)
8.6.7 UAE
8.6.7.1 Market Size, By Application, 2020-2026 (USD Billion)
8.6.7.2 Market Size, By Component, 2020-2026 (USD Billion)
8.6.7.3 Market Size, By System, 2020-2026 (USD Billion)
8.6.7.4 Market Size, By Technology, 2020-2026 (USD Billion)
8.6.8 South Africa
8.6.8.1 Market Size, By Application, 2020-2026 (USD Billion)
8.6.8.2 Market Size, By Component, 2020-2026 (USD Billion)
8.6.8.3 Market Size, By System, 2020-2026 (USD Billion)
8.6.8.4 Market Size, By Technology , 2020-2026 (USD Billion)
Chapter 9 Company Landscape
9.1 Competitive Analysis, 2020
9.2 Cubic Corporation
9.2.1 Company Overview
9.2.2 Financial Analysis
9.2.3 Strategic Positioning
9.2.4 Info Graphic Analysis
9.3 Advanced Card Systems Ltd
9.3.1 Company Overview
9.3.2 Financial Analysis
9.3.3 Strategic Positioning
9.3.4 Info Graphic Analysis
9.4 Indra Sistemas SA
9.4.1 Company Overview
9.4.2 Financial Analysis
9.4.3 Strategic Positioning
9.4.4 Info Graphic Analysis
9.5 Atos SE
9.5.1 Company Overview
9.5.2 Financial Analysis
9.5.3 Strategic Positioning
9.5.4 Info Graphic Analysis
9.6 GMV
9.6.1 Company Overview
9.6.2 Financial Analysis
9.6.3 Strategic Positioning
9.6.4 Info Graphic Analysis
9.7 LG CNS
9.7.1 Company Overview
9.7.2 Financial Analysis
9.7.3 Strategic Positioning
9.7.4 Info Graphic Analysis
9.8 LECIP Holdings Corporation
9.8.1 Company Overview
9.8.2 Financial Analysis
9.8.3 Strategic Positioning
9.8.4 Info Graphic Analysis
9.9 Omron Corporation
9.9.1 Company Overview
9.9.2 Financial Analysis
9.9.3 Strategic Positioning
9.9.4 Info Graphic Analysis
9.10 Masabi Ltd.
9.10.1 Company Overview
9.10.2 Financial Analysis
9.10.3 Strategic Positioning
9.10.4 Info Graphic Analysis
9.11 Other Companies
9.11.1 Company Overview
9.11.2 Financial Analysis
9.11.3 Strategic Positioning
9.11.4 Info Graphic Analysis
The Global Automated Fare Collection (AFC) System Market has been studied from the year 2019 till 2026. However, the CAGR provided in the report is from the year 2021 to 2026. The research methodology involved three stages: Desk research, Primary research, and Analysis & Output from the entire research process.

The desk research involved a robust background study which meant referring to paid and unpaid databases to understand the market dynamics; mapping contracts from press releases; identifying the key players in the market, studying their product portfolio, competition level, annual reports/SEC filings & investor presentations; and learning the demand and supply-side analysis for the Automated Fare Collection (AFC) System Market.

The primary research activity included telephonic conversations with more than 50 tier 1 industry consultants, distributors, and end-use product manufacturers.

Finally, based on the above thorough research process, an in-depth analysis was carried out considering the following aspects: market attractiveness, current & future market trends, market share analysis, SWOT analysis of the company and customer analytics.

Frequently Asked Questions

This FREE sample includes market data points, ranging from trend analyses to market estimates & forecasts. See for yourself.
Or view our licence options:
Tailor made solutions just for you
80% of our clients seek made-to-order reports. How do you want us to tailor yours?
OUR CLIENTS


