This report was recently updated on August 21 2025 with the latest and most recent
market numbers
Global Carbon Credit Market Size, Trends & Analysis - Forecasts to 2028 By Willingness to Join (Compliance and Voluntary), By Project Type (Avoidance / Reduction Projects, and Removal / Sequestration Projects), End-use Industry (Power, Energy, Aviation, Transportation, and Others), and By Region (North America, Asia Pacific, Central & South America, Europe, and Middle East and Africa), Competitive Landscape, Company Market Share Analysis, and Competitor Analysis
The global carbon credit market is expected to grow at a CAGR of 35.3% from 2023 to 2028.Carbon credit market is a system, where tradable permits or certificates, known as carbon credits are issued to companies that reduce their greenhouse gas emissions. Each credit enables them to emit a metric ton of CO2 or other comparable greenhouse gases. The main aim is to curb global warming by encouraging emission reduction from industrial activities. Governments set emission caps, and companies can purchase credits to comply, when immediate emission reduction is not feasible. Carbon credits can be voluntary emissions reductions (VER) or certified emissions reductions (CER), with the latter being regulated by a third-party certifying body. Rising adoption of international carbon credits, such as the European Union Emission Trading Scheme, is expected to drives the global market growth.
The demand for carbon credits in the global market is increasing rapidly because of several factors. First, government laws and schemes aimed at reducing greenhouse gas emissions are pushing companies to purchase carbon credits to comply with emission limits. The Indian Ministry of Environment, Forests, and Climate Change announced the 'Green Credit Programme Implementation Rules, 2023' on June 26, 2023, while the Ministry of Power notified the Carbon Credit Trading Scheme, 2023, on June 28, 2023. Additionally, corporate sustainability goals and increasing public pressure to address climate change drive companies to offset their carbon footprints through the purchase of carbon credits. With a growing focus on net-zero targets and the need for decarbonisation, businesses are investing in carbon credits to achieve their emission reduction goals. Voluntary markets in the U.S. contribute to demand by allowing businesses to decrease their environmental effect and showcase their commitment to environmental sustainability. As sustainability becomes a core aspect of corporate strategies, the global market for carbon credits is expected to grow substantially in the coming years.
The global carbon credit market faces several restraints that hinders the market growth. Firstly, no single nation can effectively implement a circular economy on its own, necessitating international cooperation and trade. However, the current circular commerce system predominantly benefits the Global North (Northern America and Europe, Israel, Japan and South Korea, Australia and New Zealand), while the Global South (Africa, Latin America and the Caribbean, some parts of Asia, and Oceania) bears the environmental and human costs. This disparity calls for greater global collaboration to avoid further division in circular trade. Additionally, limited awareness and understanding of the circular economy among companies and firms hinder its widespread adoption. Overcoming these restraints requires collective efforts and a shared commitment to sustainable and inclusive economic practices worldwide.
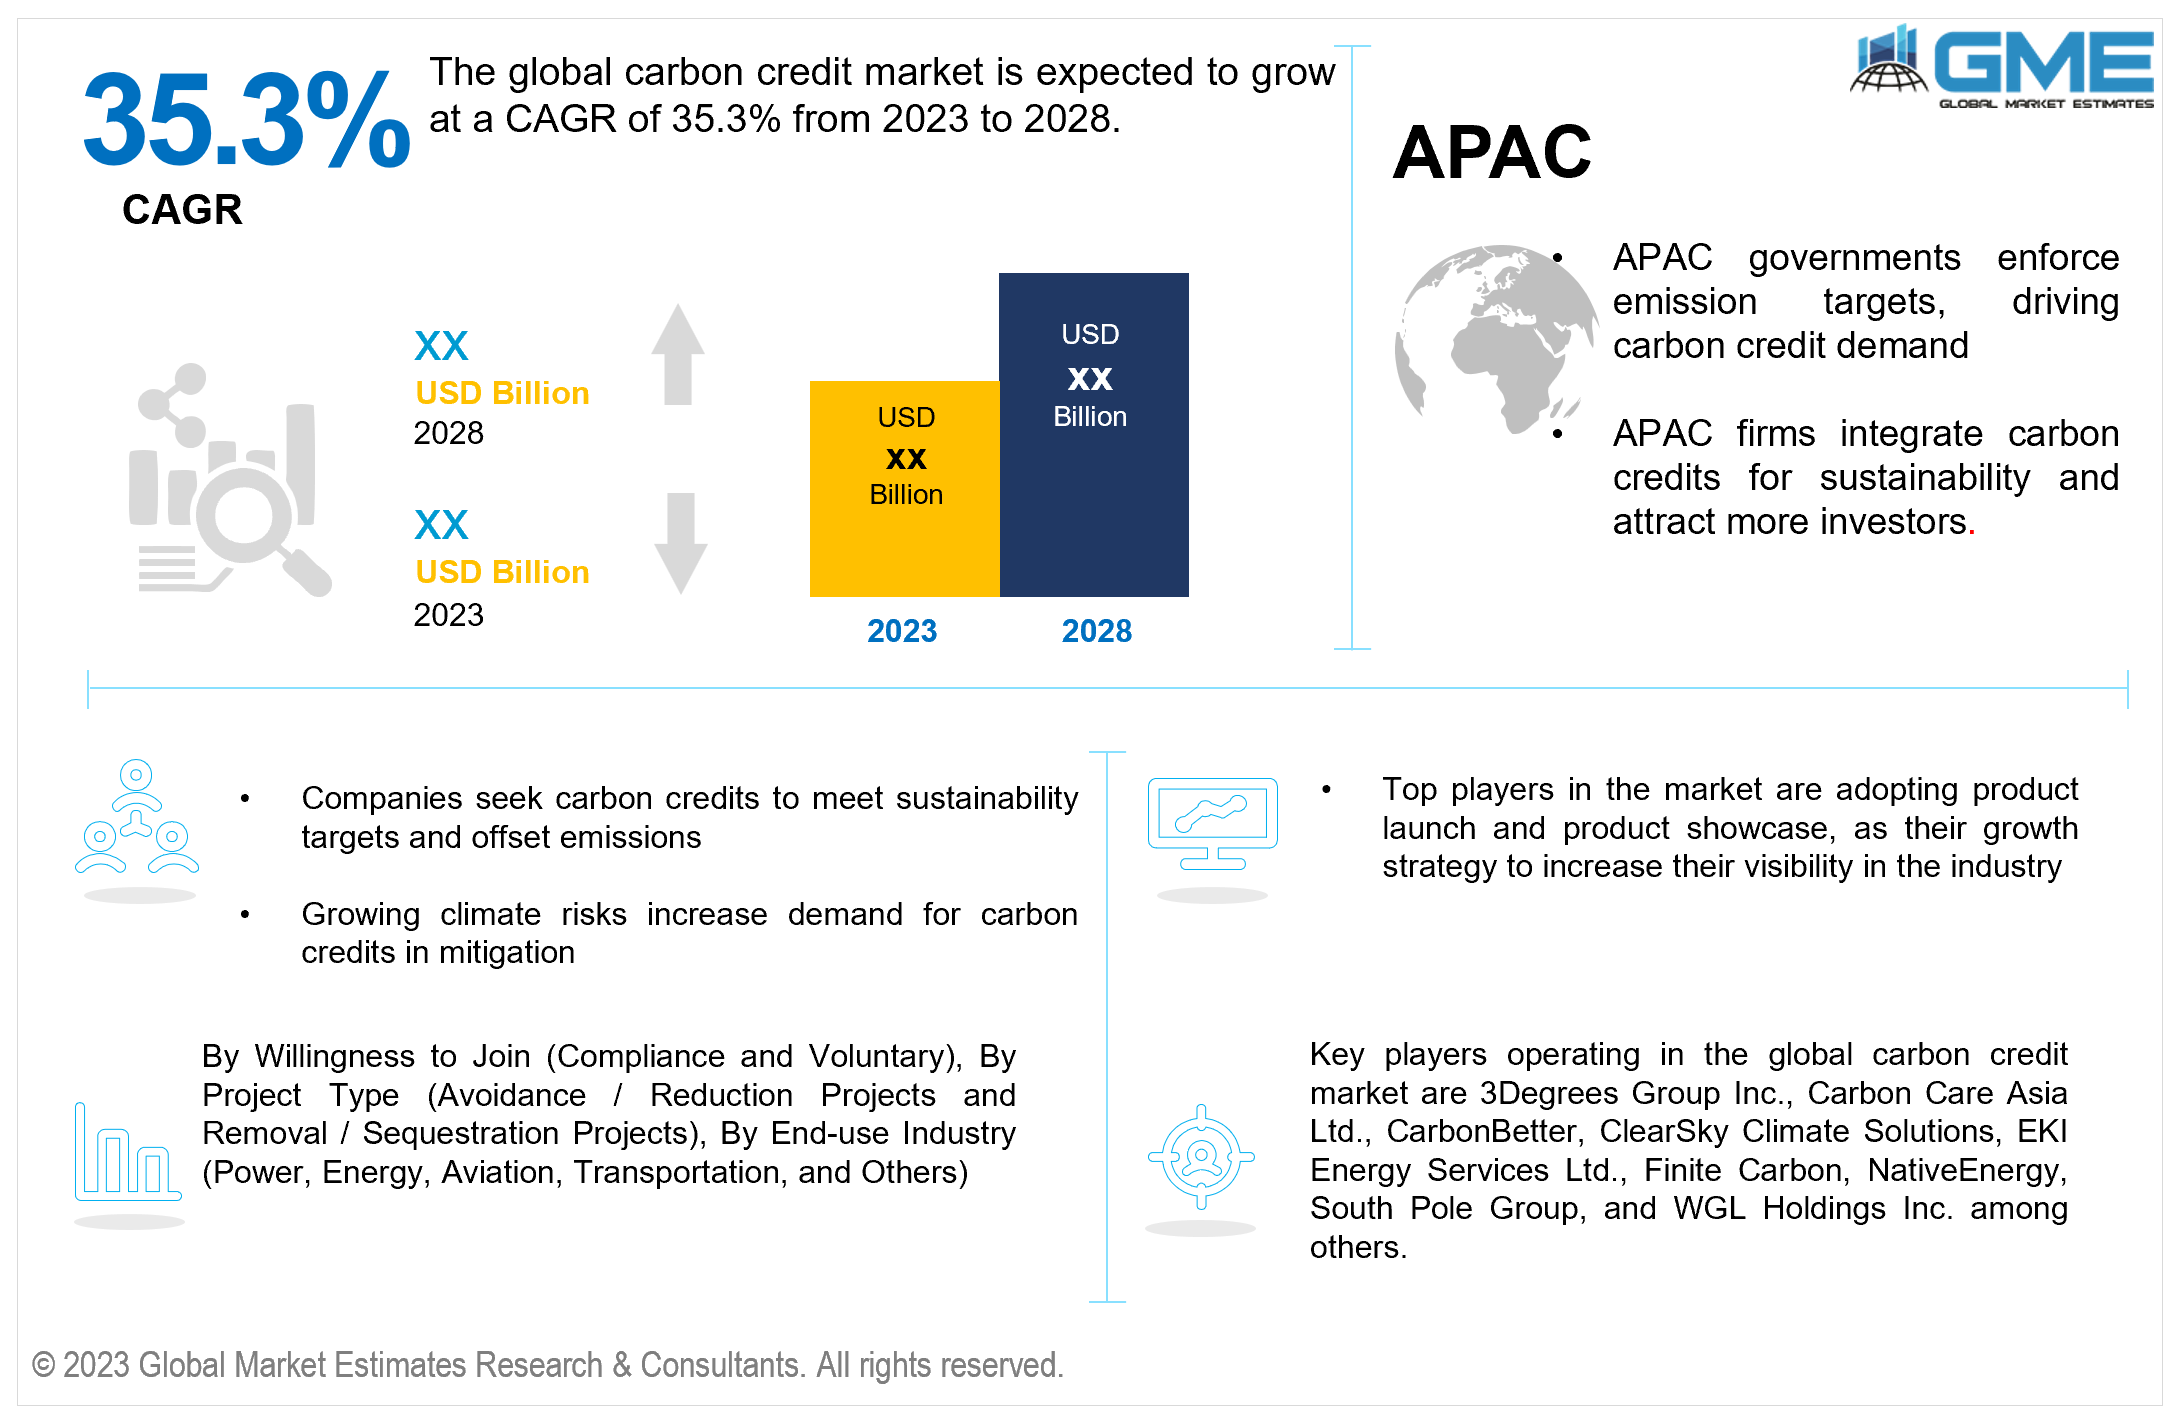
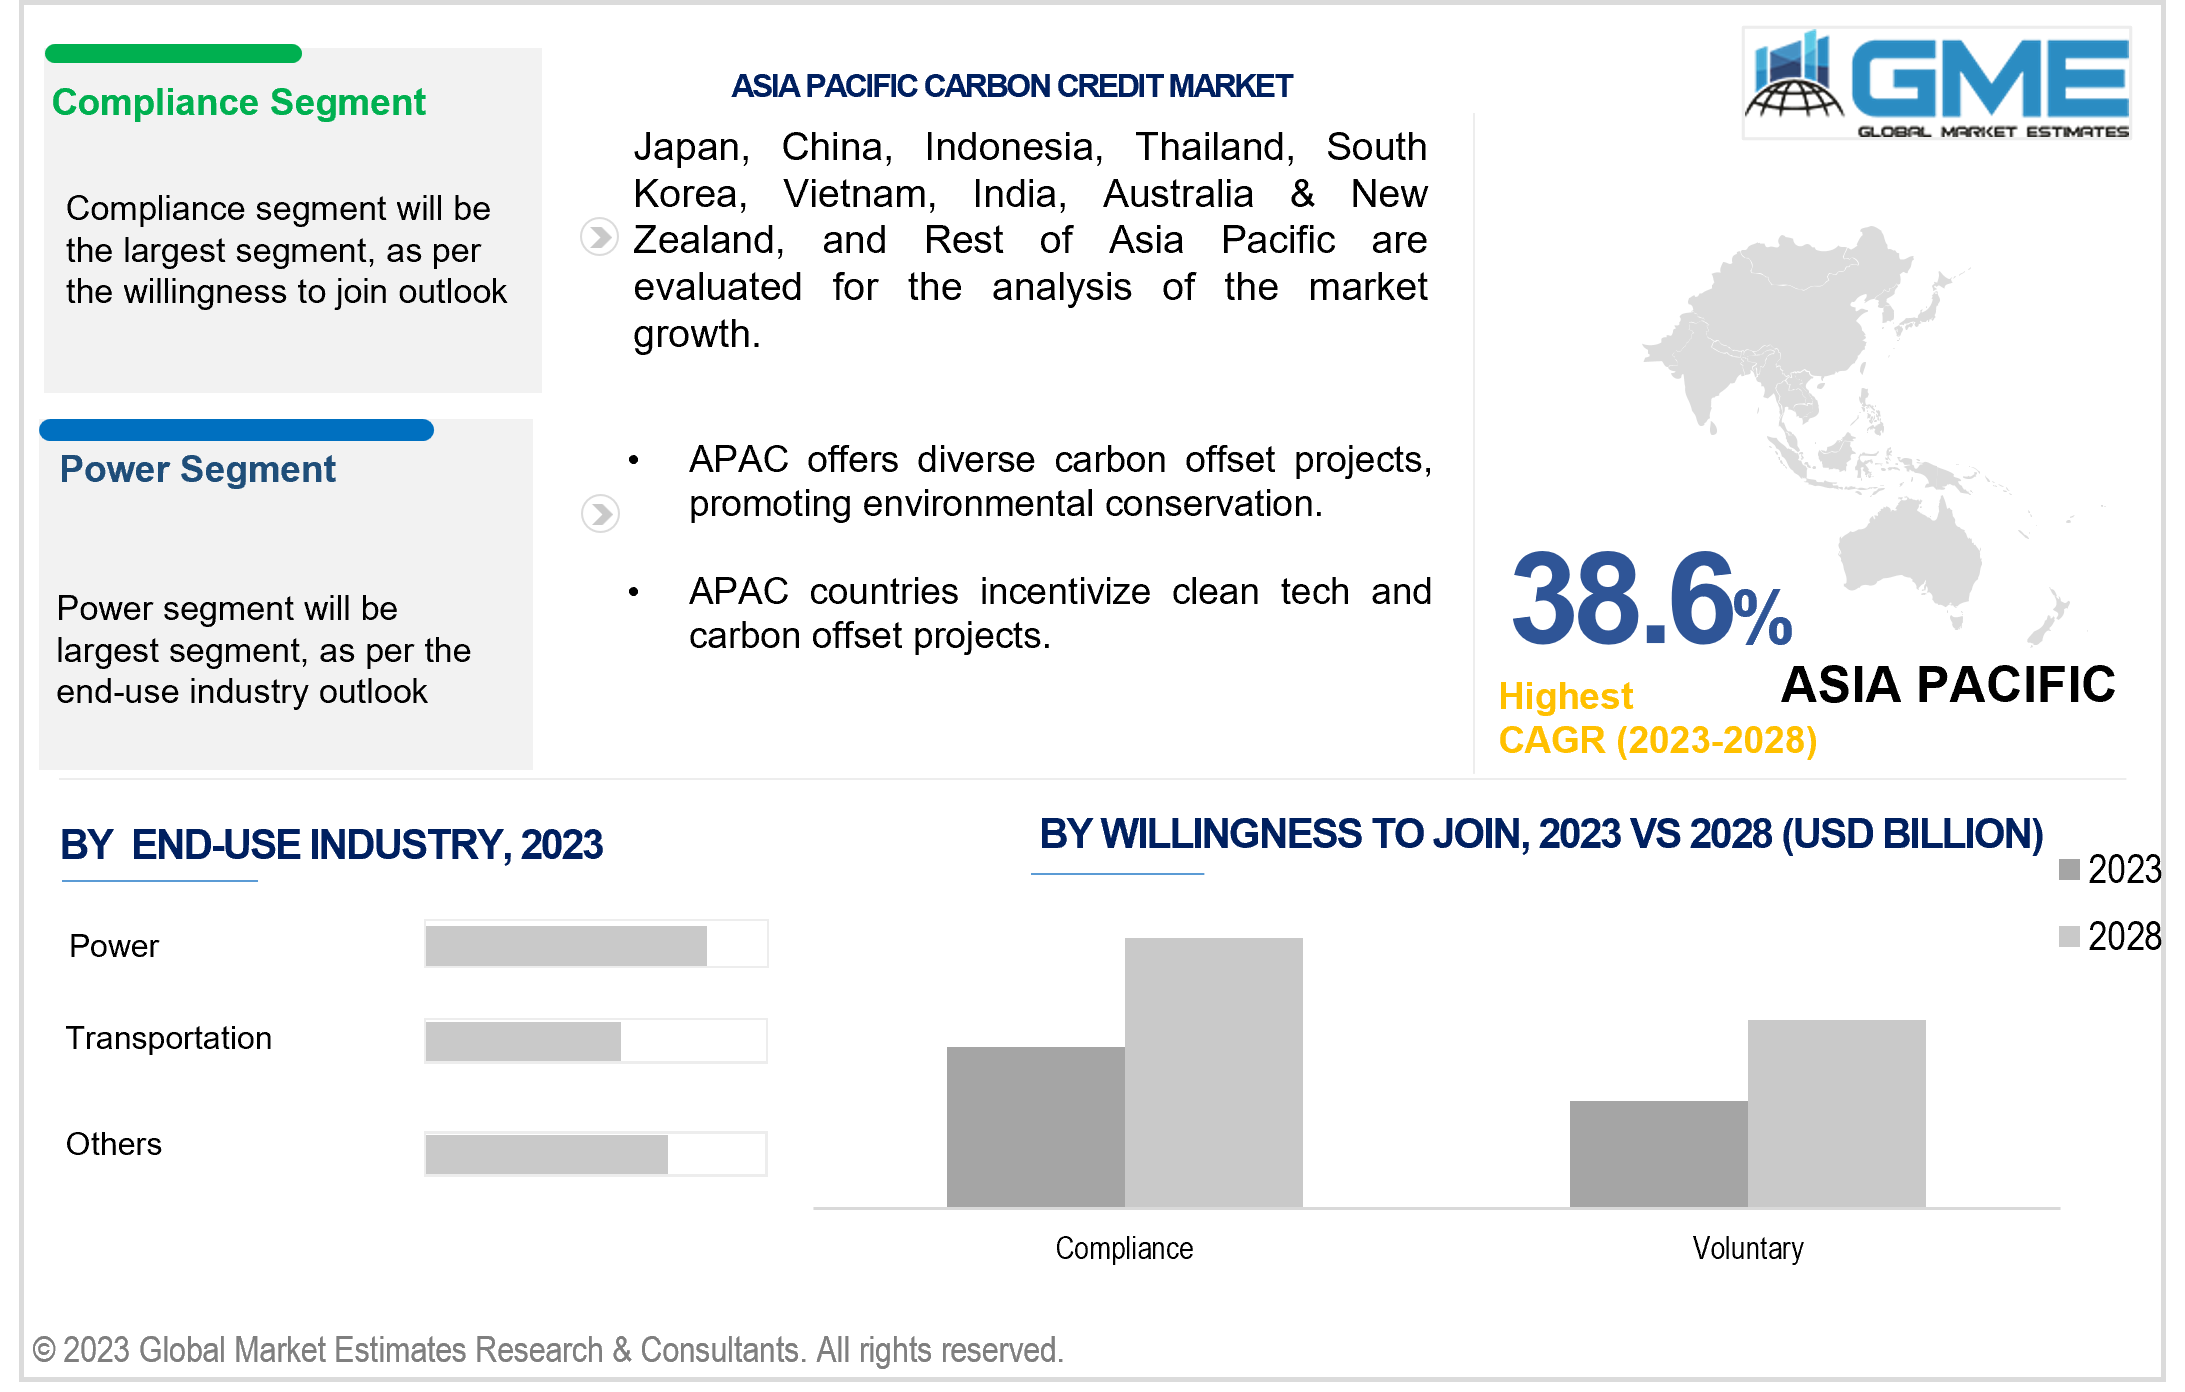
On the basis of willingness to join, the market is segmented into compliance and voluntary. The compliance segment is expected to be the largest segment during the forecast period. This is because it involves companies and organizations mandated by government regulations or specific authorities to offset their carbon emissions. These entities are required to purchase carbon credits as part of their legal obligations to meet emission reduction targets.
The voluntary segment is projected to be the fastest-growing segment in the carbon offset/carbon credits industry due to its freedom from regulatory constraints. Unlike the compliance market, the voluntary market operates without authorities' compelled regulations, providing both private and public firms with greater flexibility and opportunities to engage actively. The increasing transparency and reliability in credit quality further attract companies to participate in voluntary carbon offset initiatives voluntarily, aligning with their sustainability goals and enhancing their brand reputation.
On the basis of project type, the market is segmented avoidance / reduction projects and removal / sequestration projects. The avoidance / reduction projects segment is expected to be the largest segment during the forecast period. By investing in renewable energy projects such as wind farms and methane capture facilities, companies can generate carbon credits by preventing the emissions that can occur from conventional fossil fuel-based projects. This approach offers a practical and scalable solution for companies seeking to offset their own emissions while contributing to global climate goals. The segment growth is driven by its proven environmental impact and alignment with sustainability targets.
The removal/sequestration projects segment is expected to the fastest-growing segment in the global carbon credit market due to its potential to directly address climate change by actively removing carbon dioxide from the atmosphere. Projects such as afforestation, reforestation, and carbon capture technologies provide tangible and measurable results in carbon reduction. As the world intensifies efforts to combat climate change, companies and governments are increasingly investing in such projects to offset emissions, meet sustainability goals, and contribute to a more sustainable future. Companies like Shell, Salesforce, Chevron CVX, and Samsung are among companies that contribute to the voluntary carbon credit market.
On the basis of end-use industry, the market is segmented into power, energy, aviation, transportation, and others. The power segment is projected to be the largest segment during the forecast period. This is due to its increasing adoption of low GHG technologies by power sector to reduce greenhouse gas emissions. Power companies invest on carbon-offsetting projects such as renewable energy initiative, to offset their emissions. As a major emitter, power sector's active participation in carbon credit schemes contributes to the overall market growth.
The transportation segment is expected to be the fastest growing segment in the global carbon credit market due to its significant contribution to greenhouse gas emissions. Due to significant GHG emissions, transport related companies invest in the carbon credit market. This can be either voluntary or to meet certain government regulations. As governments and industries worldwide prioritize emission reductions, transportation companies seek carbon credits to offset their emissions. Advancements in sustainable transport such as electric vehicles and biofuels aids in reducing GHG emissions. Moreover, consumers' increasing preference for eco-friendly transportation options further accelerates demand for carbon credits.
Europe is analysed to be the largest region in the global carbon credit market during the forecast period. This is owing to the establishment of the EU's Emissions Trading System (ETS) in 2005. Covering over 11,000 installations responsible for 45% of the EU's greenhouse gas emissions, the ETS forms the world's largest carbon credit market. The price of carbon credits fluctuates based on supply and demand dynamics, economic conditions, energy prices, and climate policies. Europe's leadership in adopting renewable energy and low-carbon technologies further drives demand for carbon credits. As a result, EU ETS has become a cornerstone of the region's efforts to combat climate change and foster sustainable practices, thereby retaining Europe's position as a dominant region in the global carbon credit market.
Asia Pacific is analysed to be the fastest growing region across the global carbon credit market. It is expected to account for a major market share in terms of revenue and exhibit a high compound annual growth rate (CAGR) in the near future. As the region develops rapidly, the formation of a new and regulated carbon credit market in countries such as India offers lucrative growth opportunities for organizations to explore and experiment with this emerging concept. This allows Indian companies to gain valuable expertise in creating and providing consulting services to global clients.
Key players operating in the global carbon credit market are 3Degrees Group Inc., Carbon Care Asia Ltd., CarbonBetter, ClearSky Climate Solutions, EKI Energy Services Ltd., Finite Carbon, NativeEnergy, South Pole Group, and WGL Holdings Inc. among others.
Please note: This is not an exhaustive list of companies profiled in the report.
1 STRATEGIC INSIGHTS ON NEW REVENUE POCKETS
1.1 Strategic Opportunity & Attractiveness Analysis
1.1.1 Hot Revenue Pockets
1.1.2 Market Attractiveness Score
1.1.3 Revenue Impacting Opportunity
1.1.4 High Growing Region/Country
1.1.5 Competitor Analysis
1.1.6 Consumer Analysis
1.2 Global Market Estimates' View
1.3 Strategic Insights across Business Functions
1.3.1 For Chief Executive Officers
1.3.2 For Chief Marketing Officers
1.3.3 For Chief Strategy Officers
1.4 Evaluate the Potential of your Existing Business Lines vs. New Lines to Enter Into
2.1 Technological Adoption Rate
2.2 Current Trend Impact Analysis
2.3 Future Trend Impact Analysis
2.4 Data Metrics on Feed Stocks
3.1.2 Adjacent Market Opportunities
3.1.3 Ancillary Market Opportunities
3.2.1 Market Drivers: Impact Analysis
3.2.2 Market Restraints: Impact Analysis
3.2.3 Market Opportunities: Impact Analysis
3.2.4 Market Challenges: Impact Analysis
3.3.1 Porter’s Five Forces Analysis
3.3.1.1 Threat of New Entrants
3.3.1.2 Threat of New Substitutes
3.3.1.3 Bargaining Power of Suppliers
3.3.1.4 Bargaining Power of Buyers
3.3.1.5 Intensity of Competitive Rivalry
3.3.2 SWOT Analysis; By Factor (Political & Legal, Economic, and Technological)
4 GLOBAL CARBON CREDITS MARKET, BY WILLINGNESS TO JOIN
4.2 Carbon Credits Market: Willingness to Join Scope Key Takeaways
4.3 Revenue Growth Analysis, 2022 & 2028
4.4.1 Compliance Market Estimates and Forecast, 2020-2028 (USD Billion)
4.5.1 Voluntary Market Estimates and Forecast, 2020-2028 (USD Billion)
5 GLOBAL CARBON CREDITS MARKET, BY PROJECT TYPE
5.2 Carbon Credits Market: Project Type Scope Key Takeaways
5.3 Revenue Growth Analysis, 2022 & 2028
5.4 Avoidance / Reduction Projects
5.4.1 Avoidance / Reduction Projects Market Estimates and Forecast, 2020-2028 (USD Billion)
5.5 Removal / Sequestration Projects
5.5.1 Removal / Sequestration Projects Market Estimates and Forecast, 2020-2028 (USD Billion)
5.6.1 Other Products Market Estimates and Forecast, 2020-2028 (USD Billion)
6 GLOBAL CARBON CREDITS MARKET, BY END-USE INDUSTRY
6.2 Carbon Credits Market: End-use Industry Scope Key Takeaways
6.3 Revenue Growth Analysis, 2022 & 2028
6.4.1 Power Market Estimates and Forecast, 2020-2028 (USD Billion)
6.5.1 Energy Market Estimates and Forecast, 2020-2028 (USD Billion)
6.6.1 Aviation Market Estimates and Forecast, 2020-2028 (USD Billion)
6.7.1 Transportation Market Estimates and Forecast, 2020-2028 (USD Billion)
6.8.1 Other Industries Market Estimates and Forecast, 2020-2028 (USD Billion)
7 GLOBAL CARBON CREDITS MARKET, BY REGION
7.2 North America Carbon Credits Market Estimates and Forecast, 2020-2028 (USD Billion)
7.2.4.1 U.S. Carbon Credits Market Estimates and Forecast, 2020-2028 (USD Billion)
7.2.4.1.1 By Willingness to Join
7.2.4.2 Canada Carbon Credits Market Estimates and Forecast, 2020-2028 (USD Billion)
7.2.4.2.1 By Willingness to Join
7.2.4.3 Mexico Carbon Credits Market Estimates and Forecast, 2020-2028 (USD Billion)
7.2.4.3.1 By Willingness to Join
7.3 Europe Carbon Credits Market Estimates and Forecast, 2020-2028 (USD Billion)
7.3.4.1 Germany Carbon Credits Market Estimates and Forecast, 2020-2028 (USD Billion)
7.3.4.1.1 By Willingness to Join
7.3.4.2 U.K. Carbon Credits Market Estimates and Forecast, 2020-2028 (USD Billion)
7.3.4.2.1 By Willingness to Join
7.3.4.3 France Carbon Credits Market Estimates and Forecast, 2020-2028 (USD Billion)
7.3.4.3.1 By Willingness to Join
7.3.4.4 Italy Carbon Credits Market Estimates and Forecast, 2020-2028 (USD Billion)
7.3.4.4.1 By Willingness to Join
7.3.4.5 Spain Carbon Credits Market Estimates and Forecast, 2020-2028 (USD Billion)
7.3.4.5.1 By Willingness to Join
7.3.4.6 Netherlands Carbon Credits Market Estimates and Forecast, 2020-2028 (USD Billion)
7.3.4.7.1 By Willingness to Join
7.3.4.7 Rest of Europe Carbon Credits Market Estimates and Forecast, 2020-2028 (USD Billion)
7.3.4.7.1 By Willingness to Join
7.4 Asia Pacific Carbon Credits Market Estimates and Forecast, 2020-2028 (USD Billion)
7.4.4.1 China Carbon Credits Market Estimates and Forecast, 2020-2028 (USD Billion)
7.4.4.1.1 By Willingness to Join
7.4.4.2 Japan Carbon Credits Market Estimates and Forecast, 2020-2028 (USD Billion)
7.4.4.2.1 By Willingness to Join
7.4.4.3 India Carbon Credits Market Estimates and Forecast, 2020-2028 (USD Billion)
7.4.4.3.1 By Willingness to Join
7.4.4.4 South Korea Carbon Credits Market Estimates and Forecast, 2020-2028 (USD Billion)
7.4.4.4.1 By Willingness to Join
7.4.4.5 Singapore Carbon Credits Market Estimates and Forecast, 2020-2028 (USD Billion)
7.4.4.5.1 By Willingness to Join
7.4.4.6 Malaysia Carbon Credits Market Estimates and Forecast, 2020-2028 (USD Billion)
7.4.4.7.1 By Willingness to Join
7.4.4.7 Thailand Carbon Credits Market Estimates and Forecast, 2020-2028 (USD Billion)
7.4.4.7.1 By Willingness to Join
7.4.4.8 Indonesia Carbon Credits Market Estimates and Forecast, 2020-2028 (USD Billion)
7.4.4.8.1 By Willingness to Join
7.4.4.9 Vietnam Carbon Credits Market Estimates and Forecast, 2020-2028 (USD Billion)
7.4.4.9.1 By Willingness to Join
7.4.4.10 Taiwan Carbon Credits Market Estimates and Forecast, 2020-2028 (USD Billion)
7.4.4.10.1 By Willingness to Join
7.4.4.10.3 By End-use Industry
7.4.4.11 Rest of Asia Pacific Carbon Credits Market Estimates and Forecast, 2020-2028 (USD Billion)
7.4.4.11.1 By Willingness to Join
7.4.4.11.3 By End-use Industry
7.5 Middle East and Africa Carbon Credits Market Estimates and Forecast, 2020-2028 (USD Billion)
7.5.4.1 Saudi Arabia Carbon Credits Market Estimates and Forecast, 2020-2028 (USD Billion)
7.5.4.1.1 By Willingness to Join
7.5.4.2 U.A.E. Carbon Credits Market Estimates and Forecast, 2020-2028 (USD Billion)
7.5.4.2.1 By Willingness to Join
7.5.4.3 Israel Carbon Credits Market Estimates and Forecast, 2020-2028 (USD Billion)
7.5.4.3.1 By Willingness to Join
7.5.4.4 South Africa Carbon Credits Market Estimates and Forecast, 2020-2028 (USD Billion)
7.5.4.4.1 By Willingness to Join
7.5.4.5.1 By Willingness to Join
7.6 Central & South America Carbon Credits Market Estimates and Forecast, 2020-2028 (USD Billion)
7.7.4.1 Brazil Carbon Credits Market Estimates and Forecast, 2020-2028 (USD Billion)
7.7.4.1.1 By Willingness to Join
7.7.4.2 Argentina Carbon Credits Market Estimates and Forecast, 2020-2028 (USD Billion)
7.7.4.2.1 By Willingness to Join
7.7.4.3 Chile Carbon Credits Market Estimates and Forecast, 2020-2028 (USD Billion)
7.7.4.3.1 By Willingness to Join
7.7.4.4.1 By Willingness to Join
8.1 Company Market Share Analysis
8.2 Four Quadrant Positioning Matrix
8.4.1.1 Business Description & Financial Analysis
8.4.1.3 Products & Services Offered
8.4.1.4 Strategic Alliances between Business Partners
8.4.2.1 Business Description & Financial Analysis
8.4.2.3 Products & Services Offered
8.4.2.4 Strategic Alliances between Business Partners
8.4.3.1 Business Description & Financial Analysis
8.4.3.3 Products & Services Offered
8.4.3.4 Strategic Alliances between Business Partners
8.4.4 ClearSky Climate Solutions
8.4.4.1 Business Description & Financial Analysis
8.4.4.3 Products & Services Offered
8.4.4.4 Strategic Alliances between Business Partners
8.4.5 EKI Energy Services Ltd.
8.4.5.1 Business Description & Financial Analysis
8.4.5.3 Products & Services Offered
8.4.5.4 Strategic Alliances between Business Partners
8.4.7.1 Business Description & Financial Analysis
8.4.7.3 Products & Services Offered
8.4.7.4 Strategic Alliances between Business Partners
8.4.7.1 Business Description & Financial Analysis
8.4.7.3 Products & Services Offered
8.4.8.4 Strategic Alliances between Business Partners
8.4.8.1 Business Description & Financial Analysis
8.4.8.3 Products & Services Offered
8.4.8.4 Strategic Alliances between Business Partners
8.4.9.1 Business Description & Financial Analysis
8.4.9.3 Products & Services Offered
8.4.9.4 Strategic Alliances between Business Partners
8.4.10.1 Business Description & Financial Analysis
8.4.10.3 Products & Services Offered
8.4.10.4 Strategic Alliances between Business Partners
9.1.2 Market Scope & Segmentation
9.2.1.2 GMEs Internal Data Repository
9.2.1.3 Secondary Resources & Third Party Perspectives
9.2.1.4 Company Information Sources
9.2.2.1 Various Types of Respondents for Primary Interviews
9.2.2.2 Number of Interviews Conducted throughout the Research Process
9.2.2.4 Discussion Guide for Primary Participants
9.2.3.1 Expert Panels Across 30+ Industry
9.2.4.1 Paid Local Experts Across 30+ Industry Across each Region
9.3.1.1 Macro-Economic Indicators Considered
9.3.1.2 Micro-Economic Indicators Considered
9.3.2.1 Company Share Analysis Approach
9.3.2.2 Estimation of Potential Product Sales
9.4.2 Time Series, Cross Sectional & Panel Data Analysis
9.5.1 Inhouse AI Based Real Time Analytics Tool
9.5.2 Output From Desk & Primary Research
9.6 Research Assumptions & Limitations
LIST OF TABLES
1 Global Carbon Credits Market, By Willingness to Join, 2020-2028 (USD Billion)
2 Compliance Market, By Region, 2020-2028 (USD Billion)
3 Voluntary Market, By Region, 2020-2028 (USD Billion)
4 Global Carbon Credits Market, By Project Type, 2020-2028 (USD Billion)
5 Avoidance / Reduction Projects Market, By Region, 2020-2028 (USD Billion)
6 Removal / Sequestration Projects Market, By Region, 2020-2028 (USD Billion)
7 Other Products Market, By Region, 2020-2028 (USD Billion)
8 Global Carbon Credits Market, By End-use Industry, 2020-2028 (USD Billion)
9 Power Market, By Region, 2020-2028 (USD Billion)
10 Energy Market, By Region, 2020-2028 (USD Billion)
11 Aviation Market, By Region, 2020-2028 (USD Billion)
12 Transportation Market, By Region, 2020-2028 (USD Billion)
13 Other Industries Market, By Region, 2020-2028 (USD Billion)
14 Regional Analysis, 2020-2028 (USD Billion)
15 North America Carbon Credits Market, By Willingness to Join, 2020-2028 (USD Billion)
16 North America Carbon Credits Market, By Project Type, 2020-2028 (USD Billion)
17 North America Carbon Credits Market, By End-use Industry, 2020-2028 (USD Billion)
18 North America Carbon Credits Market, By Country, 2020-2028 (USD Billion)
19 U.S Carbon Credits Market, By Willingness to Join, 2020-2028 (USD Billion)
20 U.S Carbon Credits Market, By Project Type, 2020-2028 (USD Billion)
21 U.S Carbon Credits Market, By End-use Industry, 2020-2028 (USD Billion)
22 Canada Carbon Credits Market, By Willingness to Join, 2020-2028 (USD Billion)
23 Canada Carbon Credits Market, By Project Type, 2020-2028 (USD Billion)
24 Canada Carbon Credits Market, By End-use Industry, 2020-2028 (USD Billion)
25 Mexico Carbon Credits Market, By Willingness to Join, 2020-2028 (USD Billion)
26 Mexico Carbon Credits Market, By Project Type, 2020-2028 (USD Billion)
27 Mexico Carbon Credits Market, By End-use Industry, 2020-2028 (USD Billion)
28 Europe Carbon Credits Market, By Willingness to Join, 2020-2028 (USD Billion)
29 Europe Carbon Credits Market, By Project Type, 2020-2028 (USD Billion)
30 Europe Carbon Credits Market, By End-use Industry, 2020-2028 (USD Billion)
31 Germany Carbon Credits Market, By Willingness to Join, 2020-2028 (USD Billion)
32 Germany Carbon Credits Market, By Project Type, 2020-2028 (USD Billion)
33 Germany Carbon Credits Market, By End-use Industry, 2020-2028 (USD Billion)
34 U.K. Carbon Credits Market, By Willingness to Join, 2020-2028 (USD Billion)
35 U.K. Carbon Credits Market, By Project Type, 2020-2028 (USD Billion)
36 U.K. Carbon Credits Market, By End-use Industry, 2020-2028 (USD Billion)
37 France Carbon Credits Market, By Willingness to Join, 2020-2028 (USD Billion)
38 France Carbon Credits Market, By Project Type, 2020-2028 (USD Billion)
39 France Carbon Credits Market, By End-use Industry, 2020-2028 (USD Billion)
40 Italy Carbon Credits Market, By Willingness to Join, 2020-2028 (USD Billion)
41 Italy Carbon Credits Market, By T Project Type Type, 2020-2028 (USD Billion)
42 Italy Carbon Credits Market, By End-use Industry, 2020-2028 (USD Billion)
43 Spain Carbon Credits Market, By Willingness to Join, 2020-2028 (USD Billion)
44 Spain Carbon Credits Market, By Project Type, 2020-2028 (USD Billion)
45 Spain Carbon Credits Market, By End-use Industry, 2020-2028 (USD Billion)
46 Rest Of Europe Carbon Credits Market, By Willingness to Join, 2020-2028 (USD Billion)
47 Rest Of Europe Carbon Credits Market, By Project Type, 2020-2028 (USD Billion)
48 Rest of Europe Carbon Credits Market, By End-use Industry, 2020-2028 (USD Billion)
49 Asia Pacific Carbon Credits Market, By Willingness to Join, 2020-2028 (USD Billion)
50 Asia Pacific Carbon Credits Market, By Project Type, 2020-2028 (USD Billion)
51 Asia Pacific Carbon Credits Market, By End-use Industry, 2020-2028 (USD Billion)
52 Asia Pacific Carbon Credits Market, By Country, 2020-2028 (USD Billion)
53 China Carbon Credits Market, By Willingness to Join, 2020-2028 (USD Billion)
54 China Carbon Credits Market, By Project Type, 2020-2028 (USD Billion)
55 China Carbon Credits Market, By End-use Industry, 2020-2028 (USD Billion)
56 India Carbon Credits Market, By Willingness to Join, 2020-2028 (USD Billion)
57 India Carbon Credits Market, By Project Type, 2020-2028 (USD Billion)
58 India Carbon Credits Market, By End-use Industry, 2020-2028 (USD Billion)
59 Japan Carbon Credits Market, By Willingness to Join, 2020-2028 (USD Billion)
60 Japan Carbon Credits Market, By Project Type, 2020-2028 (USD Billion)
61 Japan Carbon Credits Market, By End-use Industry, 2020-2028 (USD Billion)
62 South Korea Carbon Credits Market, By Willingness to Join, 2020-2028 (USD Billion)
63 South Korea Carbon Credits Market, By Project Type, 2020-2028 (USD Billion)
64 South Korea Carbon Credits Market, By End-use Industry, 2020-2028 (USD Billion)
65 Middle East and Africa Carbon Credits Market, By Willingness to Join, 2020-2028 (USD Billion)
66 Middle East and Africa Carbon Credits Market, By Project Type, 2020-2028 (USD Billion)
67 Middle East and Africa Carbon Credits Market, By End-use Industry, 2020-2028 (USD Billion)
68 Middle East and Africa Carbon Credits Market, By Country, 2020-2028 (USD Billion)
69 Saudi Arabia Carbon Credits Market, By Willingness to Join, 2020-2028 (USD Billion)
70 Saudi Arabia Carbon Credits Market, By Project Type, 2020-2028 (USD Billion)
71 Saudi Arabia Carbon Credits Market, By End-use Industry, 2020-2028 (USD Billion)
72 UAE Carbon Credits Market, By Willingness to Join, 2020-2028 (USD Billion)
73 UAE Carbon Credits Market, By Project Type, 2020-2028 (USD Billion)
74 UAE Carbon Credits Market, By End-use Industry, 2020-2028 (USD Billion)
75 Central & South America Carbon Credits Market, By Willingness to Join, 2020-2028 (USD Billion)
76 Central & South America Carbon Credits Market, By Project Type, 2020-2028 (USD Billion)
77 Central & South America Carbon Credits Market, By End-use Industry, 2020-2028 (USD Billion)
78 Central & South America Carbon Credits Market, By Country, 2020-2028 (USD Billion)
79 Brazil Carbon Credits Market, By Willingness to Join, 2020-2028 (USD Billion)
80 Brazil Carbon Credits Market, By Project Type, 2020-2028 (USD Billion)
81 Brazil Carbon Credits Market, By End-use Industry, 2020-2028 (USD Billion)
82 3Degrees Group Inc.: Products & Services Offering
83 Carbon Care Asia Ltd.: Products & Services Offering
84 CarbonBetter: Products & Services Offering
85 ClearSky Climate Solutions: Products & Services Offering
86 EKI Energy Services Ltd.: Products & Services Offering
87 FINITE CARBON: Products & Services Offering
88 NativeEnergy : Products & Services Offering
89 South Pole Group: Products & Services Offering
90 WGL Holdings Inc., Inc: Products & Services Offering
91 Other Companies: Products & Services Offering
LIST OF FIGURES
1 Global Carbon Credits Market Overview
2 Global Carbon Credits Market Value From 2020-2028 (USD Billion)
3 Global Carbon Credits Market Share, By Willingness to Join (2022)
4 Global Carbon Credits Market Share, By Project Type (2022)
5 Global Carbon Credits Market Share, By End-use Industry (2022)
6 Global Carbon Credits Market, By Region (Asia Pacific Market)
7 Technological Trends In Global Carbon Credits Market
8 Four Quadrant Competitor Positioning Matrix
9 Impact Of Macro & Micro Indicators On The Market
10 Impact Of Key Drivers On The Global Carbon Credits Market
11 Impact Of Challenges On The Global Carbon Credits Market
12 Porter’s Five Forces Analysis
13 Global Carbon Credits Market: By Willingness to Join Scope Key Takeaways
14 Global Carbon Credits Market, By Willingness to Join Segment: Revenue Growth Analysis
15 Compliance Market, By Region, 2020-2028 (USD Billion)
16 Voluntary Market, By Region, 2020-2028 (USD Billion)
17 Global Carbon Credits Market: By Project Type Scope Key Takeaways
18 Global Carbon Credits Market, By Project Type Segment: Revenue Growth Analysis
19 Avoidance / Reduction Projects Market, By Region, 2020-2028 (USD Billion)
20 Removal / Sequestration Projects Market, By Region, 2020-2028 (USD Billion)
21 Other Products Market, By Region, 2020-2028 (USD Billion)
22 Global Carbon Credits Market: By End-use Industry Scope Key Takeaways
23 Global Carbon Credits Market, By End-use Industry Segment: Revenue Growth Analysis
24 Power Market, By Region, 2020-2028 (USD Billion)
25 Energy Market, By Region, 2020-2028 (USD Billion)
26 Aviation Market, By Region, 2020-2028 (USD Billion)
27 Transportation Market, By Region, 2020-2028 (USD Billion)
28 Other Industries Market, By Region, 2020-2028 (USD Billion)
29 Regional Segment: Revenue Growth Analysis
30 Global Carbon Credits Market: Regional Analysis
31 North America Carbon Credits Market Overview
32 North America Carbon Credits Market, By Willingness to Join
33 North America Carbon Credits Market, By Project Type
34 North America Carbon Credits Market, By End-use Industry
35 North America Carbon Credits Market, By Country
36 U.S. Carbon Credits Market, By Willingness to Join
37 U.S. Carbon Credits Market, By Project Type
38 U.S. Carbon Credits Market, By End-use Industry
39 Canada Carbon Credits Market, By Willingness to Join
40 Canada Carbon Credits Market, By Project Type
41 Canada Carbon Credits Market, By End-use Industry
42 Mexico Carbon Credits Market, By Willingness to Join
43 Mexico Carbon Credits Market, By Project Type
44 Mexico Carbon Credits Market, By End-use Industry
45 Four Quadrant Positioning Matrix
46 Company Market Share Analysis
47 3Degrees Group Inc.: Company Snapshot
48 3Degrees Group Inc.: SWOT Analysis
49 3Degrees Group Inc.: Geographic Presence
50 Carbon Care Asia Ltd.: Company Snapshot
51 Carbon Care Asia Ltd.: SWOT Analysis
52 Carbon Care Asia Ltd.: Geographic Presence
53 CarbonBetter: Company Snapshot
54 CarbonBetter: SWOT Analysis
55 CarbonBetter: Geographic Presence
56 ClearSky Climate Solutions: Company Snapshot
57 ClearSky Climate Solutions: Swot Analysis
58 ClearSky Climate Solutions: Geographic Presence
59 EKI Energy Services Ltd.: Company Snapshot
60 EKI Energy Services Ltd.: SWOT Analysis
61 EKI Energy Services Ltd.: Geographic Presence
62 Finite Carbon: Company Snapshot
63 Finite Carbon: SWOT Analysis
64 Finite Carbon: Geographic Presence
65 NativeEnergy : Company Snapshot
66 NativeEnergy : SWOT Analysis
67 NativeEnergy : Geographic Presence
68 South Pole Group: Company Snapshot
69 South Pole Group: SWOT Analysis
70 South Pole Group: Geographic Presence
71 WGL Holdings Inc., Inc.: Company Snapshot
72 WGL Holdings Inc., Inc.: SWOT Analysis
73 WGL Holdings Inc., Inc.: Geographic Presence
74 Other Companies: Company Snapshot
75 Other Companies: SWOT Analysis
76 Other Companies: Geographic Presence
The Global Carbon Credit Market has been studied from the year 2019 till 2028. However, the CAGR provided in the report is from the year 2023 to 2028. The research methodology involved three stages: Desk research, Primary research, and Analysis & Output from the entire research process.

The desk research involved a robust background study which meant referring to paid and unpaid databases to understand the market dynamics; mapping contracts from press releases; identifying the key players in the market, studying their product portfolio, competition level, annual reports/SEC filings & investor presentations; and learning the demand and supply-side analysis for the Carbon Credit Market.

The primary research activity included telephonic conversations with more than 50 tier 1 industry consultants, distributors, and end-use product manufacturers.

Finally, based on the above thorough research process, an in-depth analysis was carried out considering the following aspects: market attractiveness, current & future market trends, market share analysis, SWOT analysis of the company and customer analytics.

Frequently Asked Questions

This FREE sample includes market data points, ranging from trend analyses to market estimates & forecasts. See for yourself.
Or view our licence options:
Tailor made solutions just for you
80% of our clients seek made-to-order reports. How do you want us to tailor yours?
OUR CLIENTS


