This report was recently updated on August 20 2025 with the latest and most recent
market numbers
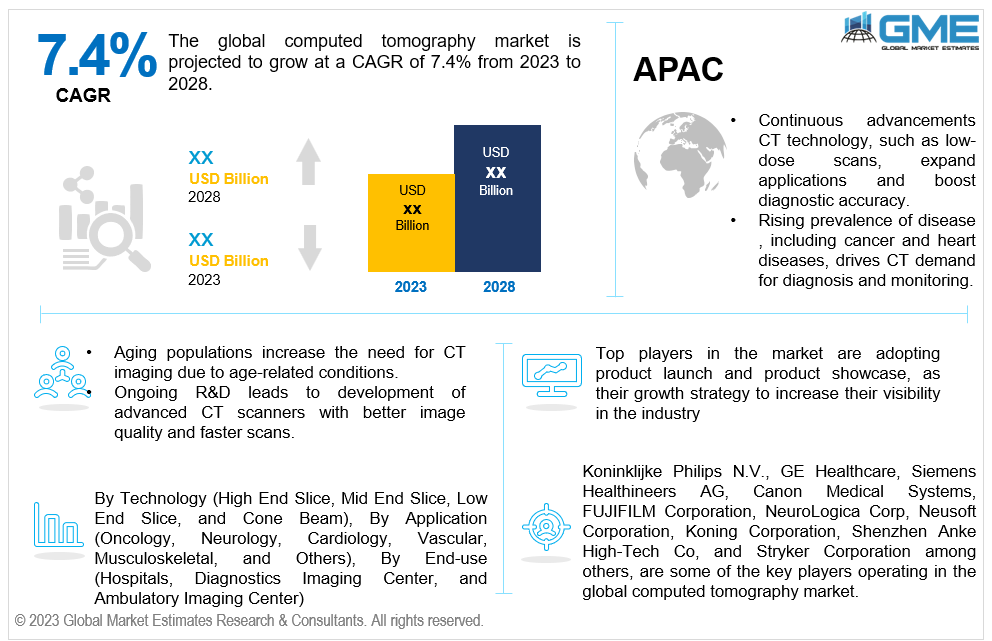
Global Computed Tomography Market Size, Trends & Analysis - Forecasts to 2028 By Technology (High End Slice, Mid End Slice, Low End Slice, and Cone Beam), By Application (Oncology, Neurology, Cardiology, Vascular, Musculoskeletal, and Others), By End-use (Hospitals, Diagnostics Imaging Center, and Ambulatory Imaging Center), and By Region (North America, Asia Pacific, Central and South America, Europe, and Middle East and Africa), Competitive Landscape, Company Market Share Analysis, and End User Analysis
The global computed tomography market is projected to grow at a CAGR of 7.4% from 2023 to 2028.
CT scans are gaining popularity due to their non-invasive nature and capacity to generate three-dimensional images, making them suitable for both patients and healthcare professionals. The enhancement of healthcare facilities and the availability of healthcare services in developing regions have increased the number of CT scans for the patients.
Continuous advancements in CT technology, such as the development of low-dose CT scans, dual-source CT, and spectral CT, have expanded the range of applications and improved diagnostic accuracy. The incorporation of artificial intelligence (AI) and machine learning into CT technology has the capability to increase diagnostic precision and effectiveness, further promoting its usage. For instance, in May 2023, Philips introduced new AI- driven CT system, the Philips CT 3500. The new system is specifically created to fulfill the needs of regular radiology procedures and screening programs with high patient volume.
The increasing incidence of various medical conditions, including cancer, cardiovascular diseases, and neurological disorders, has driven the demand for CT scans as they are essential for diagnosis, treatment planning, and monitoring disease progression. According to the World Health Organization (WHO), in the year 2020, cancer was responsible for approximately 10 million fatalities on a global scale.
Moreover, the global aging population which is more prone to chronic diseases and age-related conditions, increasing the need for diagnostic imaging technologies like CT scans. According to the World Health Organization (WHO), in 2030, it is anticipated that one-sixth of the world's population will be 60 years old or older, marking an increase from 1 billion in 2020 to 1.4 billion.
High-end slice segment is expected to hold the largest share in the market. High-end slice technology offers a significant advantage, with approximately 80% less radiation exposure compared to mid-range slice technology (64 slices) and a 16 cm imaging area, enhancing accuracy. Moreover, high-end slice devices are capable of providing detailed images even for obese patients.
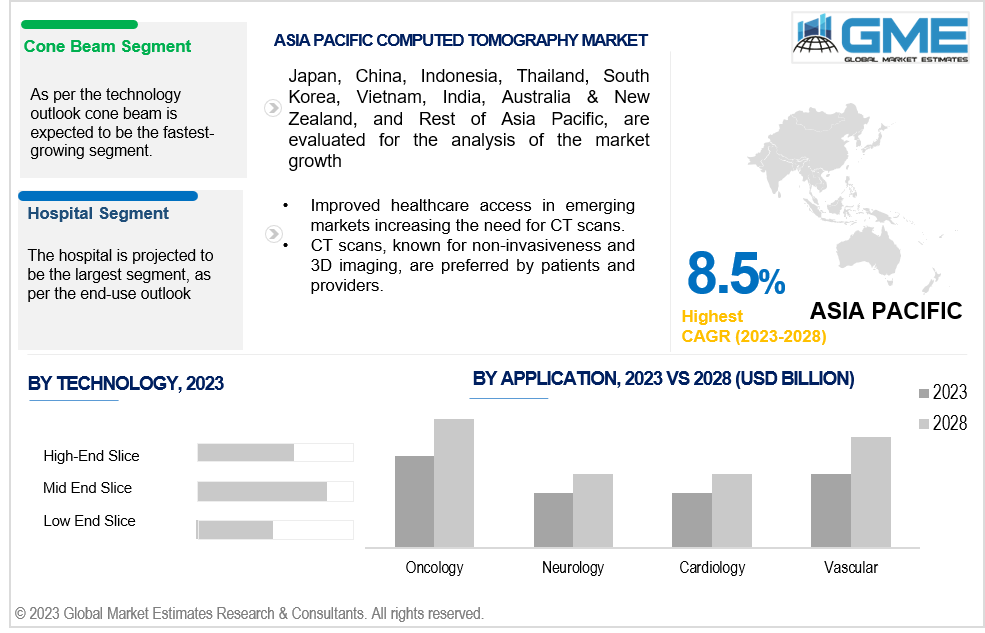
Cone beam is expected to be the fastest-growing segment in the market from 2023-2028. This technique offers several advantages, including its compact size, reduced radiation exposure, and cost-effectiveness when compared to traditional CT scans. CBCT's capability to provide 3D assessments of the maxillofacial area has resulted in a rising demand for its use in the field of dentistry. The expanding range of applications for CBCT is anticipated to drive the overall CT market growth during the forecast period.
Oncology segment is expected to hold the largest share of the market. Increasing prevalence of cancer and the expanding use of CT scans for diagnosing various forms of cancer, such as detecting lumps and tumors is the major factor contributing to the segment growth. The introduction of advanced technologies like computer-aided detection and computer-aided diagnosis for identifying suspicious cancer nodules and assessing malignancy risk, especially in cases of lung cancer, is expected to further stimulate segment growth. Additionally, this software can accurately correlate the captured image with biopsy results, enhancing diagnostic precision.
Musculoskeletal is anticipated to be the fastest-growing segment in the market from 2023-2028. This is primarily attributed to the growing prevalence of age-related illnesses due to the rising elderly population. Elderly individuals, due to a decrease in mobility with age, are at a higher risk of falls and various types of fractures, particularly hip fractures. Additionally, the global increase in participation in sports activities has led to a greater incidence of injuries, with ligament tears. In such cases, CT scans serve as effective diagnostic tools. Collectively, these factors are expected to fuel segment growth.
The hospital segment holds the largest share of the market. The growth is attributed to the rising volume of emergency admissions in hospitals and the increasing number of annual surgeries performed, which have collectively contributed to this significant market share. Furthermore, CT scans play a crucial role in hospitals by facilitating accurate pre-operative and post-operative diagnoses, helping determine the efficacy of treatments. The challenges and risks associated with transporting critically ill patients from hospitals to third-party diagnostic centers for CT scans have prompted many hospitals to establish their CT scan machines.
Ambulatory diagnostic centers is anticipated to be the fastest-growing segment in the market from 2023-2028. According to OECD statistics, there were 16 CT scanners per 1,000,000 residents in ambulatory diagnostic centers in the United States. This development is expected to bring about a significant transformation in the market by making CT scans more cost-effective and readily available to a broader population.
North America is expected to be the largest region in the market. The key reasons boosting the market growth in this region include increasing number of key players and the increasing incidence of cancer. According to data from the National Cancer Institute, approximately 1,806,590 new cancer cases were diagnosed in the United States in 2020. Additionally, the introduction of cutting-edge technologies, including artificial intelligence, and the frequent release of low-radiation CT scans are expected to further contribute to the expansion of the market in the North America region.
Asia Pacific is predicted to witness rapid growth during the forecast period. This growth can be attributed to the ongoing development of healthcare infrastructure, particularly in emerging economies like India and China, and the widespread adoption of advanced medical imaging devices. Additionally, the rising incidence of chronic diseases and the presence of local manufacturers are expected to contribute to market expansion. For instance, in April 2022 Siemens Healthineers established a new production unit for CT scanners in India to meet the increasing demand for such equipment and strengthen its market presence.
Koninklijke Philips N.V., GE Healthcare, Siemens Healthineers AG,Canon Medical Systems, FUJIFILM Corporation, NeuroLogica Corp, Neusoft Corporation, Koning Corporation, Shenzhen Anke High-Tech Co, and Stryker Corporation among others, are some of the key players operating in the global computed tomography market.
Please note: This is not an exhaustive list of companies profiled in the report.
In April 2022, Wipro GE Healthcare introduced the Revolution Aspire CT scanner, designed to enhance patient throughput by nearly 50% while simultaneously improving clinical efficiency and image quality. This equipment is set to be accessible in smaller cities and towns of India, particularly in 2 and 3-tier cities.
1 STRATEGIC INSIGHTS ON NEW REVENUE POCKETS
1.1 Strategic Opportunity & Attractiveness Analysis
1.1.1 Hot Revenue Pockets
1.1.2 Market Attractiveness Score
1.1.3 Revenue Impacting Opportunity
1.1.4 High Growing Region/Country
1.1.5 Competitor Analysis
1.1.6 Consumer Analysis
1.2 Global Market Estimates' View
1.3 Strategic Insights across Business Functions
1.3.1 For Chief Executive Officers
1.3.2 For Chief Marketing Officers
1.3.3 For Chief Strategy Officers
1.4 Evaluate the Potential of your Existing Business Lines vs. New Lines to Enter Into
2 TECHNOLOGICAL TRENDS
2.1 Technological Adoption Rate
2.2 Current Trend Impact Analysis
2.3 Future Trend Impact Analysis
3 GLOBAL COMPUTED TOMOGRAPHY MARKET OUTLOOK
3.1 Market Pyramid Analysis
3.1.1 Introduction
3.1.2 Adjacent Market Opportunities
3.1.3 Ancillary Market Opportunities
3.2 Demand Side Analysis
3.2.1 Market Drivers: Impact Analysis
3.2.2 Market Restraints: Impact Analysis
3.2.3 Market Opportunities: Impact Analysis
3.2.4 Market Challenges: Impact Analysis
3.3 Supply Side Analysis
3.3.1 Porter’s Five Forces Analysis
3.3.1.1 Threat of New Entrants
3.3.1.2 Threat of New Substitutes
3.3.1.3 Bargaining Power of Suppliers
3.3.1.4 Bargaining Power of Buyers
3.3.1.5 Intensity of Competitive Rivalry
3.3.2 SWOT Analysis; By Factor (Political & Legal, Economic, and Technological)
3.3.2.1 Political Landscape
3.3.2.2 Economic Landscape
3.3.2.3 Social Landscape
3.3.2.4 Technology Landscape
3.3.3 Value Chain Analysis
3.3.4 Trend Analysis
3.3.5 Gap Analysis
3.3.6 Cost Analysis
4 GLOBAL COMPUTED TOMOGRAPHY MARKET, BY APPLICATION
4.1 Introduction
4.2 Computed Tomography Market: Application Scope Key Takeaways
4.3 Revenue Growth Analysis, 2022 & 2028
4.4 Oncology
4.4.1 Oncology Market Estimates and Forecast, 2020-2028 (USD Million)
4.5 Neurology
4.5.1 Neurology Market Estimates and Forecast, 2020-2028 (USD Million)
4.6 Cardiology
4.6.1 Cardiology Market Estimates and Forecast, 2020-2028 (USD Million)
4.7 Vascular
4.7.1 Vascular Market Estimates and Forecast, 2020-2028 (USD Million)
4.8 Musculoskeletal
4.8.1 Musculoskeletal Market Estimates and Forecast, 2020-2028 (USD Million)
4.9 Others
4.9.1 Others Market Estimates and Forecast, 2020-2028 (USD Million)
5 GLOBAL COMPUTED TOMOGRAPHY MARKET, BY END-USE
5.1 Introduction
5.2 Computed Tomography Market: End-use Scope Key Takeaways
5.3 Revenue Growth Analysis, 2022 & 2028
5.4 Hospitals
5.4.1 Hospitals Market Estimates and Forecast, 2020-2028 (USD Million)
5.5 Diagnostic Imaging Centers
5.5.1 Diagnostic Imaging Centers Market Estimates and Forecast, 2020-2028 (USD Million)
5.6 Ambulatory Imaging Centers
5.6.1 Ambulatory Imaging Centers Market Estimates and Forecast, 2020-2028 (USD Million)
6 GLOBAL COMPUTED TOMOGRAPHY MARKET, BY TECHNOLOGY
6.1 Introduction
6.2 Computed Tomography Market: Technology Scope Key Takeaways
6.3 Revenue Growth Analysis, 2022 & 2028
6.4 High-End Slice
6.4.1 High-End Slice Market Estimates and Forecast, 2020-2028 (USD Million)
6.5 Mid End Slice
6.5.1 Mid End Slice Market Estimates and Forecast, 2020-2028 (USD Million)
6.6 Low End Slice
6.6.1 Low End Slice Market Estimates and Forecast, 2020-2028 (USD Million)
6.7 Cone Beam
6.7.1 Cone Beam Market Estimates and Forecast, 2020-2028 (USD Million)
7 GLOBAL COMPUTED TOMOGRAPHY MARKET, BY REGION
7.1 Introduction
7.2 North America Computed Tomography Market Estimates and Forecast, 2020-2028 (USD Million)
7.2.1 By Application
7.2.2 By End-use
7.2.3 By Technology
7.2.4 By Country
7.2.4.1 U.S. Computed Tomography Market Estimates and Forecast, 2020-2028 (USD Million)
7.2.4.1.1 By Application
7.2.4.1.2 By End-use
7.2.4.1.3 By Technology
7.2.4.2 Canada Computed Tomography Market Estimates and Forecast, 2020-2028 (USD Million)
7.2.4.2.1 By Application
7.2.4.2.2 By End-use
7.2.4.2.3 By Technology
7.2.4.3 Mexico Computed Tomography Market Estimates and Forecast, 2020-2028 (USD Million)
7.2.4.3.1 By Application
7.2.4.3.2 By End-use
7.2.4.3.3 By Technology
7.3 Europe Computed Tomography Market Estimates and Forecast, 2020-2028 (USD Million)
7.3.1 By Application
7.3.2 By End-use
7.3.3 By Technology
7.3.4 By Country
7.3.4.1 Germany Computed Tomography Market Estimates and Forecast, 2020-2028 (USD Million)
7.3.4.1.1 By Application
7.3.4.1.2 By End-use
7.3.4.1.3 By Technology
7.3.4.2 U.K. Computed Tomography Market Estimates and Forecast, 2020-2028 (USD Million)
7.3.4.2.1 By Application
7.3.4.2.2 By End-use
7.3.4.2.3 By Technology
7.3.4.3 France Computed Tomography Market Estimates and Forecast, 2020-2028 (USD Million)
7.3.4.3.1 By Application
7.3.4.3.2 By End-use
7.3.4.3.3 By Technology
7.3.4.4 Italy Computed Tomography Market Estimates and Forecast, 2020-2028 (USD Million)
7.3.4.4.1 By Application
7.3.4.4.2 By End-use
7.2.4.4.3 By Technology
7.3.4.5 Spain Computed Tomography Market Estimates and Forecast, 2020-2028 (USD Million)
7.3.4.5.1 By Application
7.3.4.5.2 By End-use
7.2.4.5.3 By Technology
7.3.4.6 Netherlands Computed Tomography Market Estimates and Forecast, 2020-2028 (USD Million)
7.3.4.6.1 By Application
7.3.4.6.2 By End-use
7.2.4.6.3 By Technology
7.3.4.7 Rest of Europe Computed Tomography Market Estimates and Forecast, 2020-2028 (USD Million)
7.3.4.7.1 By Application
7.3.4.7.2 By End-use
7.2.4.7.3 By Technology
7.4 Asia Pacific Computed Tomography Market Estimates and Forecast, 2020-2028 (USD Million)
7.4.1 By Application
7.4.2 By End-use
7.4.3 By Technology
7.4.4 By Country
7.4.4.1 China Computed Tomography Market Estimates and Forecast, 2020-2028 (USD Million)
7.4.4.1.1 By Application
7.4.4.1.2 By End-use
7.4.4.1.3 By Technology
7.4.4.2 Japan Computed Tomography Market Estimates and Forecast, 2020-2028 (USD Million)
7.4.4.2.1 By Application
7.4.4.2.2 By End-use
7.4.4.2.3 By Technology
7.4.4.3 India Computed Tomography Market Estimates and Forecast, 2020-2028 (USD Million)
7.4.4.3.1 By Application
7.4.4.3.2 By End-use
7.4.4.3.3 By Technology
7.4.4.4 South Korea Computed Tomography Market Estimates and Forecast, 2020-2028 (USD Million)
7.4.4.4.1 By Application
7.4.4.4.2 By End-use
7.4.4.4.3 By Technology
7.4.4.5 Singapore Computed Tomography Market Estimates and Forecast, 2020-2028 (USD Million)
7.4.4.5.1 By Application
7.4.4.5.2 By End-use
7.4.4.5.3 By Technology
7.4.4.6 Malaysia Computed Tomography Market Estimates and Forecast, 2020-2028 (USD Million)
7.4.4.6.1 By Application
7.4.4.6.2 By End-use
7.4.4.6.3 By Technology
7.4.4.7 Thailand Computed Tomography Market Estimates and Forecast, 2020-2028 (USD Million)
7.4.4.7.1 By Application
7.4.4.7.2 By End-use
7.4.4.7.3 By Technology
7.4.4.8 Indonesia Computed Tomography Market Estimates and Forecast, 2020-2028 (USD Million)
7.4.4.8.1 By Application
7.4.4.8.2 By End-use
7.4.4.8.3 By Technology
7.4.4.9 Vietnam Computed Tomography Market Estimates and Forecast, 2020-2028 (USD Million)
7.4.4.9.1 By Application
7.4.4.9.2 By End-use
7.4.4.9.3 By Technology
7.4.4.10 Taiwan Computed Tomography Market Estimates and Forecast, 2020-2028 (USD Million)
7.4.4.10.1 By Application
7.4.4.10.2 By End-use
7.4.4.10.3 By Technology
7.4.4.11 Rest of Asia Pacific Computed Tomography Market Estimates and Forecast, 2020-2028 (USD Million)
7.4.4.11.1 By Application
7.4.4.11.2 By End-use
7.4.4.11.3 By Technology
7.5 Middle East and Africa Computed Tomography Market Estimates and Forecast, 2020-2028 (USD Million)
7.5.1 By Application
7.5.2 By End-use
7.5.3 By Technology
7.5.4 By Country
7.5.4.1 Saudi Arabia Computed Tomography Market Estimates and Forecast, 2020-2028 (USD Million)
7.5.4.1.1 By Application
7.5.4.1.2 By End-use
7.5.4.1.3 By Technology
7.5.4.2 U.A.E. Computed Tomography Market Estimates and Forecast, 2020-2028 (USD Million)
7.5.4.2.1 By Application
7.5.4.2.2 By End-use
7.5.4.2.3 By Technology
7.5.4.3 Israel Computed Tomography Market Estimates and Forecast, 2020-2028 (USD Million)
7.5.4.3.1 By Application
7.5.4.3.2 By End-use
7.5.4.3.3 By Technology
7.5.4.4 South Africa Computed Tomography Market Estimates and Forecast, 2020-2028 (USD Million)
7.5.4.4.1 By Application
7.5.4.4.2 By End-use
7.5.4.4.3 By Technology
7.5.4.5 Rest of Middle East and Africa Computed Tomography Market Estimates and Forecast, 2020-2028 (USD Million)
7.5.4.5.1 By Application
7.5.4.5.2 By End-use
7.5.4.5.2 By Technology
7.6 Central and South America Computed Tomography Market Estimates and Forecast, 2020-2028 (USD Million)
7.6.1 By Application
7.6.2 By End-use
7.6.3 By Technology
7.6.4 By Country
7.6.4.1 Brazil Computed Tomography Market Estimates and Forecast, 2020-2028 (USD Million)
7.6.4.1.1 By Application
7.6.4.1.2 By End-use
7.6.4.1.3 By Technology
7.6.4.2 Argentina Eaporative Air Cooler Market Estimates and Forecast, 2020-2028 (USD Million)
7.6.4.2.1 By Application
7.6.4.2.2 By End-use
7.6.4.2.3 By Technology
7.6.4.3 Chile Computed Tomography Market Estimates and Forecast, 2020-2028 (USD Million)
7.6.4.3.1 By Application
7.6.4.3.2 By End-use
7.6.4.3.3 By Technology
7.6.4.4 Rest of Central & South America Computed Tomography Market Estimates and Forecast, 2020-2028 (USD Million)
7.6.4.4.1 By Application
7.6.4.4.2 By End-use
7.6.4.4.3 By Technology
8 COMPETITIVE LANDCAPE
8.1 Company Market Share Analysis
8.2 Four Quadrant Positioning Matrix
8.2.1 Market Leaders
8.2.2 Market Visionaries
8.2.3 Market Challengers
8.2.4 Niche Market Players
8.3 Vendor Landscape
8.3.1 North America
8.3.2 Europe
8.3.3 Asia Pacific
8.3.4 Rest of the World
8.4 Company Profiles
8.4.1 Koninklijke Philips N.V.
8.4.1.1 Business Description & Financial Analysis
8.4.1.2 SWOT Analysis
8.4.1.3 Products & Services Offered
8.4.1.4 Strategic Alliances between Business Partners
8.4.2 GE Healthcare
8.4.2.1 Business Description & Financial Analysis
8.4.2.2 SWOT Analysis
8.4.2.3 Products & Services Offered
8.4.2.4 Strategic Alliances between Business Partners
8.4.3 Siemens Healthineers
8.4.3.1 Business Description & Financial Analysis
8.4.3.2 SWOT Analysis
8.4.3.3 Products & Services Offered
8.4.3.4 Strategic Alliances between Business Partners
8.4.4 Canon Medical Systems
8.4.4.1 Business Description & Financial Analysis
8.4.4.2 SWOT Analysis
8.4.4.3 Products & Services Offered
8.4.4.4 Strategic Alliances between Business Partners
8.4.5 Fujifilm Holdings Corp.
8.4.5.1 Business Description & Financial Analysis
8.4.5.2 SWOT Analysis
8.4.5.3 Products & Services Offered
8.4.5.4 Strategic Alliances between Business Partners
8.4.6 Shenzhen Anke High-Tech Co
8.4.6.1 Business Description & Financial Analysis
8.4.6.2 SWOT Analysis
8.4.6.3 Products & Services Offered
8.4.6.4 Strategic Alliances between Business Partners
8.4.7 Koning Corp.
8.4.7.1 Business Description & Financial Analysis
8.4.7.2 SWOT Analysis
8.4.7.3 Products & Services Offered
8.4.8.4 Strategic Alliances between Business Partners
8.4.8 Neusoft Medical Systems Co. Ltd.
8.4.8.1 Business Description & Financial Analysis
8.4.8.2 SWOT Analysis
8.4.8.3 Products & Services Offered
8.4.8.4 Strategic Alliances between Business Partners
8.4.9 Stryker Corporation
8.4.9.1 Business Description & Financial Analysis
8.4.9.2 SWOT Analysis
8.4.9.3 Products & Services Offered
8.4.9.4 Strategic Alliances between Business Partners
8.4.10 NeuroLogica Corp
8.4.10.1 Business Description & Financial Analysis
8.4.10.2 SWOT Analysis
8.4.10.3 Products & Services Offered
8.4.10.4 Strategic Alliances between Business Partners
8.4.11 Other Companies
8.4.11.1 Business Description & Financial Analysis
8.4.11.2 SWOT Analysis
8.4.11.3 Products & Services Offered
8.4.11.4 Strategic Alliances between Business Partners
9 RESEARCH METHODOLOGY
9.1 Market Introduction
9.1.1 Market Definition
9.1.2 Market Scope & Segmentation
9.2 Information Procurement
9.2.1 Secondary Research
9.2.1.1 Purchased Databases
9.2.1.2 GMEs Internal Data Repository
9.2.1.3 Secondary Resources & Third Party Perspectives
9.2.1.4 Company Information Sources
9.2.2 Primary Research
9.2.2.1 Various Types of Respondents for Primary Interviews
9.2.2.2 Number of Interviews Conducted throughout the Research Process
9.2.2.3 Primary Stakeholders
9.2.2.4 Discussion Guide for Primary Participants
9.2.3 Expert Panels
9.2.3.1 Expert Panels Across 30+ Industry
9.2.4 Paid Local Experts
9.2.4.1 Paid Local Experts Across 30+ Industry Across each Region
9.3 Market Estimation
9.3.1 Top-Down Approach
9.3.1.1 Macro-Economic Indicators Considered
9.3.1.2 Micro-Economic Indicators Considered
9.3.2 Bottom Up Approach
9.3.2.1 Company Share Analysis Approach
9.3.2.2 Estimation of Potential Product Sales
9.4 Data Triangulation
9.4.1 Data Collection
9.4.2 Time Series, Cross Sectional & Panel Data Analysis
9.4.3 Cluster Analysis
9.5 Analysis and Output
9.5.1 Inhouse AI Based Real Time Analytics Tool
9.5.2 Output From Desk & Primary Research
9.6 Research Assumptions & Limitations
9.7.1 Research Assumptions
9.7.2 Research Limitations
LIST OF TABLES
1 Global Computed Tomography Market, By Application , 2020-2028 (USD Mllion)
2 Oncology Market, By Region, 2020-2028 (USD Mllion)
3 Neurology Market, By Region, 2020-2028 (USD Mllion)
4 Cardiology Market, By Region, 2020-2028 (USD Mllion)
5 Vascular Market, By Region, 2020-2028 (USD Mllion)
6 Musculoskeletal Market, By Region, 2020-2028 (USD Mllion)
7 Other Market, By Region, 2020-2028 (USD Mllion)
8 Global Computed Tomography Market, By End-use, 2020-2028 (USD Mllion)
9 Hospitals Market, By Region, 2020-2028 (USD Mllion)
10 Diagnostic Imaging Centers Market, By Region, 2020-2028 (USD Mllion)
11 Ambulatory Imaging Centers Market, By Region, 2020-2028 (USD Mllion)
12 Global Computed Tomography Market, By Technology, 2020-2028 (USD Mllion)
13 High-End Slice Market, By Region, 2020-2028 (USD Mllion)
14 Mid End Slice Market, By Region, 2020-2028 (USD Mllion)
15 Low End Slice Market, By Region, 2020-2028 (USD Mllion)
16 Cone beam Slice Market, By Region, 2020-2028 (USD Mllion)
17 Regional Analysis, 2020-2028 (USD Mllion)
18 North America Computed Tomography Market, By Application , 2020-2028 (USD Million)
19 North America Computed Tomography Market, By End-use, 2020-2028 (USD Million)
20 North America Computed Tomography Market, By Technology, 2020-2028 (USD Million)
21 North America Computed Tomography Market, By Country, 2020-2028 (USD Million)
22 U.S Computed Tomography Market, By Application , 2020-2028 (USD Million)
23 U.S Computed Tomography Market, By End-use, 2020-2028 (USD Million)
24 U.S Computed Tomography Market, By Technology, 2020-2028 (USD Million)
25 Canada Computed Tomography Market, By Application , 2020-2028 (USD Million)
26 Canada Computed Tomography Market, By End-use, 2020-2028 (USD Million)
27 Canada Computed Tomography Market, By Technology, 2020-2028 (USD Million)
28 Mexico Computed Tomography Market, By Application , 2020-2028 (USD Million)
29 Mexico Computed Tomography Market, By End-use, 2020-2028 (USD Million)
30 Mexico Computed Tomography Market, By Technology, 2020-2028 (USD Million)
31 Europe Computed Tomography Market, By Application , 2020-2028 (USD Million)
32 Europe Computed Tomography Market, By End-use, 2020-2028 (USD Million)
33 Europe Computed Tomography Market, By Technology, 2020-2028 (USD Million)
34 Europe Computed Tomography Market, By country, 2020-2028 (USD Million)
35 Germany Computed Tomography Market, By Application , 2020-2028 (USD Million)
36 Germany Computed Tomography Market, By End-use, 2020-2028 (USD Million)
37 Germany Computed Tomography Market, By Technology, 2020-2028 (USD Million)
38 U.K Computed Tomography Market, By Application , 2020-2028 (USD Million)
39 U.K Computed Tomography Market, By End-use, 2020-2028 (USD Million)
40 U.K Computed Tomography Market, By Technology, 2020-2028 (USD Million)
41 France Computed Tomography Market, By Application , 2020-2028 (USD Million)
42 France Computed Tomography Market, By End-use, 2020-2028 (USD Million)
43 France Computed Tomography Market, By Technology, 2020-2028 (USD Million)
44 Italy Computed Tomography Market, By Application , 2020-2028 (USD Million)
45 Italy Computed Tomography Market, By End Use , 2020-2028 (USD Million)
46 Italy Computed Tomography Market, By Technology, 2020-2028 (USD Million)
47 Spain Computed Tomography Market, By Application , 2020-2028 (USD Million)
48 Spain Computed Tomography Market, By End-use, 2020-2028 (USD Million)
49 Spain Computed Tomography Market, By Technology, 2020-2028 (USD Million)
50 Rest Of Europe Computed Tomography Market, By Application , 2020-2028 (USD Million)
51 Rest Of Europe Computed Tomography Market, By End-use, 2020-2028 (USD Million)
52 Rest of Europe Computed Tomography Market, By Technology, 2020-2028 (USD Million)
53 Asia Pacific Computed Tomography Market, By Application , 2020-2028 (USD Million)
54 Asia Pacific Computed Tomography Market, By End-use, 2020-2028 (USD Million)
55 Asia Pacific Computed Tomography Market, By Technology, 2020-2028 (USD Million)
56 Asia Pacific Computed Tomography Market, By Country, 2020-2028 (USD Million)
57 China Computed Tomography Market, By Application , 2020-2028 (USD Million)
58 China Computed Tomography Market, By End-use, 2020-2028 (USD Million)
59 China Computed Tomography Market, By Technology, 2020-2028 (USD Million)
60 India Computed Tomography Market, By Application , 2020-2028 (USD Million)
61 India Computed Tomography Market, By End-use, 2020-2028 (USD Million)
62 India Computed Tomography Market, By Technology, 2020-2028 (USD Million)
63 Japan Computed Tomography Market, By Application , 2020-2028 (USD Million)
64 Japan Computed Tomography Market, By End-use, 2020-2028 (USD Million)
65 Japan Computed Tomography Market, By Technology, 2020-2028 (USD Million)
66 South Korea Computed Tomography Market, By Application , 2020-2028 (USD Million)
67 South Korea Computed Tomography Market, By End-use, 2020-2028 (USD Million)
68 South Korea Computed Tomography Market, By Technology, 2020-2028 (USD Million)
69 Singapore Computed Tomography Market, By Application , 2020-2028 (USD Million)
70 Singapore Computed Tomography Market, By End-use, 2020-2028 (USD Million)
71 Singapore Computed Tomography Market, By Technology, 2020-2028 (USD Million)
72 Malaysia Computed Tomography Market, By Application , 2020-2028 (USD Million)
73 Malaysia Computed Tomography Market, By End-use, 2020-2028 (USD Million)
74 Malaysia Computed Tomography Market, By Technology, 2020-2028 (USD Million)
75 Thailand Computed Tomography Market, By Application , 2020-2028 (USD Million)
76 Thailand Computed Tomography Market, By End-use, 2020-2028 (USD Million)
77 Thailand Computed Tomography Market, By Technology, 2020-2028 (USD Million)
78 Indonesia Computed Tomography Market, By Application , 2020-2028 (USD Million)
79 Indonesia Computed Tomography Market, By End-use, 2020-2028 (USD Million)
80 Indonesia Computed Tomography Market, By Technology, 2020-2028 (USD Million)
81 Vietnam Computed Tomography Market, By Application , 2020-2028 (USD Million)
82 Vietnam Computed Tomography Market, By End-use, 2020-2028 (USD Million)
83 Vietnam Computed Tomography Market, By Technology, 2020-2028 (USD Million)
84 Taiwan Computed Tomography Market, By Application , 2020-2028 (USD Million)
85 Taiwan Computed Tomography Market, By End-use, 2020-2028 (USD Million)
86 Taiwan Computed Tomography Market, By Technology, 2020-2028 (USD Million)
87 Rest of Asia Pacific Computed Tomography Market, By Application , 2020-2028 (USD Million)
88 Rest of Asia Pacific Computed Tomography Market, By End-use, 2020-2028 (USD Million)
89 Rest of Asia Pacific Computed Tomography Market, By Technology, 2020-2028 (USD Million)
90 Middle East and Africa Computed Tomography Market, By Application , 2020-2028 (USD Million)
91 Middle East and Africa Computed Tomography Market, By End-use, 2020-2028 (USD Million)
92 Middle East and Africa Computed Tomography Market, By Technology, 2020-2028 (USD Million)
93 Middle East and Africa Computed Tomography Market, By Country, 2020-2028 (USD Million)
94 Saudi Arabia Computed Tomography Market, By Application , 2020-2028 (USD Million)
95 Saudi Arabia Computed Tomography Market, By End-use, 2020-2028 (USD Million)
96 Saudi Arabia Computed Tomography Market, By Technology, 2020-2028 (USD Million)
97 UAE Computed Tomography Market, By Application , 2020-2028 (USD Million)
98 UAE Computed Tomography Market, By End-use, 2020-2028 (USD Million)
99 UAE Computed Tomography Market, By Technology, 2020-2028 (USD Million)
100 Israel Computed Tomography Market, By Application , 2020-2028 (USD Million)
101 Israel Computed Tomography Market, By End-use, 2020-2028 (USD Million)
102 Israel Computed Tomography Market, By Technology, 2020-2028 (USD Million)
103 South Africa Computed Tomography Market, By Application , 2020-2028 (USD Million)
104 UAE South Africa Computed Tomography Market, By End-use, 2020-2028 (USD Million)
105 South Africa Computed Tomography Market, By Technology, 2020-2028 (USD Million)
106 Rest of Middle East and Africa Computed Tomography Market, By Application , 2020-2028 (USD Million)
107 Rest of Middle East and Africa Computed Tomography Market, By End-use, 2020-2028 (USD Million)
108 Rest of Middle East and Africa Computed Tomography Market, By Technology, 2020-2028 (USD Million)
109 Central and South America Computed Tomography Market, By Application , 2020-2028 (USD Million)
110 Central and South America Computed Tomography Market, By End-use, 2020-2028 (USD Million)
111 Central and South America Computed Tomography Market, By Technology, 2020-2028 (USD Million)
112 Central and South America Computed Tomography Market, By Country, 2020-2028 (USD Million)
113 Brazil Computed Tomography Market, By Application , 2020-2028 (USD Million)
114 Brazil Computed Tomography Market, By End-use, 2020-2028 (USD Million)
115 Brazil Computed Tomography Market, By Technology, 2020-2028 (USD Million)
116 Argentina Computed Tomography Market, By Application , 2020-2028 (USD Million)
117 Argentina Computed Tomography Market, By End-use, 2020-2028 (USD Million)
118 Argentina Computed Tomography Market, By Technology, 2020-2028 (USD Million)
119 Chile Computed Tomography Market, By Application , 2020-2028 (USD Million)
120 Chile Computed Tomography Market, By End-use, 2020-2028 (USD Million)
121 Chile Computed Tomography Market, By Technology, 2020-2028 (USD Million)
122 Rest of Central and South America Computed Tomography Market, By Application , 2020-2028 (USD Million)
123 Rest of Central and South America Computed Tomography Market, By End-use, 2020-2028 (USD Million)
124 Rest of Central and South America Computed Tomography Market, By Technology, 2020-2028 (USD Million)
125 Koninklijke Philips N.V.: Products & Services Offering
126 GE Healthcare: Products & Services Offering
127 Siemens Healthineers: Products & Services Offering
128 Canon Medical Systems: Products & Services Offering
129 Fujifilm Holdings Corp.: Products & Services Offering
130 SHENZHEN ANKE HIGH-TECH CO: Products & Services Offering
131 Koning Corp. : Products & Services Offering
132 Neusoft Medical Systems Co. Ltd.: Products & Services Offering
133 Stryker Corporation , Inc: Products & Services Offering
134 NeuroLogica Corp: Products & Services Offering
135 Other Companies: Products & Services Offering
LIST OF FIGURES
1 Global Computed Tomography Market Overview
2 Global Computed Tomography Market Value From 2020-2028 (USD Mllion)
3 Global Computed Tomography Market Share, By Application (2022)
4 Global Computed Tomography Market Share, By End-use (2022)
5 Global Computed Tomography Market Share, By Technology (2022)
6 Global Computed Tomography Market, By Region (Asia Pacific Market)
7 Technological Trends In Global Computed Tomography Market
8 Four Quadrant Competitor Positioning Matrix
9 Impact Of Macro & Micro Indicators On The Market
10 Impact Of Key Drivers On The Global Computed Tomography Market
11 Impact Of Challenges On The Global Computed Tomography Market
12 Porter’s Five Forces Analysis
13 Global Computed Tomography Market: By Application Scope Key Takeaways
14 Global Computed Tomography Market, By Application Segment: Revenue Growth Analysis
15 Oncology Market, By Region, 2020-2028 (USD Mllion)
16 Neurology Market, By Region, 2020-2028 (USD Mllion)
17 Cardiology Market, By Region, 2020-2028 (USD Mllion)
18 Vascular Market, By Region, 2020-2028 (USD Mllion)
19 Musculoskeletal Market, By Region, 2020-2028 (USD Mllion)
20 Others Market, By Region, 2020-2028 (USD Mllion)
21 Global Computed Tomography Market: By End-use Scope Key Takeaways
22 Global Computed Tomography Market, By End-use Segment: Revenue Growth Analysis
23 Hospitals Market, By Region, 2020-2028 (USD Mllion)
24 Diagnostic Imaging Centers Market, By Region, 2020-2028 (USD Mllion)
25 Ambulatory Imaging Centers Market, By Region, 2020-2028 (USD Mllion)
26 Global Computed Tomography Market: By Technology Scope Key Takeaways
27 Global Computed Tomography Market, By Technology Segment: Revenue Growth Analysis
28 High-End Slice Market, By Region, 2020-2028 (USD Mllion)
29 Mid End Slice Market, By Region, 2020-2028 (USD Mllion)
30 Low End Slice Market, By Region, 2020-2028 (USD Mllion)
31 Cone Beam Market, By Region, 2020-2028 (USD Mllion)
32 Regional Segment: Revenue Growth Analysis
33 Global Computed Tomography Market: Regional Analysis
34 North America Computed Tomography Market Overview
35 North America Computed Tomography Market, By Application
36 North America Computed Tomography Market, By End-use
37 North America Computed Tomography Market, By Technology
38 North America Computed Tomography Market, By Country
39 U.S. Computed Tomography Market, By Application
40 U.S. Computed Tomography Market, By End-use
41 U.S. Computed Tomography Market, By Technology
42 Canada Computed Tomography Market, By Application
43 Canada Computed Tomography Market, By End-use
44 Canada Computed Tomography Market, By Technology
45 Mexico Computed Tomography Market, By Application
46 Mexico Computed Tomography Market, By End-use
47 Mexico Computed Tomography Market, By Technology
48 Four Quadrant Positioning Matrix
49 Company Market Share Analysis
50 Koninklijke Philips N.V.: Company Snapshot
51 Koninklijke Philips N.V.: SWOT Analysis
52 Koninklijke Philips N.V.: Geographic Presence
53 GE Healthcare: Company Snapshot
54 GE Healthcare: SWOT Analysis
55 GE Healthcare: Geographic Presence
56 Siemens Healthineers: Company Snapshot
57 Siemens Healthineers: SWOT Analysis
58 Siemens Healthineers: Geographic Presence
59 Canon Medical Systems: Company Snapshot
60 Canon Medical Systems: Swot Analysis
61 Canon Medical Systems: Geographic Presence
62 Fujifilm Holdings Corp.: Company Snapshot
63 Fujifilm Holdings Corp.: SWOT Analysis
64 Fujifilm Holdings Corp.: Geographic Presence
65 Shenzhen Anke High-Tech Co: Company Snapshot
66 Shenzhen Anke High-Tech Co: SWOT Analysis
67 Shenzhen Anke High-Tech Co: Geographic Presence
68 Koning Corp. : Company Snapshot
69 Koning Corp. : SWOT Analysis
70 Koning Corp. : Geographic Presence
71 Neusoft Medical Systems Co. Ltd.: Company Snapshot
72 Neusoft Medical Systems Co. Ltd.: SWOT Analysis
73 Neusoft Medical Systems Co. Ltd.: Geographic Presence
74 Stryker Corporation , Inc.: Company Snapshot
75 Stryker Corporation , Inc.: SWOT Analysis
76 Stryker Corporation , Inc.: Geographic Presence
77 NeuroLogica Corp: Company Snapshot
78 NeuroLogica Corp: SWOT Analysis
79 NeuroLogica Corp: Geographic Presence
80 Other Companies: Company Snapshot
81 Other Companies: SWOT Analysis
82 Other Companies: Geographic Presence
The Global Computed Tomography Market has been studied from the year 2019 till 2028. However, the CAGR provided in the report is from the year 2023 to 2028. The research methodology involved three stages: Desk research, Primary research, and Analysis & Output from the entire research process.

The desk research involved a robust background study which meant referring to paid and unpaid databases to understand the market dynamics; mapping contracts from press releases; identifying the key players in the market, studying their product portfolio, competition level, annual reports/SEC filings & investor presentations; and learning the demand and supply-side analysis for the Computed Tomography Market.

The primary research activity included telephonic conversations with more than 50 tier 1 industry consultants, distributors, and end-use product manufacturers.

Finally, based on the above thorough research process, an in-depth analysis was carried out considering the following aspects: market attractiveness, current & future market trends, market share analysis, SWOT analysis of the company and customer analytics.

Frequently Asked Questions

This FREE sample includes market data points, ranging from trend analyses to market estimates & forecasts. See for yourself.
Or view our licence options:
Tailor made solutions just for you
80% of our clients seek made-to-order reports. How do you want us to tailor yours?
OUR CLIENTS


