This report was recently updated on July 5 2025 with the latest and most recent
market numbers
Global Continuous Integration Tools Market Size, Trends, and Analysis - Forecasts to 2026 By Deployment Mode (Cloud, On-Premises), By Organization Size (Large Enterprises, Small and Medium Sized Enterprises [SMEs]), By Vertical (BFSI, Retail, and eCommerce, Telecommunication, Education, Media and Entertainment, Healthcare, Manufacturing, Others [Government, Logistics and Transportation, and Energy and Utilities]), Region (North America, Asia Pacific, CSA, Europe, and the Middle East and Africa), End-Use Landscape, Company Market Share Analysis, and Competitor Analysis
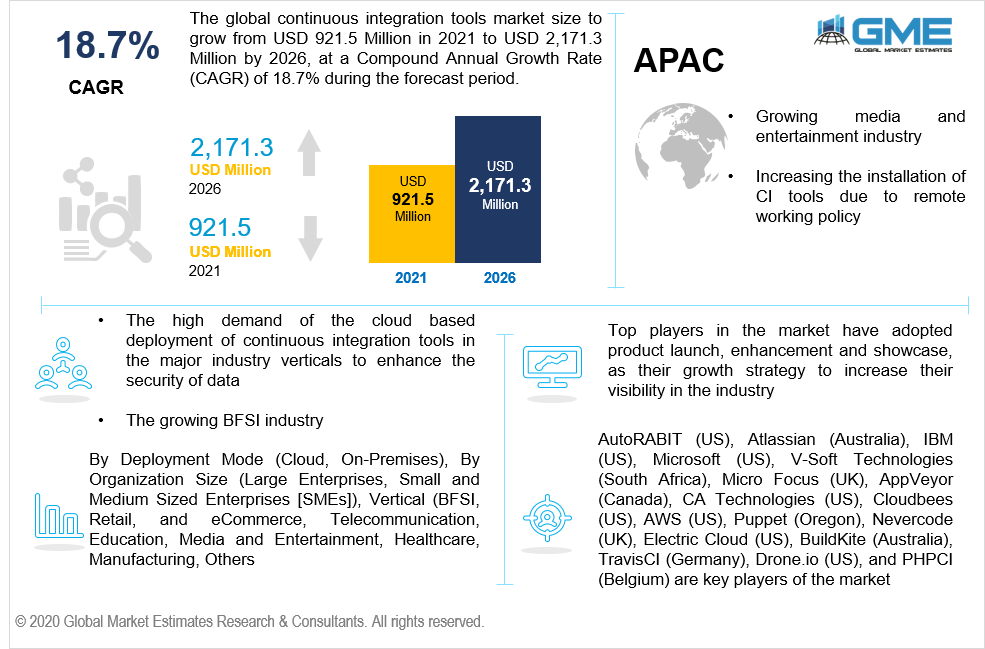
The global continuous integration tools market will grow from USD 921.5 million in 2021 to USD 2,171.3 million by 2026 at a CAGR value of 18.7%.
Automation of software allows quick release of software application. This is one of the prime factors contributing to the rising demand for continuous integration tools in the market during the forecast period of 2021 to 2026. The high demand of the cloud based deployment of continuous integration tools in the major industry verticals to enhance the security of data is anticipated to boost the growth of the market.
The flourishing industry of software and automation makes it crucial for the industries to integrate all advancements into their systems to cope up with the fast-moving trends. Continuous integration tool is a development practice that allows the code developers to integrate several codes into depositories. This process and the tool enable the developer to identify the system's errors and find the solution to fix them. The CI tool is the best approach for developing software in the systems and has its own set of principles to guide the procedure.
The continuous integration tools facilitate the developers to work with small sections of code at a particular time. Handling small chunks of codes at a time facilitates ease and smooth handling as compared to managing massive code sets in a single go. Controlling fewer codes at a single time also ensures less risk of errors in the future as compared to control vast chunks of coding. The CI tool enables the developer to immediately initiate the testing of these fewer groups of codes as they are integrated into the system depositories.
The most utilized CI tools feature is that they allow the developer to design their systems to restrict and build limits on the number of errors to occur and achieves faster resolutions on the errors. Software-based programming is vulnerable to unanticipated breakdowns and shocks, which the developers can avoid by installing the continuous integration tools into their systems. Approximately 57% of the industry players across the globe have continuous integration tools installed into their systems.
Many companies adopted software-based programs to operate their plant during pandemic and lockdown period by controlling the software solutions and plant activities remotely. These software-based systems have in turn help increase the installation of continuous integration tools in various industries across different verticals during COVID-19 pandemic. Hence, the market is ought to be growing rapidly during the forecast period.
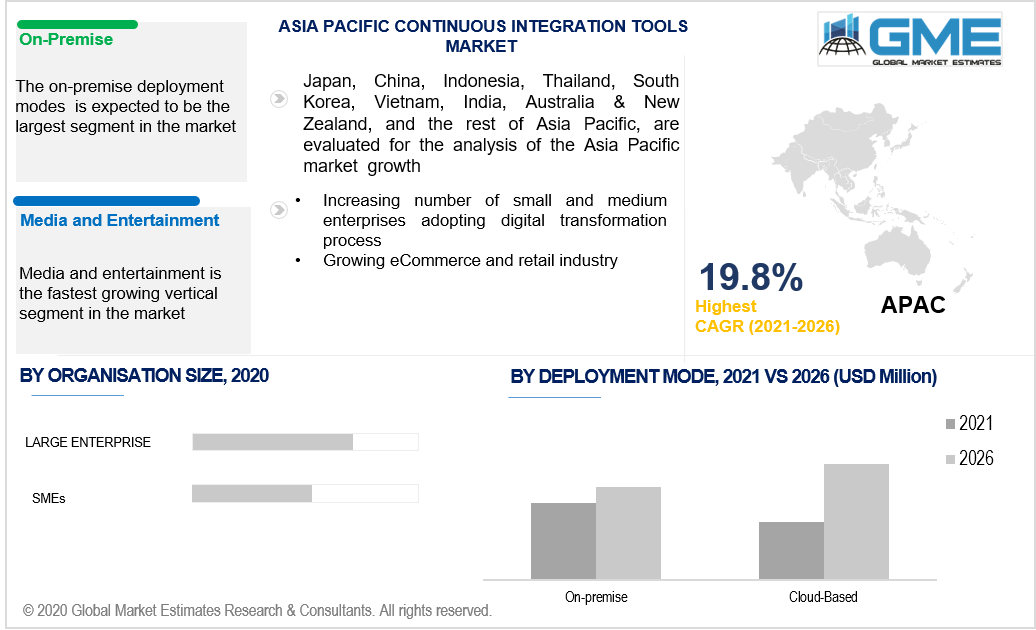
Based on deployment mode, the market is segmented into cloud, and on-premises. The on-premise deployment modes are being used in the majority of the industries and verticals and hence on-premise segment is expected to be the largest segment in the market.
On-premise modes enables the developers or industry players to be their own host and have absolute control over the system. They can regulate, undertake changes, or make up-gradation into the maintenance of the systems without worrying about the host authorities' feasibilities. Most of the industries deal with tremendous amounts of datasets that include details of their system and their customer base. Dealing with external hosts can bring risks and a lack of security to maintain the privacy features, and thus, the industry players prefer on-premise deployment modes.
Based on organization size, the market is segmented into large enterprises, small and medium sized enterprises [SMEs]. The adoption of continuous integration tools within large enterprises is comparatively more than in the small and medium enterprises and hence the share of large enterprises is the highest in the market.
Large enterprises have higher investments and massive cloud-based programming systems that require the use of CI tools. However, small and medium enterprises are adopting the automation and software trends and this segment is expected to grow the fastest in the market.
Based on verticals, the market is segmented into BFSI, retail, and ecommerce, telecommunication, education, media and entertainment, healthcare, manufacturing, and others [others include government, logistics and transportation, and energy and utilities].
Media and entertainment platforms yearly produce numerous movies, videos, audios, games, pod casts or press releases, which are highly driven by software-based programming. Moreover, the media and entertainment business is drastically transforming itself into a digitalized industry. This measure brings combined effects of software programming and IT solutions into the media and entertainment industry, thus requiring continuous integration tools to regulate the system's errors and maintain its efficiency. Hence, the media and entertainment segment will be the fastest growing segment in the market.
Based on region, the market can be segmented into various regions such as North America, Europe, Central and South America, Middle East and Africa, and Asia Pacific regions.
North American region is expected to be the largest segment in the continuous integration tools market from 2021 to 2026. North America is the most prominent region in software and technological applications. The dominant countries like the USA and Canada have been implementing continuous integration tools in almost all of their verticals.
The tremendously growing media and entertainment industry in the countries like India, South Korea, China, and Japan, is supporting the rising demand for the installation of CI tools in these countries and hence APAC is analyzed to be the fastest growing segment in the market.
AutoRABIT (US), Atlassian (Australia), IBM (US), Microsoft (US), V-Soft Technologies (South Africa), Micro Focus (UK), AppVeyor (Canada), CA Technologies (US), Cloudbees (US), AWS (US), Puppet (Oregon), Nevercode (UK), Red Hat(US), CA Technologies (US), Oracle (US), Micro Focus (UK), SmartBear (US), Jetbrains (Czech Republic), Shippable (US), Electric Cloud (US), BuildKite (Australia), TravisCI (Germany), Drone.io (US), CircleCI (US), Rendered Text (Serbia), Bitrise (Hungary), and PHPCI (Belgium) are key players of the market.
Please note: This is not an exhaustive list of companies profiled in the report.
Chapter 1 Methodology
1.1 Market Scope & Definitions
1.2 Estimates & Forecast Calculation
1.3 Historical Data Overview and Validation
1.4 Data Sources
1.4.1 Secondary
1.4.2 Primary
Chapter 2 Report Outlook
2.1 Continuous Integration Tools Industry Overview, 2016-2026
2.1.1 Industry Overview
2.1.2 Deployment Mode Overview
2.1.3 Organization Size Overview
2.1.4 Industry Vertical Overview
2.1.6 Regional Overview
Chapter 3 Continuous Integration Tools Market Trends
3.1 Market Segmentation
3.2 Industry Background, 2016-2026
3.3 Market Key Trends
3.3.1 Positive Trends
3.3.1.1 High demand of the cloud based deployment of continuous integration tools in the major industry verticals
3.3.2 Industry Challenges
3.3.2.1 Lack of adequate infrastructure and automated systems in developing nations
3.4 Prospective Growth Scenario
3.4.1 Deployment Mode Growth Scenario
3.4.2 Organization Size Growth Scenario
3.4.3 Industry Vertical Growth Scenario
3.5 COVID-19 Influence over Industry Growth
3.6 Porter’s Analysis
3.7 PESTEL Analysis
3.8 Value Chain & Supply Chain Analysis
3.9 Regulatory Framework
3.9.1 North America
3.9.2 Europe
3.9.3 APAC
3.9.4 LATAM
3.9.5 MEA
3.10 Industry Vertical Overview
3.11 Market Share Analysis, 2020
3.11.1 Company Positioning Overview, 2020
Chapter 4 Continuous Integration Tools Market, By Deployment Mode
4.1 Deployment Mode Outlook
4.2 Cloud
4.2.1 Market Size, By Region, 2016-2026 (USD Million)
4.3 On-Premises
4.3.1 Market Size, By Region, 2016-2026 (USD Million)
Chapter 5 Continuous Integration Tools Market, By Organization Size
5.1 Organization Size Outlook
5.2 Large Enterprises
5.2.1 Market Size, By Region, 2016-2026 (USD Million)
5.3 Small and Medium Sized Enterprises [SMEs]
5.3.1 Market Size, By Region, 2016-2026 (USD Million)
Chapter 6 Continuous Integration Tools Market, By Industry Vertical
6.1 BFSI
6.1.1 Market Size, By Region, 2016-2026 (USD Million)
6.2 Retail, and eCommerce
6.2.1 Market Size, By Region, 2016-2026 (USD Million)
6.3 Telecommunication
6.3.1 Market Size, By Region, 2016-2026 (USD Million)
6.4 Education
6.4.1 Market Size, By Region, 2016-2026 (USD Million)
6.5 Media and Entertainment
6.5.1 Market Size, By Region, 2016-2026 (USD Million)
6.6 Healthcare
6.6.1 Market Size, By Region, 2016-2026 (USD Million)
6.7 Others
6.7.1 Market Size, By Region, 2016-2026 (USD Million)
Chapter 7 Continuous Integration Tools Market, By Region
7.1 Regional outlook
7.2 North America
7.2.1 Market Size, By Country 2016-2026 (USD Million)
7.2.2 Market Size, By Deployment Mode, 2016-2026 (USD Million)
7.2.3 Market Size, By Organization Size, 2016-2026 (USD Million)
7.2.4 Market Size, By Industry Vertical, 2016-2026 (USD Million)
7.2.6 U.S.
7.2.6.1 Market Size, By Deployment Mode, 2016-2026 (USD Million)
7.2.4.2 Market Size, By Organization Size, 2016-2026 (USD Million)
7.2.4.3 Market Size, By Industry Vertical, 2016-2026 (USD Million)
7.2.7 Canada
7.2.7.1 Market Size, By Deployment Mode, 2016-2026 (USD Million)
7.2.7.2 Market Size, By Organization Size, 2016-2026 (USD Million)
7.2.7.3 Market Size, By Industry Vertical, 2016-2026 (USD Million)
7.3 Europe
7.3.1 Market Size, By Country 2016-2026 (USD Million)
7.3.2 Market Size, By Deployment Mode, 2016-2026 (USD Million)
7.3.3 Market Size, By Organization Size, 2016-2026 (USD Million)
7.3.4 Market Size, By Industry Vertical, 2016-2026 (USD Million)
7.3.6 Germany
7.3.6.1 Market Size, By Deployment Mode, 2016-2026 (USD Million)
7.3.6.2 Market Size, By Organization Size, 2016-2026 (USD Million)
7.3.6.3 Market Size, By Industry Vertical, 2016-2026 (USD Million)
7.3.7 UK
7.3.7.1 Market Size, By Deployment Mode, 2016-2026 (USD Million)
7.3.7.2 Market Size, By Organization Size, 2016-2026 (USD Million)
7.3.7.3 Market Size, By Industry Vertical, 2016-2026 (USD Million)
7.3.8 France
7.3.7.1 Market Size, By Deployment Mode, 2016-2026 (USD Million)
7.3.7.2 Market Size, By Organization Size, 2016-2026 (USD Million)
7.3.7.3 Market Size, By Industry Vertical, 2016-2026 (USD Million)
7.3.9 Italy
7.3.9.1 Market Size, By Deployment Mode, 2016-2026 (USD Million)
7.3.9.2 Market Size, By Organization Size, 2016-2026 (USD Million)
7.3.9.3 Market Size, By Industry Vertical, 2016-2026 (USD Million)
7.3.10 Spain
7.3.10.1 Market Size, By Deployment Mode, 2016-2026 (USD Million)
7.3.10.2 Market Size, By Organization Size, 2016-2026 (USD Million)
7.3.10.3 Market Size, By Industry Vertical, 2016-2026 (USD Million)
7.3.11 Russia
7.3.11.1 Market Size, By Deployment Mode, 2016-2026 (USD Million)
7.3.11.2 Market Size, By Organization Size, 2016-2026 (USD Million)
7.3.11.3 Market Size, By Industry Vertical, 2016-2026 (USD Million)
7.4 Asia Pacific
7.4.1 Market Size, By Country 2016-2026 (USD Million)
7.4.2 Market Size, By Deployment Mode, 2016-2026 (USD Million)
7.4.3 Market Size, By Organization Size, 2016-2026 (USD Million)
7.4.4 Market Size, By Industry Vertical, 2016-2026 (USD Million)
7.4.6 China
7.4.6.1 Market Size, By Deployment Mode, 2016-2026 (USD Million)
7.4.6.2 Market Size, By Organization Size, 2016-2026 (USD Million)
7.4.6.3 Market Size, By Industry Vertical, 2016-2026 (USD Million)
7.4.7 India
7.4.7.1 Market Size, By Deployment Mode, 2016-2026 (USD Million)
7.4.7.2 Market Size, By Organization Size, 2016-2026 (USD Million)
7.4.7.3 Market Size, By Industry Vertical, 2016-2026 (USD Million)
7.4.8 Japan
7.4.7.1 Market Size, By Deployment Mode, 2016-2026 (USD Million)
7.4.7.2 Market Size, By Organization Size, 2016-2026 (USD Million)
7.4.7.3 Market Size, By Industry Vertical, 2016-2026 (USD Million)
7.4.9 Australia
7.4.9.1 Market Size, By Deployment Mode, 2016-2026 (USD Million)
7.4.9.2 Market size, By Organization Size, 2016-2026 (USD Million)
7.4.9.3 Market Size, By Industry Vertical, 2016-2026 (USD Million)
7.4.10 South Korea
7.4.10.1 Market Size, By Deployment Mode, 2016-2026 (USD Million)
7.4.10.2 Market Size, By Organization Size, 2016-2026 (USD Million)
7.4.10.3 Market Size, By Industry Vertical, 2016-2026 (USD Million)
7.5 Latin America
7.5.1 Market Size, By Country 2016-2026 (USD Million)
7.5.2 Market Size, By Deployment Mode, 2016-2026 (USD Million)
7.5.3 Market Size, By Organization Size, 2016-2026 (USD Million)
7.5.4 Market Size, By Industry Vertical, 2016-2026 (USD Million)
7.5.6 Brazil
7.5.6.1 Market Size, By Deployment Mode, 2016-2026 (USD Million)
7.5.6.2 Market Size, By Organization Size, 2016-2026 (USD Million)
7.5.6.3 Market Size, By Industry Vertical, 2016-2026 (USD Million)
7.5.7 Mexico
7.5.7.1 Market Size, By Deployment Mode, 2016-2026 (USD Million)
7.5.7.2 Market Size, By Organization Size, 2016-2026 (USD Million)
7.5.7.3 Market Size, By Industry Vertical, 2016-2026 (USD Million)
7.5.8 Argentina
7.5.7.1 Market Size, By Deployment Mode, 2016-2026 (USD Million)
7.5.7.2 Market Size, By Organization Size, 2016-2026 (USD Million)
7.5.7.3 Market Size, By Industry Vertical, 2016-2026 (USD Million)
7.6 MEA
7.6.1 Market Size, By Country 2016-2026 (USD Million)
7.6.2 Market Size, By Deployment Mode, 2016-2026 (USD Million)
7.6.3 Market Size, By Organization Size, 2016-2026 (USD Million)
7.6.4 Market Size, By Industry Vertical, 2016-2026 (USD Million)
7.6.6 Saudi Arabia
7.6.6.1 Market Size, By Deployment Mode, 2016-2026 (USD Million)
7.6.6.2 Market Size, By Organization Size, 2016-2026 (USD Million)
7.6.6.3 Market Size, By Industry Vertical, 2016-2026 (USD Million)
7.6.7 UAE
7.6.7.1 Market Size, By Deployment Mode, 2016-2026 (USD Million)
7.6.7.2 Market Size, By Organization Size, 2016-2026 (USD Million)
7.6.7.3 Market Size, By Industry Vertical, 2016-2026 (USD Million)
7.6.8 South Africa
7.6.7.1 Market Size, By Deployment Mode, 2016-2026 (USD Million)
7.6.7.2 Market Size, By Organization Size, 2016-2026 (USD Million)
7.6.7.3 Market Size, By Industry Vertical, 2016-2026 (USD Million)
Chapter 8 Company Landscape
8.1 Competitive Analysis, 2020
8.2 AutoRABIT (US)
8.2.1 Company Overview
8.2.2 Financial Analysis
8.2.3 Strategic Positioning
8.2.4 Info Graphic Analysis
8.3 Atlassian (Australia)
8.3.1 Company Overview
8.3.2 Financial Analysis
8.3.3 Strategic Positioning
8.3.4 Info Graphic Analysis
8.4 IBM (US)
8.4.1 Company Overview
8.4.2 Financial Analysis
8.4.3 Strategic Positioning
8.4.4 Info Graphic Analysis
8.5 Microsoft (US)
8.5.1 Company Overview
8.5.2 Financial Analysis
8.5.3 Strategic Positioning
8.5.4 Info Graphic Analysis
8.6 V-Soft Technologies (South Africa)
8.6.1 Company Overview
8.6.2 Financial Analysis
8.6.3 Strategic Positioning
8.6.4 Info Graphic Analysis
8.7 Micro Focus (UK)
8.7.1 Company Overview
8.7.2 Financial Analysis
8.7.3 Strategic Positioning
8.7.4 Info Graphic Analysis
8.8 AppVeyor (Canada)
8.8.1 Company Overview
8.8.2 Financial Analysis
8.8.3 Strategic Positioning
8.8.4 Info Graphic Analysis
8.9 CA Technologies (US)
8.8.1 Company Overview
8.8.2 Financial Analysis
8.8.3 Strategic Positioning
8.8.4 Info Graphic Analysis
8.10 Cloudbees (US)
8.10.1 Company Overview
8.10.2 Financial Analysis
8.10.3 Strategic Positioning
8.10.4 Info Graphic Analysis
8.11 Other Companies
8.11.1 Company Overview
8.11.2 Financial Analysis
8.11.3 Strategic Positioning
8.11.4 Info Graphic Analysis
The Global Continuous Integration Tools Market has been studied from the year 2019 till 2026. However, the CAGR provided in the report is from the year 2021 to 2026. The research methodology involved three stages: Desk research, Primary research, and Analysis & Output from the entire research process.

The desk research involved a robust background study which meant referring to paid and unpaid databases to understand the market dynamics; mapping contracts from press releases; identifying the key players in the market, studying their product portfolio, competition level, annual reports/SEC filings & investor presentations; and learning the demand and supply-side analysis for the Continuous Integration Tools Market.

The primary research activity included telephonic conversations with more than 50 tier 1 industry consultants, distributors, and end-use product manufacturers.

Finally, based on the above thorough research process, an in-depth analysis was carried out considering the following aspects: market attractiveness, current & future market trends, market share analysis, SWOT analysis of the company and customer analytics.

Frequently Asked Questions
![Global Continuous Integration Tools Market Size, Trends, and Analysis - Forecasts to 2026 By Deployment Mode (Cloud, On-Premises), By Organization Size (Large Enterprises, Small and Medium Sized Enterprises [SMEs]), By Vertical (BFSI, Retail, and eCommerce, Telecommunication, Education, Media and Entertainment, Healthcare, Manufacturing, Others [Government, Logistics and Transportation, and Energy and Utilities]), Region (North America, Asia Pacific, CSA, Europe, and the Middle East and Africa), End-Use Landscape, Company Market Share Analysis, and Competitor Analysis](https://www.globalmarketestimates.com/images/cat/Electronics, Semiconductors and Information & Communication Technology.png)
This FREE sample includes market data points, ranging from trend analyses to market estimates & forecasts. See for yourself.
Or view our licence options:
Tailor made solutions just for you
80% of our clients seek made-to-order reports. How do you want us to tailor yours?
OUR CLIENTS


