This report was recently updated on August 15 2025 with the latest and most recent
market numbers
Global Crop Micronutrients Market Size, Trends & Analysis - Forecasts to 2028 By Form (Chelated and Non-chelated), By Type (Zinc, Boron, Iron, Manganese, Molybdenum, Copper, and Others), By Application (Soil, Foliar, Fertigation, and Others), By Crop Type (Cereals & Grains, Fruits & Vegetables, Pulses & Oilseeds, and Others), and By Region (North America, Asia Pacific, Central & South America, Europe, and Middle East and Africa), Competitive Landscape, Company Market Share Analysis, and Competitor Analysis
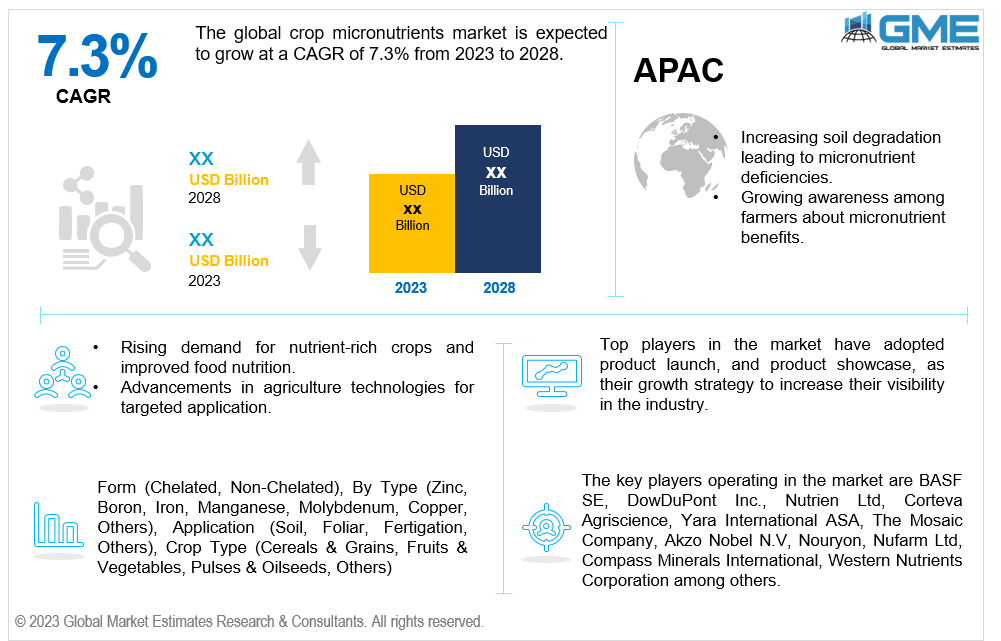
The global crop micronutrients market is expected to grow at a CAGR of 7.3% from 2023 to 2028.
Crop micronutrients play a crucial role in the growth and development of plants, as they are essential elements required in small quantities for proper physiological functions. These micronutrients include iron, zinc, manganese, copper, boron, molybdenum, and chlorine. They are essential for various enzymatic activities, photosynthesis, nitrogen fixation, and for overall metabolism of plants. The global crop micronutrients market has been witnessing significant growth due to several drivers and trends that impact agricultural practices and crop productivity.
The demand for agricultural micronutrients has been significantly influenced by the expanding global population and the need for food security. Micronutrients play a crucial role in enhancing crop yield, quality, and nutritional content. They are essential for plant growth, as they act as catalysts for various enzymatic reactions in plants, promoting healthy development and improving resistance to diseases and stress.
The increasing demand for nutrient-rich crops and the necessity to enhance agricultural productivity is driving the adoption of crop micronutrients among farmers and agricultural stakeholders. As a result, the global market for crop micronutrients has been witnessing experienced rapid growth in the recent years.
Agrochemical and agricultural input companies have recognized the potential of crop micronutrients market and are focusing on strategies to capitalize on this growth opportunity. These companies are focusing on launching innovative products and formulations to meet specific crop requirements and address soil nutrient deficiencies.
For instance, YaraVita (India) has been at the forefront of developing innovative micronutrient-enhanced fertilizers tailored to specific crop needs. The company have introduced micronutrient blends containing elements such as zinc, boron, iron, manganese, and copper, among others to address soil nutrient deficiencies in different regions and crops. These products aid in improving plant health, nutrient absorption, and overall crop productivity.
Chelated segment is expected to be the largest segment in the global market from 2023 to 2028. In comparison to non-chelated micronutrients, chelated micronutrients are more stable in the soil. The organic compounds used in chelation protect the micronutrients from being fixed or tied up in the soil, making them more readily available for plant uptake. As a result, chelated forms are more efficient in delivering essential nutrients to plants, thereby promoting better growth and development.
Moreover, various companies that offer chelated micronutrients are focusing on developing a wide range of formulations tailored to specific crop needs and soil conditions. For instance, BASF provides a diverse range of chelated micronutrients tailored to meet specific crop needs. Their chelated micronutrient products include chelated iron, zinc, manganese, and other essential elements. By offering a comprehensive portfolio of chelated micronutrients, BASF caters to the diverse requirements of farmers and different crop types.
Copper segment is expected to be the largest segment in the global market from 2023 to 2028. The dominance of the copper segment in the global crop micronutrients market is attributed to the increasing awareness among farmers and agricultural stakeholders about the vital role of copper in crop health and productivity. For several enzymatic processes in plants such as photosynthesis, respiration, and lignin production, copper is a crucial micronutrient. It plays a crucial role in strengthening plant cell walls, enhancing disease resistance, and improving overall plant vigor.
Furthermore, this segment is expected to retain its dominance throughout the forecast period with highest growth rate. The growth is driven by the expansion of cultivated land, coupled with the growing global population, which is further driving farmers to maximize crop yields. Micronutrients containing copper are essential for increasing crop quality and output. As a result, farmers are increasingly incorporating copper-based micronutrient solutions into their crop management practices to meet the rising demand of food production.
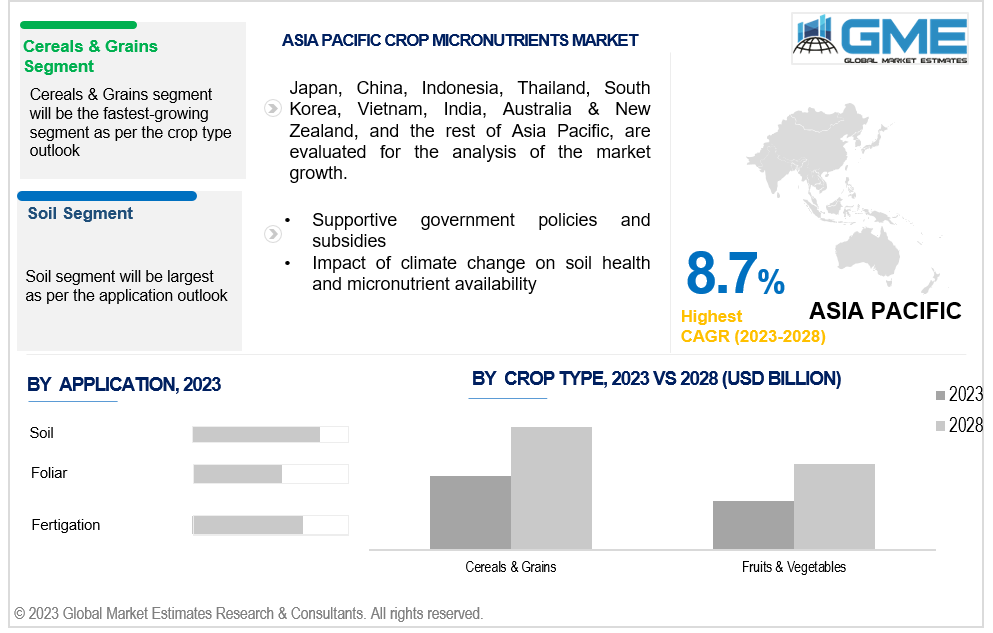
Soil segment is expected to be the largest segment in the global market from 2023 to 2028. With the escalating concerns over soil degradation and nutrient depletion in agricultural lands, there is a growing awareness among farmers about the importance of maintaining soil health. Soil testing and analysis are becoming more prevalent to identify nutrient deficiencies and tailor micronutrient applications accordingly. As a result, the demand for soil-applied micronutrients has been rising steadily.
Cereals and grains segment is expected to be the largest segment in the global market from 2023 to 2028. The dominance of the cereals and grains crop segment in the global crop micronutrients market is attributed to the increasing demand for high-yield and nutrient-rich crops, specifically cereals (such as rice, wheat, maize, etc.) and grains (such as corn, barley, etc.). Cereals and grains are staple food crops consumed by a large population worldwide, and their nutritional content directly affects global food security. Micronutrients play a vital role in enhancing the yield, nutritional quality, and stress tolerance of these crops, making them essential for achieving food security goals.
North America is projected to be the largest region in the global market, owing to technological advancements and adoption of precision agriculture practices. North America has been at the forefront of agricultural innovation, with farmers and agricultural stakeholders embracing advanced technologies to optimize crop production and sustainability. Precision agriculture, which involves the use of data, sensors, and automation, has revolutionized the way crops are managed including the application of micronutrients.
Asia Pacific is analyzed to be the fastest growing region in the global market. This is attributed to the increasing population and growing demand for food in the region. Asia Pacific is home to some of the world's most populous countries, and the rising population is putting tremendous pressure on the agricultural sector to produce more food. Micronutrients play a critical role in optimizing crop productivity and ensuring food security, making them essential for meeting the region's food demand.
Major key players operating the in the global crop micronutrients market include BASF SE, DowDuPont Inc., Nutrien Ltd, Corteva Agriscience, Yara International ASA, The Mosaic Company, Akzo Nobel N.V, Nouryon, Nufarm Ltd, Compass Minerals International, and Western Nutrients Corporation, among others.
Please note: This is not an exhaustive list of companies profiled in the report.
1 STRATEGIC INSIGHTS ON NEW REVENUE POCKETS
1.1 Strategic Opportunity & Attractiveness Analysis
1.1.1 Hot Revenue Pockets
1.1.2 Market Attractiveness Score
1.1.3 Revenue Impacting Opportunity
1.1.4 High Growing Region/Country
1.1.5 Competitor Analysis
1.1.6 Consumer Analysis
1.2 Global Market Estimates' View
1.3 Strategic Insights across Business Functions
1.3.1 For Chief Executive Officers
1.3.2 For Chief Marketing Officers
1.3.3 For Chief Strategy Officers
1.4 Evaluate the Potential of your Existing Business Lines vs. New Lines to Enter Into
2.1 Technological Adoption Rate
2.2 Current Trend Impact Analysis
2.3 Future Trend Impact Analysis
2.4 Data Metrics on Feed Stocks
3.1.2 Adjacent Market Opportunities
3.1.3 Ancillary Market Opportunities
3.2.1 Market Drivers: Impact Analysis
3.2.2 Market Restraints: Impact Analysis
3.2.3 Market Opportunities: Impact Analysis
3.2.4 Market Challenges: Impact Analysis
3.3.1 Porter’s Five Forces Analysis
3.3.1.1 Threat of New Entrants
3.3.1.2 Threat of New Substitutes
3.3.1.3 Bargaining Power of Suppliers
3.3.1.4 Bargaining Power of Buyers
3.3.1.5 Intensity of Competitive Rivalry
3.3.2 SWOT Analysis; By Factor (Political & Legal, Economic, and Technological)
4 GLOBAL CROP MICRONUTRIENTS MARKET, BY FORM
4.2 Crop Micronutrients Market: Form Scope Key Takeaways
4.3 Revenue Growth Analysis, 2022 & 2028
4.4.1 Chelated Market Estimates and Forecast, 2020-2028 (USD Million)
4.5.1 Non-chelated Market Estimates and Forecast, 2020-2028 (USD Million)
5 GLOBAL CROP MICRONUTRIENTS MARKET, BY TYPE
5.2 Crop Micronutrients Market: Type Scope Key Takeaways
5.3 Revenue Growth Analysis, 2022 & 2028
5.4.1 Zinc Market Estimates and Forecast, 2020-2028 (USD Million)
5.5.1 Boron Market Estimates and Forecast, 2020-2028 (USD Million)
5.6.1 Iron Market Estimates and Forecast, 2020-2028 (USD Million)
5.7.1 Manganese Market Estimates and Forecast, 2020-2028 (USD Million)
5.8.1 Molybdenum Market Estimates and Forecast, 2020-2028 (USD Million)
5.9.1 Copper Market Estimates and Forecast, 2020-2028 (USD Million)
5.10.1 Others Market Estimates and Forecast, 2020-2028 (USD Million)
6 GLOBAL CROP MICRONUTRIENTS MARKET, BY APPLICATION
6.2 Crop Micronutrients Market: Application Scope Key Takeaways
6.3 Revenue Growth Analysis, 2022 & 2028
6.4.1 Soil Market Estimates and Forecast, 2020-2028 (USD Million)
6.5.1 Foliar Market Estimates and Forecast, 2020-2028 (USD Million)
6.6.1 Fertigation Market Estimates and Forecast, 2020-2028 (USD Million)
6.8.1 Others Market Estimates and Forecast, 2020-2028 (USD Million)
7 GLOBAL CROP MICRONUTRIENTS MARKET, BY CROP TYPE
7.2 Crop Micronutrients Market: Crop Type Scope Key Takeaways
7.3 Revenue Growth Analysis, 2022 & 2028
7.4.1 Cereals & Grains Market Estimates and Forecast, 2020-2028 (USD Million)
7.5.1 Fruits & Vegetables Market Estimates and Forecast, 2020-2028 (USD Million)
7.6.1 Pulses & Oilseeds Market Estimates and Forecast, 2020-2028 (USD Million)
7.7.1 Others Market Estimates and Forecast, 2020-2028 (USD Million)
8 GLOBAL CROP MICRONUTRIENTS MARKET, BY REGION
8.2 North America Crop Micronutrients Market Estimates and Forecast, 2020-2028 (USD Million)
8.2.5.1 U.S. Crop Micronutrients Market Estimates and Forecast, 2020-2028 (USD Million)
8.2.5.2 Canada Crop Micronutrients Market Estimates and Forecast, 2020-2028 (USD Million)
8.2.5.3 Mexico Crop Micronutrients Market Estimates and Forecast, 2020-2028 (USD Million)
8.3 Europe Crop Micronutrients Market Estimates and Forecast, 2020-2028 (USD Million)
8.3.5.1 Germany Crop Micronutrients Market Estimates and Forecast, 2020-2028 (USD Million)
8.3.5.2 U.K. Presered Flowers Market Estimates and Forecast, 2020-2028 (USD Million)
8.3.5.3 France Crop Micronutrients Market Estimates and Forecast, 2020-2028 (USD Million)
8.3.5.4 Italy Crop Micronutrients Market Estimates and Forecast, 2020-2028 (USD Million)
8.3.5.5 Spain Crop Micronutrients Market Estimates and Forecast, 2020-2028 (USD Million)
8.3.5.6 Netherlands Crop Micronutrients Market Estimates and Forecast, 2020-2028 (USD Million)
8.3.5.7 Rest of Europe Crop Micronutrients Market Estimates and Forecast, 2020-2028 (USD Million)
8.4 Asia Pacific Crop Micronutrients Market Estimates and Forecast, 2020-2028 (USD Million)
8.4.5.1 China Crop Micronutrients Market Estimates and Forecast, 2020-2028 (USD Million)
8.4.5.2 Japan Crop Micronutrients Market Estimates and Forecast, 2020-2028 (USD Million)
8.4.5.3 India Crop Micronutrients Market Estimates and Forecast, 2020-2028 (USD Million)
8.4.5.4 South Korea Crop Micronutrients Market Estimates and Forecast, 2020-2028 (USD Million)
8.4.5.5 Singapore Crop Micronutrients Market Estimates and Forecast, 2020-2028 (USD Million)
8.4.5.6 Malaysia Crop Micronutrients Market Estimates and Forecast, 2020-2028 (USD Million)
8.4.5.7 Thailand Crop Micronutrients Market Estimates and Forecast, 2020-2028 (USD Million)
8.4.5.8 Indonesia Crop Micronutrients Market Estimates and Forecast, 2020-2028 (USD Million)
8.4.5.9 Vietnam Crop Micronutrients Market Estimates and Forecast, 2020-2028 (USD Million)
8.4.5.10 Taiwan Crop Micronutrients Market Estimates and Forecast, 2020-2028 (USD Million)
8.5.5.1 Saudi Arabia Crop Micronutrients Market Estimates and Forecast, 2020-2028 (USD Million)
8.5.5.2 U.A.E. Crop Micronutrients Market Estimates and Forecast, 2020-2028 (USD Million)
8.5.5.3 Israel Crop Micronutrients Market Estimates and Forecast, 2020-2028 (USD Million)
8.5.5.4 South Africa Crop Micronutrients Market Estimates and Forecast, 2020-2028 (USD Million)
8.6.5.1 Brazil Crop Micronutrients Market Estimates and Forecast, 2020-2028 (USD Million)
8.6.5.2 Argentina Crop Micronutrients Market Estimates and Forecast, 2020-2028 (USD Million)
8.6.5.3 Chile Crop Micronutrients Market Estimates and Forecast, 2020-2028 (USD Million)
9.1 Company Market Share Analysis
9.2 Four Quadrant Positioning Matrix
9.4.1.1 Business Description & Financial Analysis
9.4.1.3 Products & Services Offered
9.4.1.4 Strategic Alliances between Business Partners
9.4.2.1 Business Description & Financial Analysis
9.4.2.3 Products & Services Offered
9.4.2.4 Strategic Alliances between Business Partners
9.4.3.1 Business Description & Financial Analysis
9.4.3.3 Products & Services Offered
9.4.3.4 Strategic Alliances between Business Partners
9.4.4.1 Business Description & Financial Analysis
9.4.4.3 Products & Services Offered
9.4.4.4 Strategic Alliances between Business Partners
9.4.5.1 Business Description & Financial Analysis
9.4.5.3 Products & Services Offered
9.4.5.4 Strategic Alliances between Business Partners
9.4.6.1 Business Description & Financial Analysis
9.4.6.3 Products & Services Offered
9.4.6.4 Strategic Alliances between Business Partners
9.4.7.1 Business Description & Financial Analysis
9.4.7.3 Products & Services Offered
9.4.8.4 Strategic Alliances between Business Partners
9.4.8.1 Business Description & Financial Analysis
9.4.8.3 Products & Services Offered
9.4.8.4 Strategic Alliances between Business Partners
9.4.9.1 Business Description & Financial Analysis
9.4.9.3 Products & Services Offered
9.4.9.4 Strategic Alliances between Business Partners
9.4.10 Compass Minerals International
9.4.10.1 Business Description & Financial Analysis
9.4.10.3 Products & Services Offered
9.4.10.4 Strategic Alliances between Business Partners
9.4.11.1 Business Description & Financial Analysis
9.4.11.3 Products & Services Offered
9.4.11.4 Strategic Alliances between Business Partners
10.1.2 Market Scope & Segmentation
10.2.1.2 GMEs Internal Data Repository
10.2.1.3 Secondary Resources & Third Party Perspectives
10.2.1.4 Company Information Sources
10.2.2.1 Various Type of Respondents for Primary Interviews
10.2.2.2 Number of Interviews Conducted throughout the Research Process
10.2.2.4 Discussion Guide for Primary Participants
10.2.3.1 Expert Panels Across 30+ Industry
10.2.4.1 Paid Local Experts Across 30+ Industry Across each Region
10.3.1.1 Macro-Economic Indicators Considered
10.3.1.2 Micro-Economic Indicators Considered
10.3.2.1 Company Share Analysis Approach
10.3.2.2 Estimation of Potential Product Sales
10.4.2 Time Series, Cross Sectional & Panel Data Analysis
10.5.1 Inhouse AI Based Real Time Analytics Tool
10.5.2 Output From Desk & Primary Research
10.6 Research Assumptions & Limitations
LIST OF TABLES
1 Global Crop Micronutrients Market, By Form, 2020-2028 (USD Mllion)
2 Chelated Market, By Region, 2020-2028 (USD Mllion)
3 Non-Chelated Market, By Region, 2020-2028 (USD Mllion)
4 Global Crop Micronutrients Market, By Type, 2020-2028 (USD Mllion)
5 Zinc Market, By Region, 2020-2028 (USD Mllion)
6 Boron Market, By Region, 2020-2028 (USD Mllion)
7 Iron Market, By Region, 2020-2028 (USD Mllion)
8 Manganese Market, By Region, 2020-2028 (USD Mllion)
9 Molybdenum Market, By Region, 2020-2028 (USD Mllion)
10 Copper Market, By Region, 2020-2028 (USD Mllion)
11 Others Market, By Region, 2020-2028 (USD Mllion)
12 Global Crop Micronutrients Market, By Application, 2020-2028 (USD Mllion)
13 Soil Market, By Region, 2020-2028 (USD Mllion)
14 Foliar Market, By Region, 2020-2028 (USD Mllion)
15 Fertigation Market, By Region, 2020-2028 (USD Mllion)
16 Others Market, By Region, 2020-2028 (USD Mllion)
17 Global Crop Micronutrients Market, By CROP TYPE, 2020-2028 (USD Mllion)
18 Cereals & Grains Market, By Region, 2020-2028 (USD Mllion)
19 Fruits & Vegetables Market, By Region, 2020-2028 (USD Mllion)
20 Pulses & Oilseeds Market, By Region, 2020-2028 (USD Mllion)
21 OTHERS Market, By Region, 2020-2028 (USD Mllion)
22 Regional Analysis, 2020-2028 (USD Mllion)
23 North America Crop Micronutrients Market, By Form, 2020-2028 (USD Million)
24 North America Crop Micronutrients Market, By Type, 2020-2028 (USD Million)
25 North America Crop Micronutrients Market, By Application, 2020-2028 (USD Million)
26 North America Crop Micronutrients Market, By Crop Type, 2020-2028 (USD Million)
27 North America Crop Micronutrients Market, By Country, 2020-2028 (USD Million)
28 U.S Crop Micronutrients Market, By Form, 2020-2028 (USD Million)
29 U.S Crop Micronutrients Market, By Type, 2020-2028 (USD Million)
30 U.S Crop Micronutrients Market, By Application, 2020-2028 (USD Million)
31 U.S Crop Micronutrients Market, By Crop Type, 2020-2028 (USD Million)
32 Canada Crop Micronutrients Market, By Form, 2020-2028 (USD Million)
33 Canada Crop Micronutrients Market, By Type, 2020-2028 (USD Million)
34 Canada Crop Micronutrients Market, By Application, 2020-2028 (USD Million)
35 CANADA Crop Micronutrients Market, By Crop Type, 2020-2028 (USD Million)
36 Mexico Crop Micronutrients Market, By Form, 2020-2028 (USD Million)
37 Mexico Crop Micronutrients Market, By Type, 2020-2028 (USD Million)
38 Mexico Crop Micronutrients Market, By Application, 2020-2028 (USD Million)
39 mexico Crop Micronutrients Market, By Crop Type, 2020-2028 (USD Million)
40 Europe Crop Micronutrients Market, By Form, 2020-2028 (USD Million)
41 Europe Crop Micronutrients Market, By Type, 2020-2028 (USD Million)
42 Europe Crop Micronutrients Market, By Application, 2020-2028 (USD Million)
43 europe Crop Micronutrients Market, By Crop Type, 2020-2028 (USD Million)
44 Germany Crop Micronutrients Market, By Form, 2020-2028 (USD Million)
45 Germany Crop Micronutrients Market, By Type, 2020-2028 (USD Million)
46 Germany Crop Micronutrients Market, By Application, 2020-2028 (USD Million)
47 germany Crop Micronutrients Market, By Crop Type, 2020-2028 (USD Million)
48 UK Crop Micronutrients Market, By Form, 2020-2028 (USD Million)
49 UK Crop Micronutrients Market, By Type, 2020-2028 (USD Million)
50 UK Crop Micronutrients Market, By Application, 2020-2028 (USD Million)
51 U.kCrop Micronutrients Market, By Crop Type, 2020-2028 (USD Million)
52 France Crop Micronutrients Market, By Form, 2020-2028 (USD Million)
53 France Crop Micronutrients Market, By Type, 2020-2028 (USD Million)
54 France Crop Micronutrients Market, By Application, 2020-2028 (USD Million)
55 france Crop Micronutrients Market, By Crop Type, 2020-2028 (USD Million)
56 Italy Crop Micronutrients Market, By Form, 2020-2028 (USD Million)
57 Italy Crop Micronutrients Market, By T Type Type, 2020-2028 (USD Million)
58 Italy Crop Micronutrients Market, By Application, 2020-2028 (USD Million)
59 italy Crop Micronutrients Market, By Crop Type, 2020-2028 (USD Million)
60 Spain Crop Micronutrients Market, By Form, 2020-2028 (USD Million)
61 Spain Crop Micronutrients Market, By Type, 2020-2028 (USD Million)
62 Spain Crop Micronutrients Market, By Application, 2020-2028 (USD Million)
63 spain Crop Micronutrients Market, By Crop Type, 2020-2028 (USD Million)
64 Rest Of Europe Crop Micronutrients Market, By Form, 2020-2028 (USD Million)
65 Rest Of Europe Crop Micronutrients Market, By Type, 2020-2028 (USD Million)
66 Rest of Europe Crop Micronutrients Market, By Application, 2020-2028 (USD Million)
67 REST OF EUROPE Crop Micronutrients Market, By Crop Type, 2020-2028 (USD Million)
68 Asia Pacific Crop Micronutrients Market, By Form, 2020-2028 (USD Million)
69 Asia Pacific Crop Micronutrients Market, By Type, 2020-2028 (USD Million)
70 Asia Pacific Crop Micronutrients Market, By Application, 2020-2028 (USD Million)
71 asia Crop Micronutrients Market, By Crop Type, 2020-2028 (USD Million)
72 Asia Pacific Crop Micronutrients Market, By Country, 2020-2028 (USD Million)
73 China Crop Micronutrients Market, By Form, 2020-2028 (USD Million)
74 China Crop Micronutrients Market, By Type, 2020-2028 (USD Million)
75 China Crop Micronutrients Market, By Application, 2020-2028 (USD Million)
76 china Crop Micronutrients Market, By Crop Type, 2020-2028 (USD Million)
77 India Crop Micronutrients Market, By Form, 2020-2028 (USD Million)
78 India Crop Micronutrients Market, By Type, 2020-2028 (USD Million)
79 India Crop Micronutrients Market, By Application, 2020-2028 (USD Million)
80 india Crop Micronutrients Market, By Crop Type, 2020-2028 (USD Million)
81 Japan Crop Micronutrients Market, By Form, 2020-2028 (USD Million)
82 Japan Crop Micronutrients Market, By Type, 2020-2028 (USD Million)
83 Japan Crop Micronutrients Market, By Application, 2020-2028 (USD Million)
84 japan Crop Micronutrients Market, By Crop Type, 2020-2028 (USD Million)
85 South Korea Crop Micronutrients Market, By Form, 2020-2028 (USD Million)
86 South Korea Crop Micronutrients Market, By Type, 2020-2028 (USD Million)
87 South Korea Crop Micronutrients Market, By Application, 2020-2028 (USD Million)
88 south korea Crop Micronutrients Market, By Crop Type, 2020-2028 (USD Million)
89 Middle East & Africa Crop Micronutrients Market, By Form, 2020-2028 (USD Million)
90 Middle East & Africa Crop Micronutrients Market, By Type, 2020-2028 (USD Million)
91 Middle East & Africa Crop Micronutrients Market, By Application, 2020-2028 (USD Million)
92 MIDDLE EAST & AFRICA Crop Micronutrients Market, By Crop Type, 2020-2028 (USD Million)
93 Middle East & Africa Crop Micronutrients Market, By Country, 2020-2028 (USD Million)
94 Saudi Arabia Crop Micronutrients Market, By Form, 2020-2028 (USD Million)
95 Saudi Arabia Crop Micronutrients Market, By Type, 2020-2028 (USD Million)
96 Saudi Arabia Crop Micronutrients Market, By Application, 2020-2028 (USD Million)
97 saudi arabia Crop Micronutrients Market, By Crop Type, 2020-2028 (USD Million)
98 UAE Crop Micronutrients Market, By Form, 2020-2028 (USD Million)
99 UAE Crop Micronutrients Market, By Type, 2020-2028 (USD Million)
100 UAE Crop Micronutrients Market, By Application, 2020-2028 (USD Million)
101 uae Crop Micronutrients Market, By Crop Type, 2020-2028 (USD Million)
102 Central & South America Crop Micronutrients Market, By Form, 2020-2028 (USD Million)
103 Central & South America Crop Micronutrients Market, By Type, 2020-2028 (USD Million)
104 Central & South America Crop Micronutrients Market, By Application, 2020-2028 (USD Million)
105 CENTRAL & SOUTH AMERICA Crop Micronutrients Market, By Crop Type, 2020-2028 (USD Million)
106 Central & South America Crop Micronutrients Market, By Country, 2020-2028 (USD Million)
107 Brazil Crop Micronutrients Market, By Form, 2020-2028 (USD Million)
108 Brazil Crop Micronutrients Market, By Type, 2020-2028 (USD Million)
109 Brazil Crop Micronutrients Market, By Application, 2020-2028 (USD Million)
110 brazil Crop Micronutrients Market, By Crop Type, 2020-2028 (USD Million)
111 BASF SE: Products & Services Offering
112 DowDuPont Inc.: Products & Services Offering
113 Nutrien Ltd: Products & Services Offering
114 Corteva Agriscience: Products & Services Offering
115 Yara International ASA: Products & Services Offering
116 THE MOSAIC COMPANY: Products & Services Offering
117 Akzo Nobel N.V: Products & Services Offering
118 Nouryon: Products & Services Offering
119 Nufarm Ltd, Inc: Products & Services Offering
120 Compass Minerals International: Products & Services Offering
121 Other Companies: Products & Services Offering
LIST OF FIGURES
1 Global Crop Micronutrients Market Overview
2 Global Crop Micronutrients Market Value From 2020-2028 (USD Mllion)
3 Global Crop Micronutrients Market Share, By Form (2022)
4 Global Crop Micronutrients Market Share, By Type (2022)
5 Global Crop Micronutrients Market Share, By Application (2022)
6 Global Crop Micronutrients Market Share, By Crop Type (2022)
7 Global Crop Micronutrients Market, By Region (Asia Pacific Market)
8 Technological Trends In Global Crop Micronutrients Market
9 Four Quadrant Competitor Positioning Matrix
10 Impact Of Macro & Micro Indicators On The Market
11 Impact Of Key Drivers On The Global Crop Micronutrients Market
12 Impact Of Challenges On The Global Crop Micronutrients Market
13 Porter’s Five Forces Analysis
14 Global Crop Micronutrients Market: By Form Scope Key Takeaways
15 Global Crop Micronutrients Market, By Form Segment: Revenue Growth Analysis
16 Chelated Market, By Region, 2020-2028 (USD Mllion)
17 Non-Chelated Market, By Region, 2020-2028 (USD Mllion)
18 Global Crop Micronutrients Market: By Type Scope Key Takeaways
19 Global Crop Micronutrients Market, By Type Segment: Revenue Growth Analysis
20 Zinc Market, By Region, 2020-2028 (USD Mllion)
21 Boron Market, By Region, 2020-2028 (USD Mllion)
22 Iron Market, By Region, 2020-2028 (USD Mllion)
23 Manganese Market, By Region, 2020-2028 (USD Mllion)
24 Molybdenum Market, By Region, 2020-2028 (USD Mllion)
25 Copper Market, By Region, 2020-2028 (USD Mllion)
26 Others Market, By Region, 2020-2028 (USD Mllion)
27 Global Crop Micronutrients Market: By Application Scope Key Takeaways
28 Global Crop Micronutrients Market, By Application Segment: Revenue Growth Analysis
29 Soil Market, By Region, 2020-2028 (USD Mllion)
30 Foliar Market, By Region, 2020-2028 (USD Mllion)
31 Fertigation Market, By Region, 2020-2028 (USD Mllion)
32 Others Market, By Region, 2020-2028 (USD Mllion)
33 Global Crop Micronutrients Market: By Crop Type Scope Key Takeaways
34 Global Crop Micronutrients Market, By Crop Type Segment: Revenue Growth Analysis
35 Cereals & Grains Market, By Region, 2020-2028 (USD Mllion)
36 Fruits & Vegetables Market, By Region, 2020-2028 (USD Mllion)
37 Pulses & Oilseeds Market, By Region, 2020-2028 (USD Mllion)
38 Others Market, By Region, 2020-2028 (USD Mllion)
39 Regional Segment: Revenue Growth Analysis
40 Global Crop Micronutrients Market: Regional Analysis
41 North America Crop Micronutrients Market Overview
42 North America Crop Micronutrients Market, By Form
43 North America Crop Micronutrients Market, By Type
44 North America Crop Micronutrients Market, By Application
45 North America Crop Micronutrients Market, By Crop Type
46 North America Crop Micronutrients Market, By Country
47 U.S. Crop Micronutrients Market, By Form
48 U.S. Crop Micronutrients Market, By Type
49 U.S. Crop Micronutrients Market, By Application
50 U.S. Crop Micronutrients Market, By Crop Type
51 Canada Crop Micronutrients Market, By Form
52 Canada Crop Micronutrients Market, By Type
53 Canada Crop Micronutrients Market, By Application
54 Canada Crop Micronutrients Market, By Crop Type
55 Mexico Crop Micronutrients Market, By Form
56 Mexico Crop Micronutrients Market, By Type
57 Mexico Crop Micronutrients Market, By Application
58 Mexico Crop Micronutrients Market, By Crop Type
59 Four Quadrant Positioning Matrix
60 Company Market Share Analysis
61 BASF SE: Company Snapshot
62 BASF SE: SWOT Analysis
63 BASF SE: Geographic Presence
64 DowDuPont Inc.: Company Snapshot
65 DowDuPont Inc.: SWOT Analysis
66 DowDuPont Inc.: Geographic Presence
67 Nutrien Ltd: Company Snapshot
68 Nutrien Ltd: SWOT Analysis
69 Nutrien Ltd: Geographic Presence
70 Corteva Agriscience: Company Snapshot
71 Corteva Agriscience: Swot Analysis
72 Corteva Agriscience: Geographic Presence
73 Yara International ASA: Company Snapshot
74 Yara International ASA: SWOT Analysis
75 Yara International ASA: Geographic Presence
76 THE MOSAIC COMPANY: Company Snapshot
77 THE MOSAIC COMPANY: SWOT Analysis
78 THE MOSAIC COMPANY: Geographic Presence
79 Akzo Nobel N.V: Company Snapshot
80 Akzo Nobel N.V: SWOT Analysis
81 Akzo Nobel N.V: Geographic Presence
82 Nouryon: Company Snapshot
83 Nouryon: SWOT Analysis
84 Nouryon: Geographic Presence
85 Nufarm Ltd, Inc.: Company Snapshot
86 Nufarm Ltd, Inc.: SWOT Analysis
87 Nufarm Ltd, Inc.: Geographic Presence
88 Compass Minerals International: Company Snapshot
89 Compass Minerals International: SWOT Analysis
90 Compass Minerals International: Geographic Presence
91 Other Companies: Company Snapshot
92 Other Companies: SWOT Analysis
93 Other Companies: Geographic Presence
The Global Crop Micronutrients Market has been studied from the year 2019 till 2028. However, the CAGR provided in the report is from the year 2023 to 2028. The research methodology involved three stages: Desk research, Primary research, and Analysis & Output from the entire research process.

The desk research involved a robust background study which meant referring to paid and unpaid databases to understand the market dynamics; mapping contracts from press releases; identifying the key players in the market, studying their product portfolio, competition level, annual reports/SEC filings & investor presentations; and learning the demand and supply-side analysis for the Crop Micronutrients Market.

The primary research activity included telephonic conversations with more than 50 tier 1 industry consultants, distributors, and end-use product manufacturers.

Finally, based on the above thorough research process, an in-depth analysis was carried out considering the following aspects: market attractiveness, current & future market trends, market share analysis, SWOT analysis of the company and customer analytics.

Frequently Asked Questions

This FREE sample includes market data points, ranging from trend analyses to market estimates & forecasts. See for yourself.
Or view our licence options:
Tailor made solutions just for you
80% of our clients seek made-to-order reports. How do you want us to tailor yours?
OUR CLIENTS


