This report was recently updated on August 17 2025 with the latest and most recent
market numbers
Global Desktop Scanning Electron Microscope (SEM) Market Size, Trends & Analysis - Forecasts to 2026 By Resolution (>15 nm, 15 – 10 nm, 10 – 6 nm, and <6 nm), By Application (Material Science, Nanotechnology, Life Science, Semiconductors, and Others), By End-User (Research Institutions, Electronics Industry, Medical Device Manufacturers, Pharmaceuticals Industry, and Others), By Region (North America, Asia Pacific, CSA, Europe, and the Middle East and Africa), Competitive Landscape Company Market Share Analysis, and Competitor Analysis
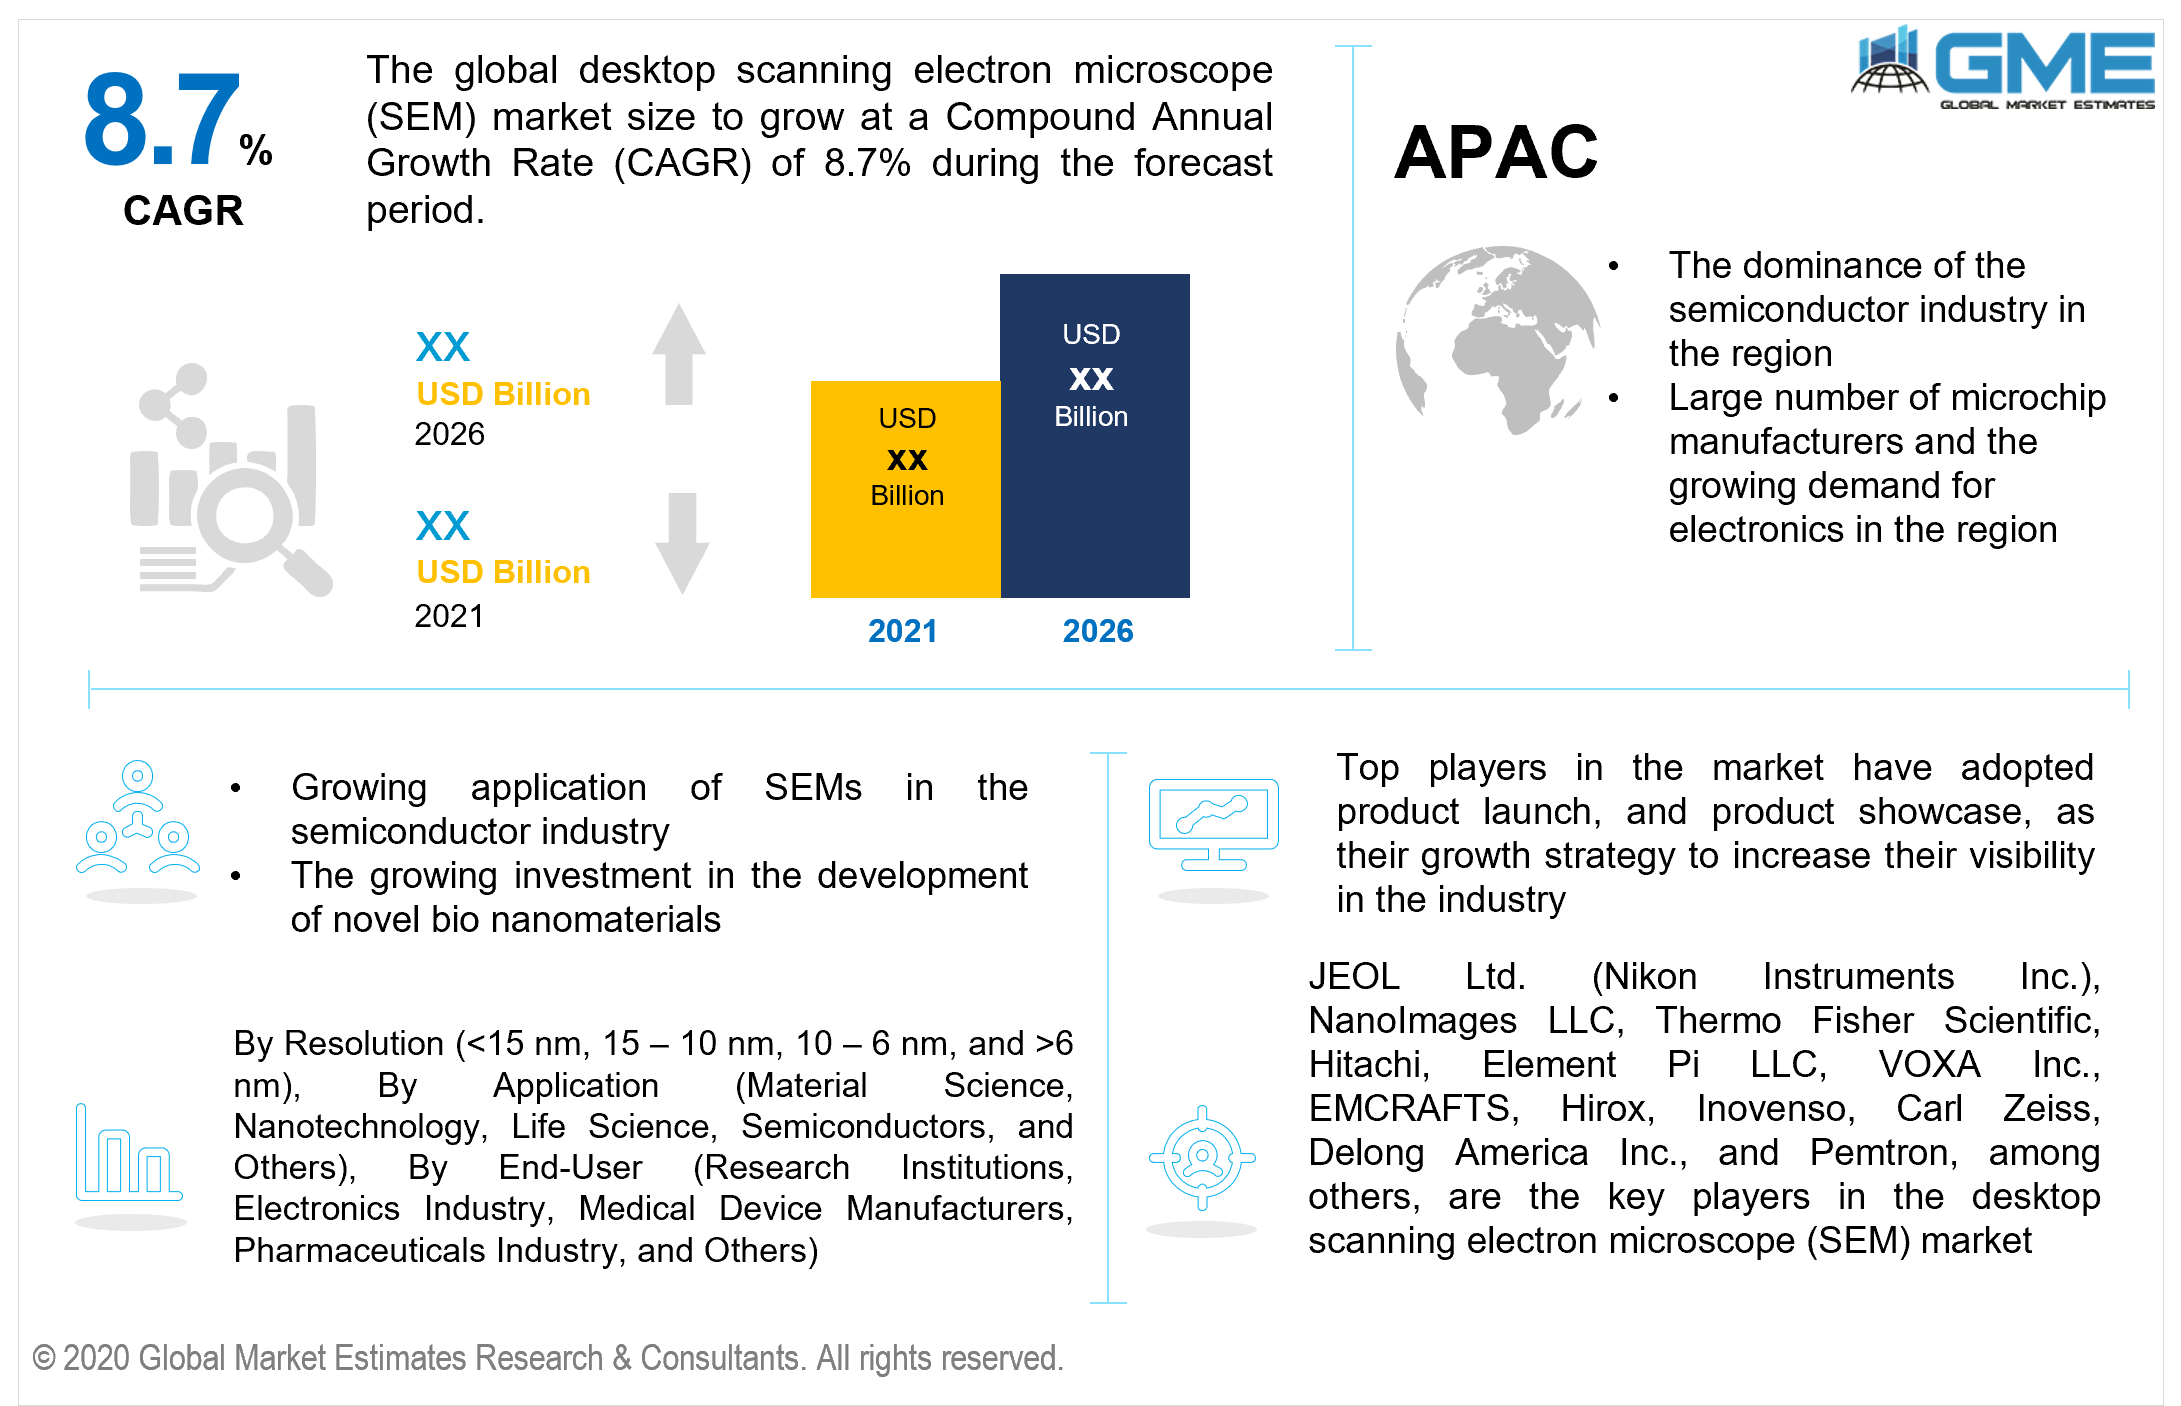
The global desktop scanning electron microscope (SEM) market is projected to grow at a CAGR value of 8.7% between 2021 to 2026. The growing investment in research activities to develop novel nanomaterials and nanotechnology-based products has been instrumental to the growth of the SEM market. The electronics industry has witnessed devices becoming smaller and smaller leading to even greater demand for smaller components. Among these components, chips and semiconductor devices have become increasingly microscopic in size. The pharmaceuticals industry and the medical devices industry have also begun increasing their investment in the research and development of bio-active nanomaterials.
The semiconductor industry’s utilization of lithography chip manufacturing techniques such as electron-beam lithography has increased the demand for surface mapping of wafers for quality assurance. Scanning electron microscopes are becoming commonly used in inspection systems in the semiconductor industry to detect wafer defects. They are also used in the fabrication process to study the impact of new fabrication and production techniques.
The pharmaceuticals industry has been using these microscopes to test samples, test new vaccinations and medicines, identify diseases and bacteria, and various other topology, morphology, and composition studies. The high-resolution images provided by scanning electron microscopes have slowly become vital in the development of novel biomaterials such as drug delivery systems, nanomaterial-based implants, and other materials.
In material science research, these microscopes are used in the study of nanotubes, nanofibres, high-temperature superconductors, and mesoporous architectures and alloy strength of nanomaterials.
The high cost of conventional scanning electron microscopes has often limited their application in various industries other than for research purposes. The advent of desktop or tabletop scanning electron microscopes has played a vital role in the growing adoption of SEMs for various applications. Criminal investigators have also begun utilizing these microscopes for forensic investigations for gunshot residue analysis, bullet marking comparisons, fibre analysis, and various other applications where high-resolution imaging is applicable. The portability of these desktop units has made it possible for industries to create moving laboratories for quality assurance and inspection purposes. Desktop SEMs are relatively more user friendly, easier to transport and store, faster data collection and characterization, and are more cost-effective than their bulky counterparts.
The COVID-19 pandemic has caused various disruptions in the working of various manufacturing and research activities of various industries. The falling revenue has seen industries become cautious in implementing new instruments and upgrading older systems which have had a negative impact on the market. The increased focus on medical science research and the need for novel medicines and vaccines are expected to have a positive impact on the market during the forecast period.
The market is restrained by the cost of these devices, complexities in sample preparation, maintenance costs, and the need for skilled professionals to run these microscopes.
Based on the various resolutions of scanning electron microscopes available in the market, the market is segmented into <15 nm, 15 – 10 nm, 10 – 6 nm, and >6 nm. The 15-10 nm segment is expected to clutch the lion’s share of the market. Most uses within the semiconductor industry lie within this range as well as other research activities across other applications. These microscopes are cheaper than those offering even finer resolutions and have been more widely utilized by laboratories and research departments across the globe.
The 10-6 nm segment is expected to witness the fastest growth rate during the forecast period. The growing development of novel nanomaterials and growing demand for even finer lithography techniques in the semiconductor industry is expected to drive the demand for the 10-6 nm range of SEMs.
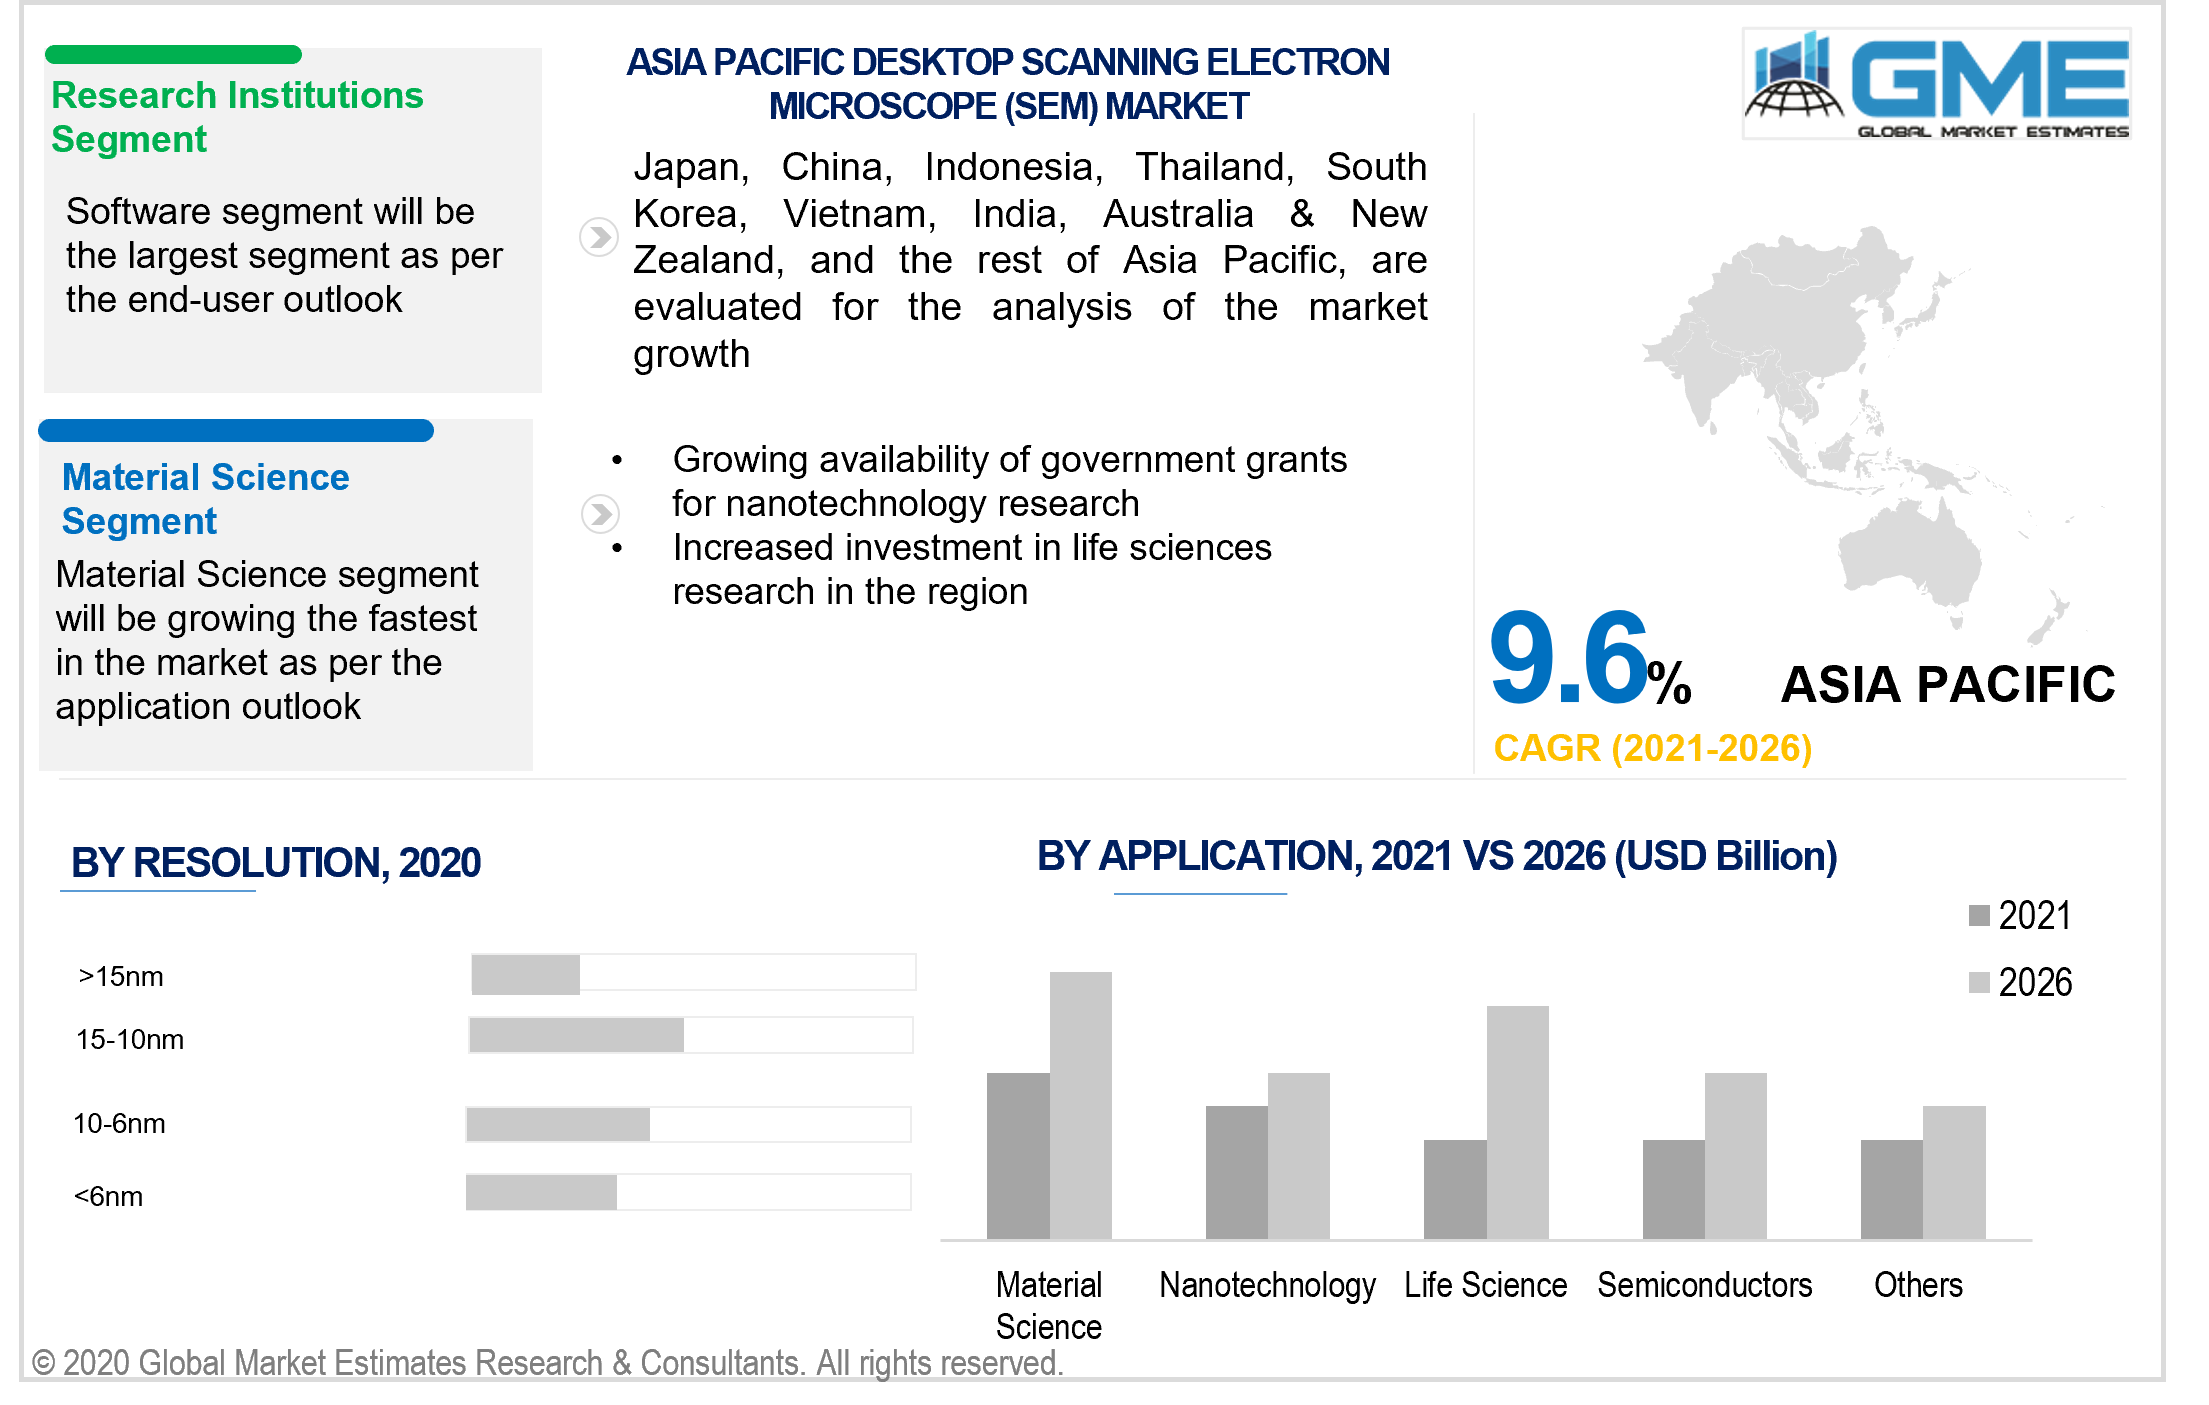
Based on the application, the market is segmented into material science, nanotechnology, life science, semiconductors, and others. The materials science segment is expected to hold the dominant share of the market during the forecast period. The large demand for defect analysis, development of novel nanomaterials, and quality control are the biggest contributors to the dominance of the material sciences segment.
The life science segment is expected to register the fastest growth rate during the forecast period. The growing demand for the development of novel vaccines and greater investment into the research and development of medicines and new biomaterials are expected to drive the segment.
Based on the end-users, the market is segmented into research institutions, electronics industry, medical device manufacturers, pharmaceuticals industry, and others. The research institutions segment is expected to hold the lion’s share of the market. Growing funding for research institutions, collaborations with companies, and the growing research activities into nanotechnology have contributed to the greater adoption of SEMs in the research institutions segment.
The electronics industry is expected to become the fastest-growing segment during the forecast period. The growing adoption of SEMs for quality control in inspection systems for microchip manufactures, their growing application in the semiconductors industry, and the growing demand for electronics are expected to drive the segment.
Based on region, the market can be broken into various regions such as North America, Europe, Central and South America, Middle East and North Africa, and Asia Pacific regions.
The APAC region is expected to be the dominant force in the market during the forecast period and is expected to grow at the fastest rate during the forecast period. The dominance of the semiconductor industry in the region especially the concentration of major microchip manufacturers has been crucial in the dominance of the region in the desktop SEM market.
The growing investment in research institutions, availability of greater funding through government grants, and increasing research into novel nanomaterials in the region have helped the development of the desktop SEM market in the region.
JEOL Ltd. (Nikon Instruments Inc.), NanoImages LLC, Thermo Fisher Scientific, Hitachi, Element Pi LLC, VOXA Inc., EMCRAFTS, Hirox, Inovenso, Carl Zeiss, Delong America Inc., and Pemtron, among others, are the key players in the desktop scanning electron microscope (SEM) market.
Please note: This is not an exhaustive list of companies profiled in the report.
Chapter 1 Methodology
1.1 Market Scope & Definitions
1.2 Estimates & Forecast Calculation
1.3 Historical Data Overview and Validation
1.4 Data Sources
1.4.1 Secondary
1.4.2 Primary
Chapter 2 Report Outlook
2.1 Desktop Scanning Electron Microscope (SEM) Industry Overview, 2020-2026
2.1.1 Industry Overview
2.1.2 Resolution Overview
2.1.3 Application Overview
2.1.4 End-User Overview
2.1.6 Regional Overview
Chapter 3 Desktop Scanning Electron Microscope (SEM) Market Trends
3.1 Market Segmentation
3.2 Industry Background, 2020-2026
3.3 Market Key Trends
3.3.1 Positive Trends
3.3.1.1 Risinginvestment in nanotechnology and material science research
3.3.2 Industry Challenges
3.3.2.1 Cost of desktop SEMs, complex sample preparation, and the high minatenance costs
3.4 Prospective Growth Scenario
3.4.1 Resolution Growth Scenario
3.4.2 Application Growth Scenario
3.4.3 End-User Growth Scenario
3.5 COVID-19 Influence over Industry Growth
3.6 Porter’s Analysis
3.7 PESTEL Analysis
3.8 Value Chain & Supply Chain Analysis
3.9 Regulatory Framework
3.9.1 North America
3.9.2 Europe
3.9.3 APAC
3.9.4 LATAM
3.9.5 MEA
3.10 End-User Overview
3.11 Market Share Analysis, 2020
3.11.1 Company Positioning Overview, 2020
Chapter 4 Desktop Scanning Electron Microscope (SEM) Market, By Resolution
4.1 Resolution Outlook
4.2 >15 nm
4.2.1 Market Size, By Region, 2020-2026 (USD Million)
4.3 15 - 10nm
4.3.1 Market Size, By Region, 2020-2026 (USD Million)
4.4 10 - 6nm
4.4.1 Market Size, By Region, 2020-2026 (USD Million)
4.5 <6nm
4.5.1 Market Size, By Region, 2020-2026 (USD Million)
Chapter 5 Desktop Scanning Electron Microscope (SEM) Market, By Application
5.1 Application Outlook
5.2 Material Science
5.2.1 Market Size, By Region, 2020-2026 (USD Million)
5.3 Nanotechnology
5.3.1 Market Size, By Region, 2020-2026 (USD Million)
5.4 Life Science
5.4.1 Market Size, By Region, 2020-2026 (USD Million)
5.5 Semiconductors
5.5.1 Market Size, By Region, 2020-2026 (USD Million)
5.6 Others
5.6.1 Market Size, By Region, 2020-2026 (USD Million)
Chapter 6 Desktop Scanning Electron Microscope (SEM) Market, By End-User
6.1 Research Institutions
6.1.1 Market Size, By Region, 2020-2026 (USD Million)
6.2 Electronics Industry
6.2.1 Market Size, By Region, 2020-2026 (USD Million)
6.3 Medical Device Manufacturers
6.3.1 Market Size, By Region, 2020-2026 (USD Million)
6.4 Pharmaceuticals Indutry
6.4.1 Market Size, By Region, 2020-2026 (USD Million)
6.5 Others
6.5.1 Market Size, By Region, 2020-2026 (USD Million)
Chapter 7 Desktop Scanning Electron Microscope (SEM) Market, By Region
7.1 Regional outlook
7.2 North America
7.2.1 Market Size, By Country 2020-2026 (USD Million)
7.2.2 Market Size, By Resolution, 2020-2026 (USD Million)
7.2.3 Market Size, By Application, 2020-2026 (USD Million)
7.2.4 Market Size, By End-User, 2020-2026 (USD Million)
7.2.6 U.S.
7.2.6.1 Market Size, By Resolution, 2020-2026 (USD Million)
7.2.4.2 Market Size, By Application, 2020-2026 (USD Million)
7.2.4.3 Market Size, By End-User, 2020-2026 (USD Million)
7.2.7 Canada
7.2.7.1 Market Size, By Resolution, 2020-2026 (USD Million)
7.2.7.2 Market Size, By Application, 2020-2026 (USD Million)
7.2.7.3 Market Size, By End-User, 2020-2026 (USD Million)
7.3 Europe
7.3.1 Market Size, By Country 2020-2026 (USD Million)
7.3.2 Market Size, By Resolution, 2020-2026 (USD Million)
7.3.3 Market Size, By Application, 2020-2026 (USD Million)
7.3.4 Market Size, By End-User, 2020-2026 (USD Million)
7.3.6 Germany
7.3.6.1 Market Size, By Resolution, 2020-2026 (USD Million)
7.3.6.2 Market Size, By Application, 2020-2026 (USD Million)
7.3.6.3 Market Size, By End-User, 2020-2026 (USD Million)
7.3.7 UK
7.3.7.1 Market Size, By Resolution, 2020-2026 (USD Million)
7.3.7.2 Market Size, By Application, 2020-2026 (USD Million)
7.3.7.3 Market Size, By End-User, 2020-2026 (USD Million)
7.3.8 France
7.3.7.1 Market Size, By Resolution, 2020-2026 (USD Million)
7.3.7.2 Market Size, By Application, 2020-2026 (USD Million)
7.3.7.3 Market Size, By End-User, 2020-2026 (USD Million)
7.3.9 Italy
7.3.9.1 Market Size, By Resolution, 2020-2026 (USD Million)
7.3.9.2 Market Size, By Application, 2020-2026 (USD Million)
7.3.9.3 Market Size, By End-User, 2020-2026 (USD Million)
7.3.10 Spain
7.3.10.1 Market Size, By Resolution, 2020-2026 (USD Million)
7.3.10.2 Market Size, By Application, 2020-2026 (USD Million)
7.3.10.3 Market Size, By End-User, 2020-2026 (USD Million)
7.3.11 Russia
7.3.11.1 Market Size, By Resolution, 2020-2026 (USD Million)
7.3.11.2 Market Size, By Application, 2020-2026 (USD Million)
7.3.11.3 Market Size, By End-User, 2020-2026 (USD Million)
7.4 Asia Pacific
7.4.1 Market Size, By Country 2020-2026 (USD Million)
7.4.2 Market Size, By Resolution, 2020-2026 (USD Million)
7.4.3 Market Size, By Application, 2020-2026 (USD Million)
7.4.4 Market Size, By End-User, 2020-2026 (USD Million)
7.4.6 China
7.4.6.1 Market Size, By Resolution, 2020-2026 (USD Million)
7.4.6.2 Market Size, By Application, 2020-2026 (USD Million)
7.4.6.3 Market Size, By End-User, 2020-2026 (USD Million)
7.4.7 India
7.4.7.1 Market Size, By Resolution, 2020-2026 (USD Million)
7.4.7.2 Market Size, By Application, 2020-2026 (USD Million)
7.4.7.3 Market Size, By End-User, 2020-2026 (USD Million)
7.4.8 Japan
7.4.7.1 Market Size, By Resolution, 2020-2026 (USD Million)
7.4.7.2 Market Size, By Application, 2020-2026 (USD Million)
7.4.7.3 Market Size, By End-User, 2020-2026 (USD Million)
7.4.9 Australia
7.4.9.1 Market Size, By Resolution, 2020-2026 (USD Million)
7.4.9.2 Market size, By Application, 2020-2026 (USD Million)
7.4.9.3 Market Size, By End-User, 2020-2026 (USD Million)
7.4.10 South Korea
7.4.10.1 Market Size, By Resolution, 2020-2026 (USD Million)
7.4.10.2 Market Size, By Application, 2020-2026 (USD Million)
7.4.10.3 Market Size, By End-User, 2020-2026 (USD Million)
7.5 Latin America
7.5.1 Market Size, By Country 2020-2026 (USD Million)
7.5.2 Market Size, By Resolution, 2020-2026 (USD Million)
7.5.3 Market Size, By Application, 2020-2026 (USD Million)
7.5.4 Market Size, By End-User, 2020-2026 (USD Million)
7.5.6 Brazil
7.5.6.1 Market Size, By Resolution, 2020-2026 (USD Million)
7.5.6.2 Market Size, By Application, 2020-2026 (USD Million)
7.5.6.3 Market Size, By End-User, 2020-2026 (USD Million)
7.5.7 Mexico
7.5.7.1 Market Size, By Resolution, 2020-2026 (USD Million)
7.5.7.2 Market Size, By Application, 2020-2026 (USD Million)
7.5.7.3 Market Size, By End-User, 2020-2026 (USD Million)
7.5.8 Argentina
7.5.7.1 Market Size, By Resolution, 2020-2026 (USD Million)
7.5.7.2 Market Size, By Application, 2020-2026 (USD Million)
7.5.7.3 Market Size, By End-User, 2020-2026 (USD Million)
7.6 MEA
7.6.1 Market Size, By Country 2020-2026 (USD Million)
7.6.2 Market Size, By Resolution, 2020-2026 (USD Million)
7.6.3 Market Size, By Application, 2020-2026 (USD Million)
7.6.4 Market Size, By End-User, 2020-2026 (USD Million)
7.6.6 Saudi Arabia
7.6.6.1 Market Size, By Resolution, 2020-2026 (USD Million)
7.6.6.2 Market Size, By Application, 2020-2026 (USD Million)
7.6.6.3 Market Size, By End-User, 2020-2026 (USD Million)
7.6.7 UAE
7.6.7.1 Market Size, By Resolution, 2020-2026 (USD Million)
7.6.7.2 Market Size, By Application, 2020-2026 (USD Million)
7.6.7.3 Market Size, By End-User, 2020-2026 (USD Million)
7.6.8 South Africa
7.6.7.1 Market Size, By Resolution, 2020-2026 (USD Million)
7.6.7.2 Market Size, By Application, 2020-2026 (USD Million)
7.6.7.3 Market Size, By End-User, 2020-2026 (USD Million)
Chapter 8 Company Landscape
8.1 Competitive Analysis, 2020
8.2 JEOL Ltd.
8.2.1 Company Overview
8.2.2 Financial Analysis
8.2.3 Strategic Positioning
8.2.4 Info Graphic Analysis
8.3 NanoImages LLC
8.3.1 Company Overview
8.3.2 Financial Analysis
8.3.3 Strategic Positioning
8.3.4 Info Graphic Analysis
8.4 Thermo Fisher Scientific
8.4.1 Company Overview
8.4.2 Financial Analysis
8.4.3 Strategic Positioning
8.4.4 Info Graphic Analysis
8.5 Hitachi
8.5.1 Company Overview
8.5.2 Financial Analysis
8.5.3 Strategic Positioning
8.5.4 Info Graphic Analysis
8.6 Element Pi LLC
8.6.1 Company Overview
8.6.2 Financial Analysis
8.6.3 Strategic Positioning
8.6.4 Info Graphic Analysis
8.7 VOXA Inc.
8.7.1 Company Overview
8.7.2 Financial Analysis
8.7.3 Strategic Positioning
8.7.4 Info Graphic Analysis
8.8 EMCRAFTS
8.8.1 Company Overview
8.8.2 Financial Analysis
8.8.3 Strategic Positioning
8.8.4 Info Graphic Analysis
8.9 EMCRAFTS
8.8.1 Company Overview
8.8.2 Financial Analysis
8.8.3 Strategic Positioning
8.8.4 Info Graphic Analysis
8.10 Inovenso
8.10.1 Company Overview
8.10.2 Financial Analysis
8.10.3 Strategic Positioning
8.10.4 Info Graphic Analysis
8.11 Other Companies
8.11.1 Company Overview
8.11.2 Financial Analysis
8.11.3 Strategic Positioning
8.11.4 Info Graphic Analysis
The Global Desktop Scanning Electron Microscope (SEM) Market has been studied from the year 2019 till 2026. However, the CAGR provided in the report is from the year 2021 to 2026. The research methodology involved three stages: Desk research, Primary research, and Analysis & Output from the entire research process.

The desk research involved a robust background study which meant referring to paid and unpaid databases to understand the market dynamics; mapping contracts from press releases; identifying the key players in the market, studying their product portfolio, competition level, annual reports/SEC filings & investor presentations; and learning the demand and supply-side analysis for the Desktop Scanning Electron Microscope (SEM) Market.

The primary research activity included telephonic conversations with more than 50 tier 1 industry consultants, distributors, and end-use product manufacturers.

Finally, based on the above thorough research process, an in-depth analysis was carried out considering the following aspects: market attractiveness, current & future market trends, market share analysis, SWOT analysis of the company and customer analytics.

Frequently Asked Questions

This FREE sample includes market data points, ranging from trend analyses to market estimates & forecasts. See for yourself.
Or view our licence options:
Tailor made solutions just for you
80% of our clients seek made-to-order reports. How do you want us to tailor yours?
OUR CLIENTS


