This report was recently updated on July 5 2025 with the latest and most recent
market numbers
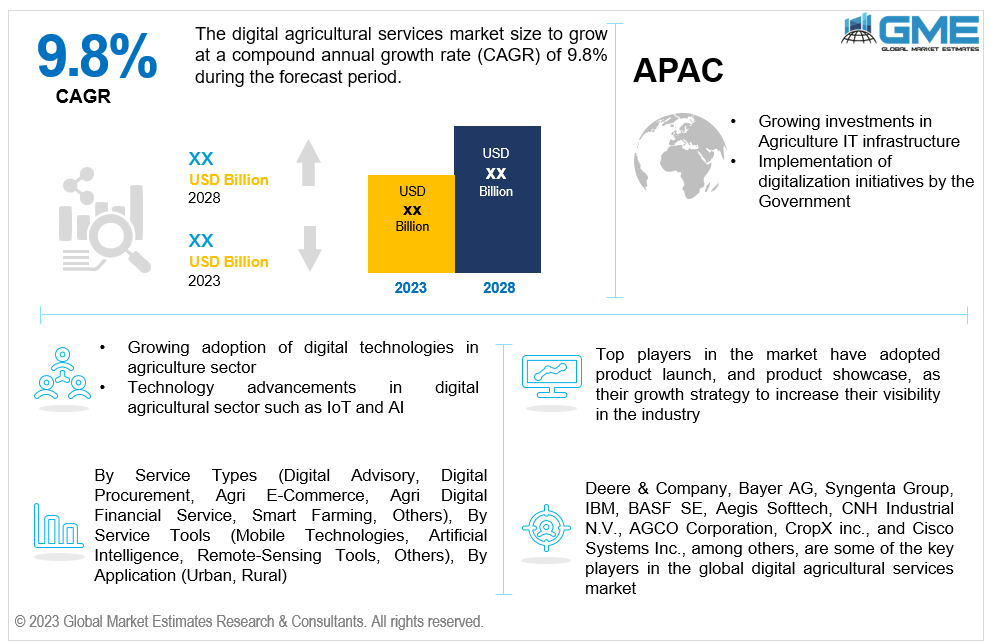
Global Digital Agricultural Services Market Size, Trends & Analysis - Forecasts to 2028 By Service Type (Digital Advisory, Digital Procurement, Agri E-Commerce, Agri Digital Financial Service, Smart Farming, Others), By Service Tool (Mobile Technologies, Artificial Intelligence, Remote-Sensing Tools, Others), By Application (Urban, Rural), By Region (North America, Asia Pacific, Central & South America, Europe, the Middle East and Africa), Competitive Landscape, Company Market Share Analysis, and Competitor Analysis
The global digital agricultural services market is projected to grow at a CAGR of 9.8% from 2023 to 2028.
Digital agricultural services refer to the use of digital technologies and platforms to provide various services and solutions to the agricultural industry. These services leverage digital tools, such as farm management software, precision agriculture technologies, remote sensing, data analytics, and internet of things (IoT) devices, to optimise agricultural practises and improve productivity.
The growing adoption of precision agriculture techniques is one of the major drivers that is expected to enhance the market’s growth. Advanced tools (such as sensors, drones, and satellite imagery) are used to gather real-time data on soil conditions, weather patterns, and crop health. Furthermore, digital agricultural services provide farmers access to online platforms and mobile applications that can provide services (such as farm management systems, marketplaces for weather forecasting, buying and selling agricultural products, and pest and disease monitoring). It helps the farmers streamline their workflow, improve decision-making, gain access to broader markets, and increase profitability and efficiency.
The digital agricultural services market is driven by several key factors. Firstly, the growing global population and increasing food demand necessitate the adoption of advanced technologies to enhance agricultural productivity and efficiency. Digital solutions enable farmers to optimise their operations, improve resource management, and increase yields to meet rising food requirements.
Secondly, the need for sustainable agriculture practises and environmental conservation acts as a driver for digital agricultural services. These services provide farmers with tools to implement precision agriculture techniques, minimise the use of agrochemicals, and reduce environmental impact. By leveraging digital technologies such as remote sensing, data analytics, and IoT devices, farmers can make informed decisions regarding crop management, resource allocation, and conservation practises.
Thirdly, the increasing availability of affordable and accessible technology contributes to the growth of the digital agricultural services market. The proliferation of smartphones, internet connectivity, and cloud computing enables farmers, even in remote areas, to access and benefit from digital solutions. This democratisation of technology empowers farmers with valuable information, market insights, and advisory services, improving their decision-making capabilities.
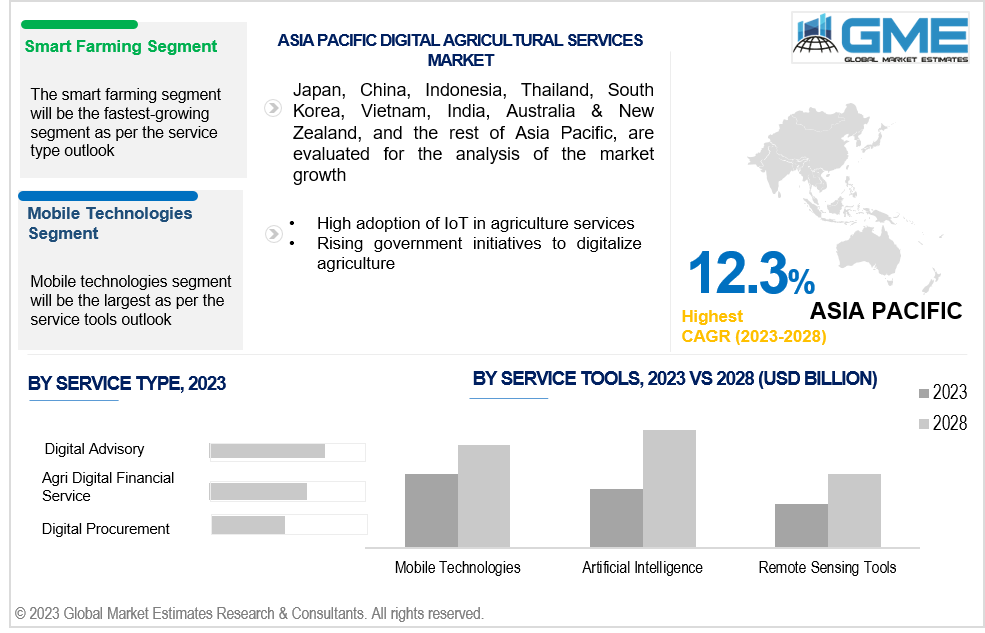
The smart farming segment is expected to be the fastest-growing segment in the market from 2023-2028. This is majorly attributed to growing need to produce more food to feed the growing number of population and sustainable agricultural practices that offer innovative solutions to minimize the use of water, fertilizers, and pesticides. Furthermore, the market growth of smart farming is due to technological development such as the Internet of Things (IoT), artificial intelligence (AI), and big data analytics.
Artificial intelligence is anticipated to be the fastest-growing segment in the market from 2023-2028. This is due to rapid adoption of AI technologies that offers a solution by helping farmers to optimize their farming practices (such as precision agriculture, through the collection & analysis of vast amounts of data). AI algorithms analyze data from sensors, drones, and satellites to provide valuable insights on soil conditions, crop health, and irrigation needs. Furthermore, the advancement in sensor technologies and the Internet of Things (IoT) across agriculture sector will enhance the market growth of artificial intelligence segment.
The mobile technologies segment holds the largest share of the market. This is due to the widespread availability and affordability of mobile devices have been instrumental in driving their adoption in the agricultural sector.
The rural segment is anticipated to be the fastest-growing segment in the market from 2023-2028. The market growth is mainly attributed to the increasing adoption of smartphones & internet connectivity in rural areas that has opened new opportunities for digital services. Also, government have implemented supportive regulations to expand the connection with farmers, digitally, which will help in the growth of rural segment in digital agricultural services market.
The urban segment holds the largest share in the digital agricultural services market. Large share is mainly attributed to the need for more efficient and sustainable agricultural practices, which can be facilitated through digital services. Furthermore, the technological advancements made the farmers and agricultural businesses to access & utilize digital tools and services (such as precision agriculture, remote sensing, and data analytics), which can help farmers optimize their resources and increase their productivity.
North America is expected to hold the largest share in digital agricultural services market. This is mainly attributed to favourable regulations and policies implemented by government, which includes the digitalization of agriculture infrastructure and increasing awareness among farmers related to the benefits of digital literacy on agriculture industry. ?Growing focus of key market players on the digital technologies, increasing awareness about digital platforms used in agriculture industry, growing penetration of the internet and smartphones in agriculture facilities, and the rising adoption of agriculture-related applications are the other factors helps in the growth of North America digital agricultural services market.
Furthermore, Asia Pacific is expected to grow the fastest during the forecast period. This is primarily due to the increasing investments and R&D activities in their agriculture IT infrastructure. In emerging countries such as China and India, high focus on agriculture digitalization by the government, which helps in the adoption of digital agriculture solutions among the agriculture facilities.
Deere & Company, Bayer AG, Syngenta Group, IBM, BASF SE, Aegis Softtech, CNH Industrial N.V., AGCO Corporation, CropX inc., and Cisco Systems Inc., among others, are some of the key players in the global digital agricultural services market.
Please note: This is not an exhaustive list of companies profiled in the report.
1 STRATEGIC INSIGHTS ON NEW REVENUE POCKETS
1.1 Strategic Opportunity & Attractiveness Analysis
1.1.1 Hot Revenue Pockets
1.1.2 Market Attractiveness Score
1.1.3 Revenue Impacting Opportunity
1.1.4 High Growing Region/Country
1.1.5 Competitor Analysis
1.1.6 Consumer Analysis
1.2 Global Market Estimates' View
1.3 Strategic Insights across Business Functions
1.3.1 For Chief Executive Officers
1.3.2 For Chief Marketing Officers
1.3.3 For Chief Strategy Officers
1.4 Evaluate the Potential of your Existing Business Lines vs. New Lines to Enter Into
2.1 Technological Adoption Rate
2.2 Current Trend Impact Analysis
2.3 Future Trend Impact Analysis
2.4 Data Metrics on Feed Stocks
3.1.2 Adjacent Market Opportunities
3.1.3 Ancillary Market Opportunities
3.2.1 Market Drivers: Impact Analysis
3.2.2 Market Restraints: Impact Analysis
3.2.3 Market Opportunities: Impact Analysis
3.2.4 Market Challenges: Impact Analysis
3.3.1 Porter’s Five Forces Analysis
3.3.1.1 Threat of New Entrants
3.3.1.2 Threat of New Substitutes
3.3.1.3 Bargaining Power of Suppliers
3.3.1.4 Bargaining Power of Buyers
3.3.1.5 Intensity of Competitive Rivalry
3.3.2 SWOT Analysis; By Factor (Political & Legal, Economic, and Technological)
4 GLOBAL DIGITAL AGRICULTURAL SERVICES MARKET, BY SERVICE TYPE
4.2 Digital Agricultural Services Market: Service Type Scope Key Takeaways
4.3 Revenue Growth Analysis, 2022 & 2028
4.4.1 Digital Advisory Market Estimates and Forecast, 2020-2028 (USD Million)
4.5.1 Digital Procurement Market Estimates and Forecast, 2020-2028 (USD Million)
4.6.1 Agri e-commerce Market Estimates and Forecast, 2020-2028 (USD Million)
4.6 Agri digital financial service
4.6.1 Agri digital financial service Market Estimates and Forecast, 2020-2028 (USD Million)
4.6.1 Smart Farming Market Estimates and Forecast, 2020-2028 (USD Million)
4.6.1 Others Market Estimates and Forecast, 2020-2028 (USD Million)
5 GLOBAL DIGITAL AGRICULTURAL SERVICES MARKET, BY SERVICE TOOLS AREA
5.2 Digital Agricultural Services Market: Service Tools Scope Key Takeaways
5.3 Revenue Growth Analysis, 2022 & 2028
5.4.1 Mobile Technologies Market Estimates and Forecast, 2020-2028 (USD Million)
5.5.1 Artificial intelligence Market Estimates and Forecast, 2020-2028 (USD Million)
5.6.1 Remote-Sensing Tools Market Estimates and Forecast, 2020-2028 (USD Million)
5.7.1 Others Market Estimates and Forecast, 2020-2028 (USD Million)
6 GLOBAL DIGITAL AGRICULTURAL SERVICES MARKET, BY APPLICATION
6.2 Digital Agricultural Services Market: Application Scope Key Takeaways
6.3 Revenue Growth Analysis, 2022 & 2028
6.4.1 Urban Market Estimates and Forecast, 2020-2028 (USD Million)
6.5.1 Rural Market Estimates and Forecast, 2020-2028 (USD Million)
7 GLOBAL DIGITAL AGRICULTURAL SERVICES MARKET, BY REGION
7.2.1 By Service Type
7.2.5.1 U.S. Digital Agricultural Services Market Estimates and Forecast, 2020-2028 (USD Million)
7.2.5.1.1 By Service Type
7.2.5.2 Canada Digital Agricultural Services Market Estimates and Forecast, 2020-2028 (USD Million)
7.2.5.2.1 By Service Type
7.2.5.3 Mexico Digital Agricultural Services Market Estimates and Forecast, 2020-2028 (USD Million)
7.2.5.3.1 By Service Type
7.3 Europe Digital Agricultural Services Market Estimates and Forecast, 2020-2028 (USD Million)
7.3.1 By Service Type
7.3.5.1 Germany Digital Agricultural Services Market Estimates and Forecast, 2020-2028 (USD Million)
7.3.5.1.1 By Service Type
7.3.5.2 U.K. Digital Agricultural Services Market Estimates and Forecast, 2020-2028 (USD Million)
7.3.5.2.1 By Service Type
7.3.5.3 France Digital Agricultural Services Market Estimates and Forecast, 2020-2028 (USD Million)
7.3.5.3.1 By Service Type
7.3.5.4 Italy Digital Agricultural Services Market Estimates and Forecast, 2020-2028 (USD Million)
7.3.5.4.1 By Service Type
7.3.5.5 Spain Digital Agricultural Services Market Estimates and Forecast, 2020-2028 (USD Million)
7.3.5.5.1 By Service Type
7.3.5.6.1 By Service Type
7.3.5.7.1 By Service Type
7.4.1 By Service Type
7.4.5.1 China Digital Agricultural Services Market Estimates and Forecast, 2020-2028 (USD Million)
7.4.5.1.1 By Service Type
7.4.5.2 Japan Digital Agricultural Services Market Estimates and Forecast, 2020-2028 (USD Million)
7.4.5.2.1 By Service Type
7.4.5.3 India Digital Agricultural Services Market Estimates and Forecast, 2020-2028 (USD Million)
7.4.5.3.1 By Service Type
7.4.5.4.1 By Service Type
7.4.5.5.1 By Service Type
7.4.5.6.1 By Service Type
7.4.5.7.1 By Service Type
7.4.5.7.1 By Service Type
7.4.5.9 Vietnam Digital Agricultural Services Market Estimates and Forecast, 2020-2028 (USD Million)
7.4.5.7.1 By Service Type
7.4.5.10 Taiwan Digital Agricultural Services Market Estimates and Forecast, 2020-2028 (USD Million)
7.4.5.8.1 By Service Type
7.4.5.9.1 By Service Type
7.5.1 By Service Type
7.5.5.1.1 By Service Type
7.5.5.2 U.A.E. Digital Agricultural Services Market Estimates and Forecast, 2020-2028 (USD Million)
7.5.5.1.1 By Service Type
7.5.5.3 Israel Digital Agricultural Services Market Estimates and Forecast, 2020-2028 (USD Million)
7.2.5.1.1 By Service Type
7.2.5.1.1 By Service Type
7.5.5.5.1 By Service Type
7.6.5.1 Brazil Digital Agricultural Services Market Estimates and Forecast, 2020-2028 (USD Million)
7.6.5.1.1 By Service Type
7.6.5.2.1 By Service Type
7.6.5.3 Chile Digital Agricultural Services Market Estimates and Forecast, 2020-2028 (USD Million)
7.6.5.3.1 By Service Type
7.2.5.4.1 By Service Type
8.1 Company Market Share Analysis
8.2 Four Quadrant Positioning Matrix
8.4.1.1 Business Description & Financial Analysis
8.4.1.3 Products & Services Offered
8.4.1.4 Strategic Alliances between Business Partners
8.4.2.1 Business Description & Financial Analysis
8.4.2.3 Products & Services Offered
8.4.2.4 Strategic Alliances between Business Partners
8.4.3.1 Business Description & Financial Analysis
8.4.3.3 Products & Services Offered
8.4.3.4 Strategic Alliances between Business Partners
8.4.4.1 Business Description & Financial Analysis
8.4.4.3 Products & Services Offered
8.4.4.4 Strategic Alliances between Business Partners
8.4.5.1 Business Description & Financial Analysis
8.4.5.3 Products & Services Offered
8.4.5.4 Strategic Alliances between Business Partners
8.4.6.1 Business Description & Financial Analysis
8.4.6.3 Products & Services Offered
8.4.6.4 Strategic Alliances between Business Partners
8.4.7.1 Business Description & Financial Analysis
8.4.7.3 Products & Services Offered
8.4.7.4 Strategic Alliances between Business Partners
8.4.7.1 Business Description & Financial Analysis
8.4.7.3 Products & Services Offered
8.4.7.4 Strategic Alliances between Business Partners
8.4.7.1 Business Description & Financial Analysis
8.4.7.3 Products & Services Offered
8.4.7.4 Strategic Alliances between Business Partners
8.4.10 Hummingbird Technologies Limited
8.4.8.1 Business Description & Financial Analysis
8.4.8.3 Products & Services Offered
8.4.8.4 Strategic Alliances between Business Partners
8.4.9.1 Business Description & Financial Analysis
8.4.9.3 Products & Services Offered
8.4.9.4 Strategic Alliances between Business Partners
9.1.2 Market Scope & SegOrchidtation
9.2 Information ProcureOrchidt
9.2.1.2 GMEs Internal Data Repository
9.2.1.3 Secondary Resources & Third Party Perspectives
9.2.1.4 Company Information Sources
9.2.2.1 Various SERVICE TOOLS of Respondents for Primary Interviews
9.2.2.2 Number of Interviews Conducted throughout the Research Process
9.2.2.4 Discussion Guide for Primary Participants
9.2.3.1 Expert Panels Across 30+ Industry
9.2.4.1 Paid Local Experts Across 30+ Industry Across each Region
9.3.1.1 Macro-Economic Indicators Considered
9.3.1.2 Micro-Economic Indicators Considered
9.3.2.1 Company Share Analysis Approach
9.3.2.2 Estimation of Potential Product Sales
9.4.2 Time Series, Cross Sectional & Panel Data Analysis
9.5.1 Inhouse AI Based Real Time Analytics Tool
9.5.2 Output From Desk & Primary Research
9.6 Research Assumptions & Limitations
LIST OF TABLES
1 Global Digital Agricultural Services Market, By Service, 2020-2028 (USD Mllion)
2 Digital Advisory Market, By Region, 2020-2028 (USD Mllion)
3 Digital Procurement Market, By Region, 2020-2028 (USD Mllion)
4 Agri e-commerce Market, By Region, 2020-2028 (USD Mllion)
5 Agri Agri digital financial service Market, By Region, 2020-2028 (USD Mllion)
6 Smart farming Market, By Region, 2020-2028 (USD Mllion)
7 Global Digital Agricultural Services Market, By Service Tools, 2020-2028 (USD Mllion)
8 Mobile Technologies Market, By Region, 2020-2028 (USD Mllion)
9 Artificial intelligence Market, By Region, 2020-2028 (USD Mllion)
10 Remote-Sensing Tools Market, By Region, 2020-2028 (USD Mllion)
11 others Market, By Region, 2020-2028 (USD Mllion)
12 Global Digital Agricultural Services Market, By Application, 2020-2028 (USD Mllion)
13 Urban Market, By Region, 2020-2028 (USD Mllion)
14 Rural Market, By Region, 2020-2028 (USD Mllion)
15 Regional Analysis, 2020-2028 (USD Mllion)
16 North America Digital Agricultural Services Market, By Service Type, 2020-2028 (USD Million)
17 North America Digital Agricultural Services Market, By Service Tools, 2020-2028 (USD Million)
18 North America Digital Agricultural Services Market, By Application, 2020-2028 (USD Million)
19 North America Digital Agricultural Services Market, By End user, 2020-2028 (USD Million)
20 North America Digital Agricultural Services Market, By Country, 2020-2028 (USD Million)
21 U.S Digital Agricultural Services Market, By Service, 2020-2028 (USD Million)
22 U.S Digital Agricultural Services Market, By Service Tools, 2020-2028 (USD Million)
23 U.S Digital Agricultural Services Market, By Application, 2020-2028 (USD Million)
24 U.S Digital Agricultural Services Market, By END USER, 2020-2028 (USD Million)
25 Canada Digital Agricultural Services Market, By Service, 2020-2028 (USD Million)
26 Canada Digital Agricultural Services Market, By Service Tools, 2020-2028 (USD Million)
27 Canada Digital Agricultural Services Market, By Application, 2020-2028 (USD Million)
28 CANADA Digital Agricultural Services Market, By END USER, 2020-2028 (USD Million)
29 Mexico Digital Agricultural Services Market, By Service, 2020-2028 (USD Million)
30 Mexico Digital Agricultural Services Market, By Service Tools, 2020-2028 (USD Million)
31 Mexico Digital Agricultural Services Market, By Application, 2020-2028 (USD Million)
32 mexico Digital Agricultural Services Market, By END USER, 2020-2028 (USD Million)
33 Europe Digital Agricultural Services Market, By Service, 2020-2028 (USD Million)
34 Europe Digital Agricultural Services Market, By Service Tools, 2020-2028 (USD Million)
35 Europe Digital Agricultural Services Market, By Application, 2020-2028 (USD Million)
36 europe Digital Agricultural Services Market, By END USER, 2020-2028 (USD Million)
37 Germany Digital Agricultural Services Market, By Service, 2020-2028 (USD Million)
38 Germany Digital Agricultural Services Market, By Service Tools, 2020-2028 (USD Million)
39 Germany Digital Agricultural Services Market, By Application, 2020-2028 (USD Million)
40 germany Digital Agricultural Services Market, By END USER, 2020-2028 (USD Million)
41 UK Digital Agricultural Services Market, By Service, 2020-2028 (USD Million)
42 UK Digital Agricultural Services Market, By Service Tools, 2020-2028 (USD Million)
43 UK Digital Agricultural Services Market, By Application, 2020-2028 (USD Million)
44 U.kDigital Agricultural Services Market, By END USER, 2020-2028 (USD Million)
45 France Digital Agricultural Services Market, By Service, 2020-2028 (USD Million)
46 France Digital Agricultural Services Market, By Service Tools, 2020-2028 (USD Million)
47 France Digital Agricultural Services Market, By Application, 2020-2028 (USD Million)
48 france Digital Agricultural Services Market, By END USER, 2020-2028 (USD Million)
49 Italy Digital Agricultural Services Market, By Service, 2020-2028 (USD Million)
50 Italy Digital Agricultural Services Market, By Service Tools Type, 2020-2028 (USD Million)
51 Italy Digital Agricultural Services Market, By Application, 2020-2028 (USD Million)
52 italy Digital Agricultural Services Market, By END USER, 2020-2028 (USD Million)
53 Spain Digital Agricultural Services Market, By Service, 2020-2028 (USD Million)
54 Spain Digital Agricultural Services Market, By Service Tools, 2020-2028 (USD Million)
55 Spain Digital Agricultural Services Market, By Application, 2020-2028 (USD Million)
56 spain Digital Agricultural Services Market, By END USER, 2020-2028 (USD Million)
57 Rest Of Europe Digital Agricultural Services Market, By Service, 2020-2028 (USD Million)
58 Rest Of Europe Digital Agricultural Services Market, By Service Tools, 2020-2028 (USD Million)
59 Rest of Europe Digital Agricultural Services Market, By Application, 2020-2028 (USD Million)
60 REST OF EUROPE Digital Agricultural Services Market, By END USER, 2020-2028 (USD Million)
61 Asia Pacific Digital Agricultural Services Market, By Service, 2020-2028 (USD Million)
62 Asia Pacific Digital Agricultural Services Market, By Service Tools, 2020-2028 (USD Million)
63 Asia Pacific Digital Agricultural Services Market, By Application, 2020-2028 (USD Million)
64 asia Digital Agricultural Services Market, By END USER, 2020-2028 (USD Million)
65 Asia Pacific Digital Agricultural Services Market, By Country, 2020-2028 (USD Million)
66 China Digital Agricultural Services Market, By Service, 2020-2028 (USD Million)
67 China Digital Agricultural Services Market, By Service Tools, 2020-2028 (USD Million)
68 China Digital Agricultural Services Market, By Application, 2020-2028 (USD Million)
69 china Digital Agricultural Services Market, By END USER, 2020-2028 (USD Million)
70 India Digital Agricultural Services Market, By Service, 2020-2028 (USD Million)
71 India Digital Agricultural Services Market, By Service Tools, 2020-2028 (USD Million)
72 India Digital Agricultural Services Market, By Application, 2020-2028 (USD Million)
73 india Digital Agricultural Services Market, By END USER, 2020-2028 (USD Million)
74 Japan Digital Agricultural Services Market, By Service, 2020-2028 (USD Million)
75 Japan Digital Agricultural Services Market, By Service Tools, 2020-2028 (USD Million)
76 Japan Digital Agricultural Services Market, By Application, 2020-2028 (USD Million)
77 japan Digital Agricultural Services Market, By END USER, 2020-2028 (USD Million)
78 South Korea Digital Agricultural Services Market, By Service, 2020-2028 (USD Million)
79 South Korea Digital Agricultural Services Market, By Service Tools, 2020-2028 (USD Million)
80 South Korea Digital Agricultural Services Market, By Application, 2020-2028 (USD Million)
81 south korea Digital Agricultural Services Market, By END USER, 2020-2028 (USD Million)
82 Middle East & Africa Digital Agricultural Services Market, By Service, 2020-2028 (USD Million)
83 Middle East & Africa Digital Agricultural Services Market, By Service Tools, 2020-2028 (USD Million)
84 Middle East & Africa Digital Agricultural Services Market, By Application, 2020-2028 (USD Million)
85 MIDDLE EAST & AFRICA Digital Agricultural Services Market, By END USER, 2020-2028 (USD Million)
86 Middle East & Africa Digital Agricultural Services Market, By Country, 2020-2028 (USD Million)
87 Saudi Arabia Digital Agricultural Services Market, By Service, 2020-2028 (USD Million)
88 Saudi Arabia Digital Agricultural Services Market, By Service Tools, 2020-2028 (USD Million)
89 Saudi Arabia Digital Agricultural Services Market, By Application, 2020-2028 (USD Million)
90 saudi arabia Digital Agricultural Services Market, By END USER, 2020-2028 (USD Million)
91 UAE Digital Agricultural Services Market, By Service, 2020-2028 (USD Million)
92 UAE Digital Agricultural Services Market, By Service Tools, 2020-2028 (USD Million)
93 UAE Digital Agricultural Services Market, By Application, 2020-2028 (USD Million)
94 uae Digital Agricultural Services Market, By END USER, 2020-2028 (USD Million)
95 Central & South America Digital Agricultural Services Market, By Service, 2020-2028 (USD Million)
96 Central & South America Digital Agricultural Services Market, By Service Tools, 2020-2028 (USD Million)
97 Central & South America Digital Agricultural Services Market, By Application, 2020-2028 (USD Million)
98 CENTRAL & SOUTH AMERICA Digital Agricultural Services Market, By END USER, 2020-2028 (USD Million)
99 Central & South America Digital Agricultural Services Market, By Country, 2020-2028 (USD Million)
100 Brazil Digital Agricultural Services Market, By Service, 2020-2028 (USD Million)
101 Brazil Digital Agricultural Services Market, By Service Tools, 2020-2028 (USD Million)
102 Brazil Digital Agricultural Services Market, By Application, 2020-2028 (USD Million)
103 brazil Digital Agricultural Services Market, By END USER, 2020-2028 (USD Million)
104 Deere & Company: Products & Services Offering
105 Bayer AG: Products & Services Offering
106 Syngenta Group: Products & Services Offering
107 BASF SE: Products & Services Offering
108 Aegis Softtech: Products & Services Offering
109 CNH Industrial N.V.: Products & Services Offering
110 AGCO Corporation: Products & Services Offering
111 CropX inc.: Products & Services Offering
112 Cisco Systems Inc.: Products & Services Offering
113 Hummingbird Technologies Limited: Products & Services Offering
114 Other Companies: Products & Services Offering
LIST OF FIGURES
1 Global Digital Agricultural Services Market Overview
2 Global Digital Agricultural Services Market Value From 2020-2028 (USD Mllion)
3 Global Digital Agricultural Services Market Share, By Service (2022)
4 Global Digital Agricultural Services Market Share, By Service Tools (2022)
5 Global Digital Agricultural Services Market Share, By Application (2022)
6 Global Digital Agricultural Services Market, By Region (Asia Pacific Market)
7 Technological Trends In Global Digital Agricultural Services Market
8 Four Quadrant Competitor Positioning Matrix
9 Impact Of Macro & Micro Indicators On The Market
10 Impact Of Key Drivers On The Global Digital Agricultural Services Market
11 Impact Of Challenges On The Global Digital Agricultural Services Market
12 Porter’s Five Forces Analysis
13 Global Digital Agricultural Services Market: By Service Scope Key Takeaways
14 Global Digital Agricultural Services Market, By Service Segment: Revenue Growth Analysis
15 Digital Advisory Market, By Region, 2020-2028 (USD Mllion)
16 Digital Procurement Market, By Region, 2020-2028 (USD Mllion)
17 Agri e-commerce Market, By Region, 2020-2028 (USD Mllion)
18 Agri digital financial service Market, By Region, 2020-2028 (USD Mllion)
19 Smart farming Market, By Region, 2020-2028 (USD Mllion)
20 Global Digital Agricultural Services Market: By Service Tools Scope Key Takeaways
21 Global Digital Agricultural Services Market, By Service Tools Segment: Revenue Growth Analysis
22 Mobile Technologies Market, By Region, 2020-2028 (USD Mllion)
23 Artificial intelligence Market, By Region, 2020-2028 (USD Mllion)
24 Remote-Sensing Tools Market, By Region, 2020-2028 (USD Mllion)
25 Others Market, By Region, 2020-2028 (USD Mllion)
26 Global Digital Agricultural Services Market: By Application Scope Key Takeaways
27 Global Digital Agricultural Services Market, By Application Segment: Revenue Growth Analysis
28 Urban Market, By Region, 2020-2028 (USD Mllion)
29 Rural Market, By Region, 2020-2028 (USD Mllion)
30 Regional Segment: Revenue Growth Analysis
31 Global Digital Agricultural Services Market: Regional Analysis
32 North America Digital Agricultural Services Market Overview
33 North America Digital Agricultural Services Market, By Service
34 North America Digital Agricultural Services Market, By Service Tools
35 North America Digital Agricultural Services Market, By Application
36 North America Digital Agricultural Services Market, By Country
37 U.S. Digital Agricultural Services Market, By Service
38 U.S. Digital Agricultural Services Market, By Service Tools
39 U.S. Digital Agricultural Services Market, By Application
40 Canada Digital Agricultural Services Market, By Service
41 Canada Digital Agricultural Services Market, By Service Tools
42 Canada Digital Agricultural Services Market, By Application
43 Mexico Digital Agricultural Services Market, By Service
44 Mexico Digital Agricultural Services Market, By Service Tools
45 Mexico Digital Agricultural Services Market, By Application
46 Four Quadrant Positioning Matrix
47 Company Market Share Analysis
48 Deere & Company: Company Snapshot
49 Deere & Company: SWOT Analysis
50 Deere & Company: Geographic Presence
51 Bayer AG: Company Snapshot
52 Bayer AG: SWOT Analysis
53 Bayer AG: Geographic Presence
54 Syngenta Group: Company Snapshot
55 Syngenta Group: SWOT Analysis
56 Syngenta Group: Geographic Presence
57 BASF SE: Company Snapshot
58 BASF SE: Swot Analysis
59 BASF SE: Geographic Presence
60 Aegis Softtech: Company Snapshot
61 Aegis Softtech: SWOT Analysis
62 Aegis Softtech: Geographic Presence
63 CNH INDUSTRIAL N.V.: Company Snapshot
64 CNH INDUSTRIAL N.V.: SWOT Analysis
65 CNH INDUSTRIAL N.V.: Geographic Presence
66 AGCO Corporation : Company Snapshot
67 AGCO Corporation : SWOT Analysis
68 AGCO Corporation : Geographic Presence
69 CropX inc.: Company Snapshot
70 CropX inc.: SWOT Analysis
71 CropX inc.: Geographic Presence
72 Cisco Systems Inc.: Company Snapshot
73 Cisco Systems Inc.: SWOT Analysis
74 Cisco Systems Inc.: Geographic Presence
75 Hummingbird Technologies Limited: Company Snapshot
76 Hummingbird Technologies Limited: SWOT Analysis
77 Hummingbird Technologies Limited: Geographic Presence
78 Other Companies: Company Snapshot
79 Other Companies: SWOT Analysis
80 Other Companies: Geographic Presence
The Global Digital Agricultural Services Market has been studied from the year 2019 till 2028. However, the CAGR provided in the report is from the year 2023 to 2028. The research methodology involved three stages: Desk research, Primary research, and Analysis & Output from the entire research process.

The desk research involved a robust background study which meant referring to paid and unpaid databases to understand the market dynamics; mapping contracts from press releases; identifying the key players in the market, studying their product portfolio, competition level, annual reports/SEC filings & investor presentations; and learning the demand and supply-side analysis for the Digital Agricultural Services Market.

The primary research activity included telephonic conversations with more than 50 tier 1 industry consultants, distributors, and end-use product manufacturers.

Finally, based on the above thorough research process, an in-depth analysis was carried out considering the following aspects: market attractiveness, current & future market trends, market share analysis, SWOT analysis of the company and customer analytics.

Frequently Asked Questions

This FREE sample includes market data points, ranging from trend analyses to market estimates & forecasts. See for yourself.
Or view our licence options:
Tailor made solutions just for you
80% of our clients seek made-to-order reports. How do you want us to tailor yours?
OUR CLIENTS


