This report was recently updated on August 14 2025 with the latest and most recent
market numbers
Global Digital Braille Displays Market Size, Trends & Analysis - Forecasts to 2027 By Age Group (Adults, Children, and Geriatrics), By Connectivity (Bluetooth Connection, Wi-Fi Connection, and USB Connection), By Cell Range (10 to 20 Cell Range, 20 to 30 Cell Range, and Above 40 Cell Range), By Region (North America, Asia Pacific, CSA, Europe, and the Middle East and Africa), Competitive Landscape, Company Market Share Analysis, and Competitor Analysis
The global digital braille displays market is projected to grow at a CAGR value of 20.5% from 2022 to 2027. Braille displays are becoming increasingly popular in recent years, these devices can be easily attached to electronic devices with displays to allow blind people to easily read the information on the display and control the device. The growing number of people suffering from blindness either complete or partial is a major driver of the market. The growing perforation of electronic devices and technology in everyday life is another factor that is expected to further enhance the demand for braille displays during the forecast period.
Increasing awareness of the challenges faced by people with disabilities and the growing demand for the provision of equal opportunities to all is expected to only increase the demand for these displays.
The CDC estimates that there are over a million people who are legally blind in the United States alone. The center also estimates that there are at least 93 million adults in the United States are at risk of serious vision loss.
The growing number of vision impaired people opting for higher education and the growing investment in improving their access to education by governments and universities are expected to increase the demand for braille displays. Traditionally, braille is largely read-through raises or bumps on sheets of paper which necessitates the need for physical printouts of the information. This is highly space-consuming and largely inefficient in the current era. For instance, a hard copy of the World Book Encyclopaedia in braille would take up an entire wall of a library. The same book in digital format can be fit into a memory card that can fit inside a pocket. Braille displays consist of rows or cells of surfaces that can continuously represent information displayed on a screen through braille. This allows visually impaired people to read displays and control the device more easily and without assistance.
The American Printing House for the Blind reports a total of 63,357 blind students who requested free reading material in braille, large print, or audio format. The growing number of students with visual impairments who are attaining education degrees is increasing the demand for braille displays. The ease of connectivity to conventional electronic devices allows for easy access and reduces the need for assistance. The increased demand for self-reliance among people with disabilities is another factor that is driving the demand for braille displays.
The market’s growth is restrained by the availability of alternate devices such as audible screen readers and text-to-voice and voice-to-text functionalities in electronic devices. The high cost of braille displays is another factor restraining the growth of the market.
The COVID-19 pandemic has caused various supply chain restrictions, fluctuations in prices of raw materials, increased costs of transportation, and other impacts that have impacted the manufacturing of new devices. The pandemic has also increased the adoption of cloud services and other technologies as people begin working from remote locations which necessitates the need for electronic displays. The market for braille displays is expected to grow and bounce back from the initial shocks of the pandemic during the forecast period.
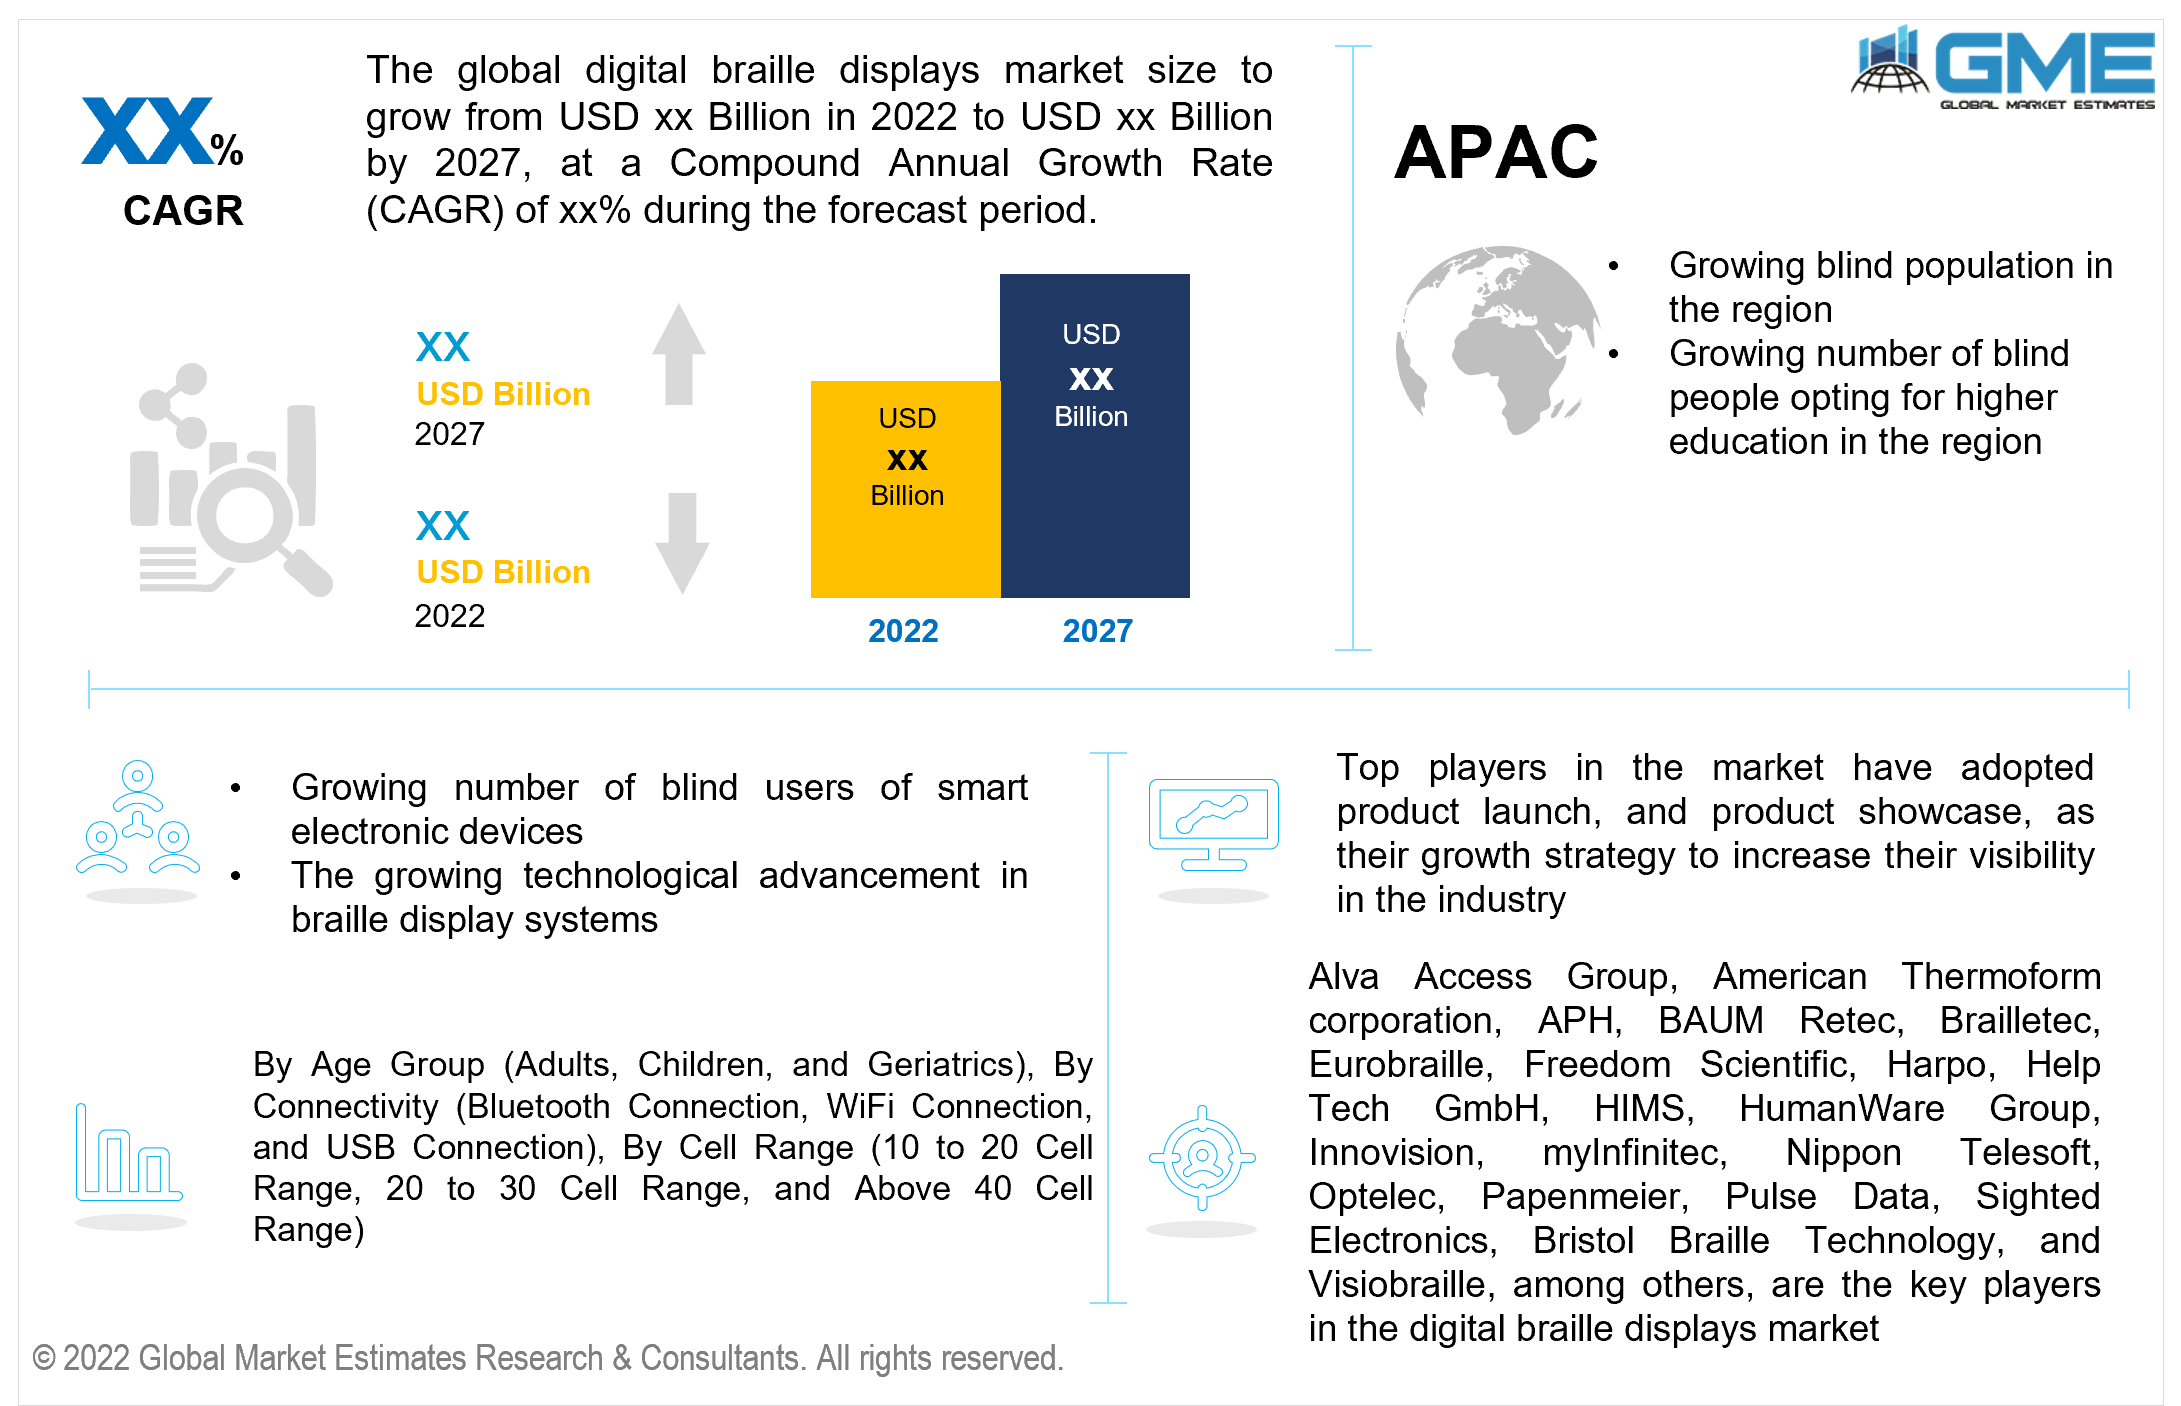
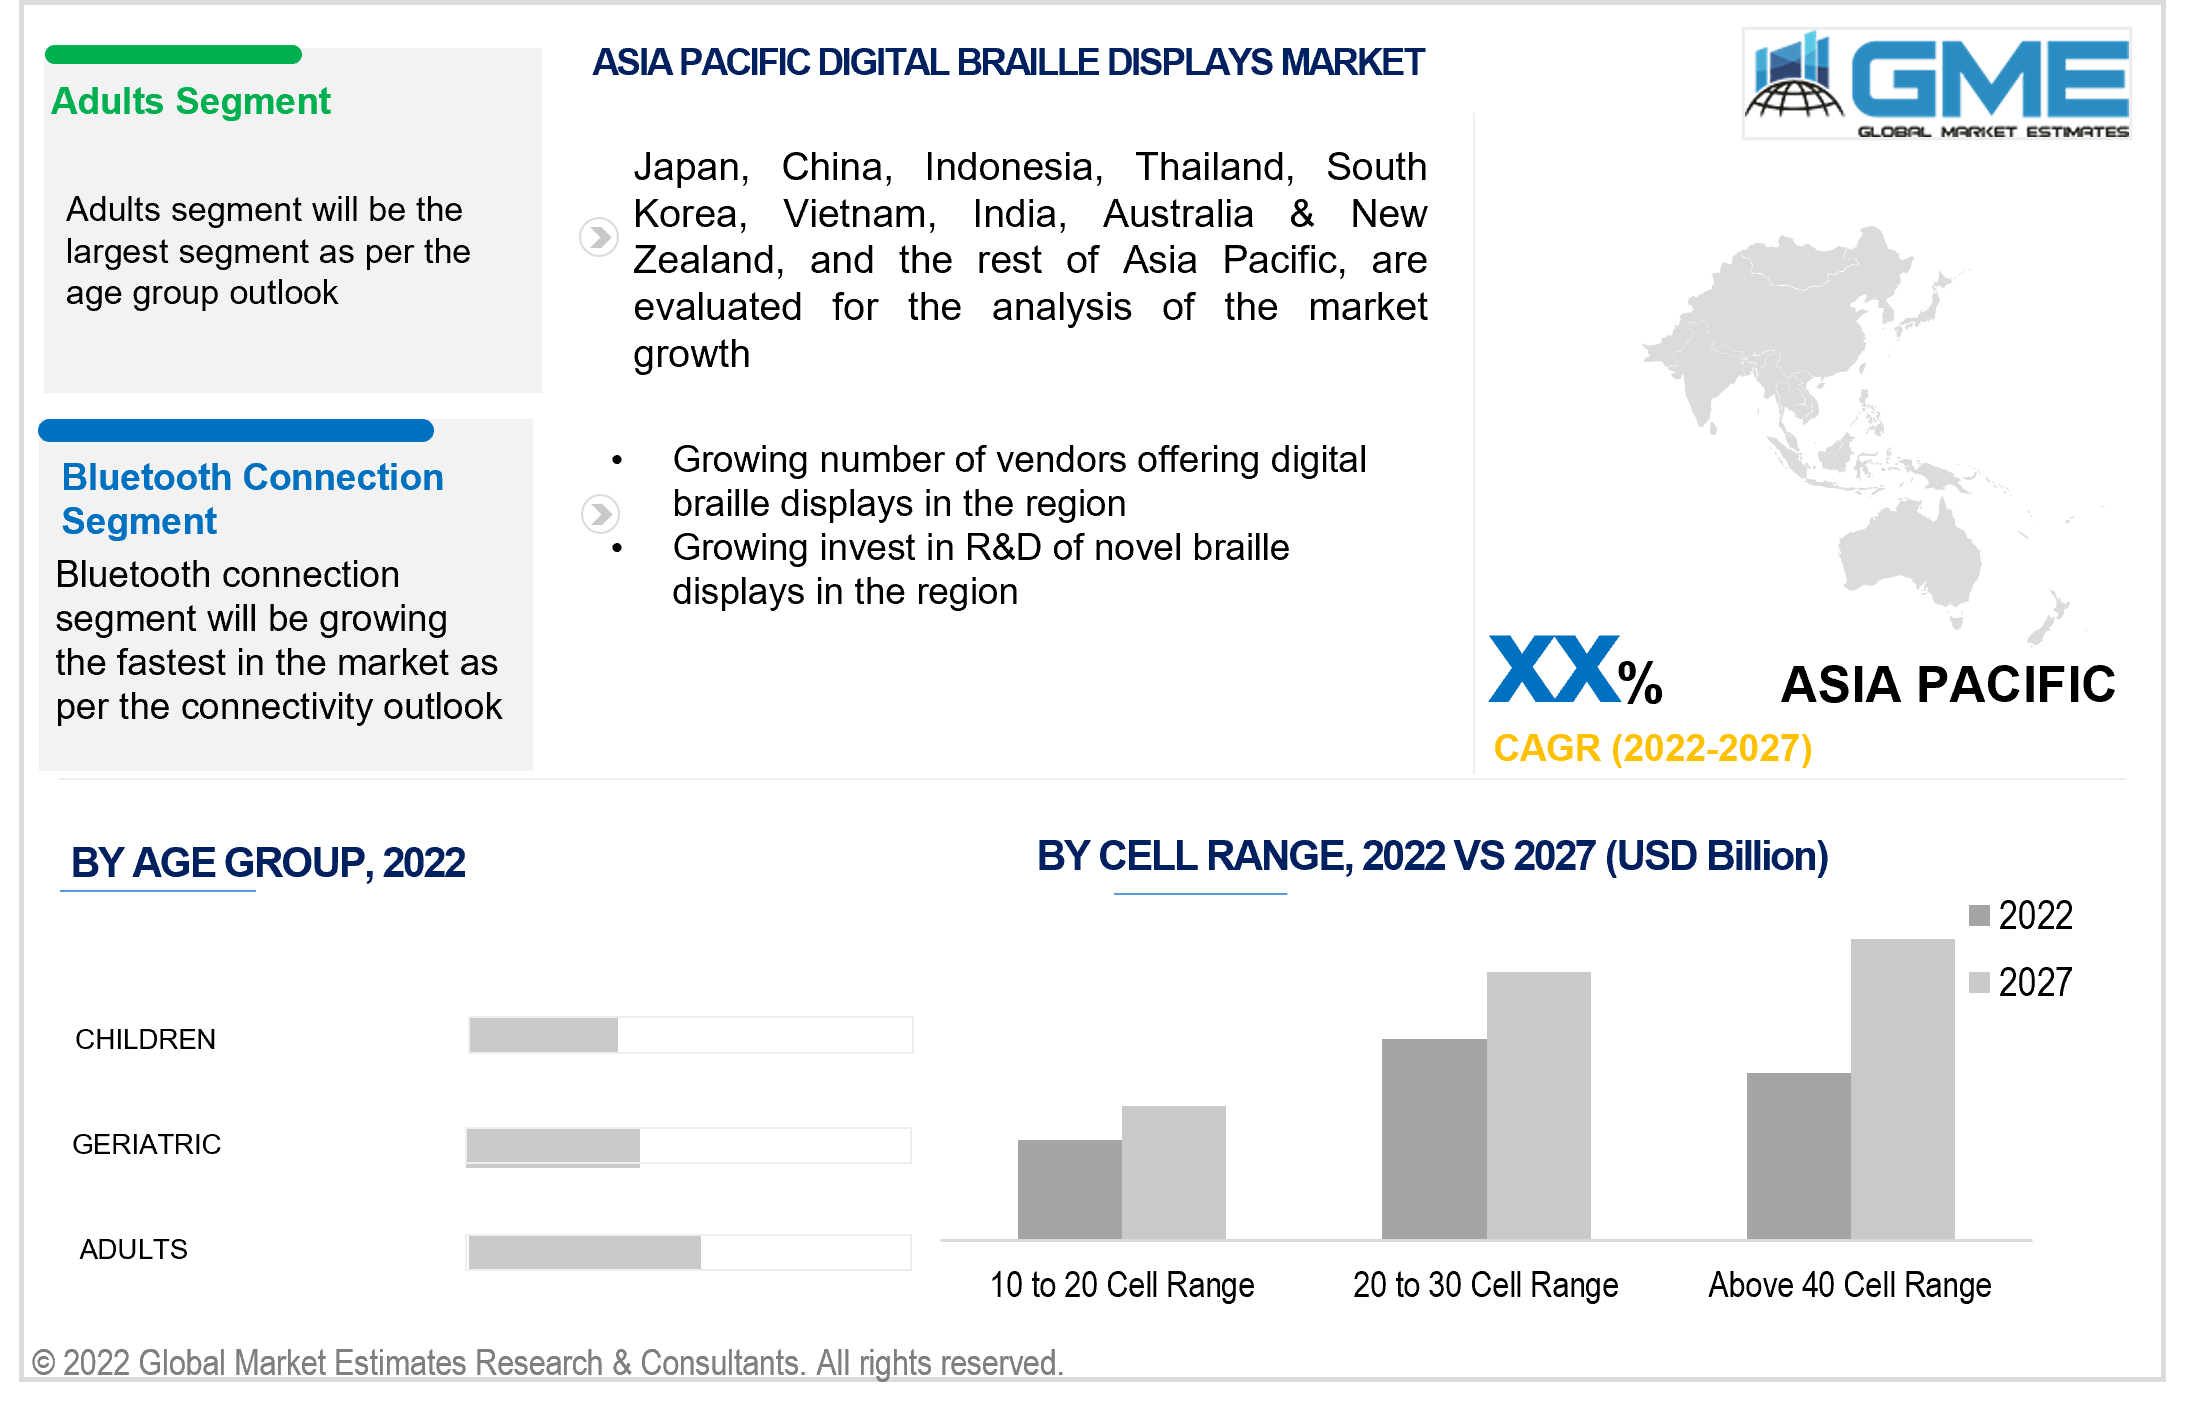
Based on the age group, the digital braille displays market is segmented into children, adults, and geriatric segments. The adults segment is expected to hold the largest piece of the market during the forecast period. Growing adoption and demand for electronic devices such as smartphones, laptops, tablets, and e-readers, among other devices have increased the demand for braille readers among adults suffering from blindness. The growing adoption of braille readers to improve accessibility to information among the blind population by governments and public offices has been one of the major drivers of the segment.
Based on the various avenues of connectivity of digital braille displays, the market is segmented into Bluetooth connection, Wi-Fi connection, and USB connection. The USB connection segment held the lion’s share of the market. Most electronic devices that are available in the market are easily accessible through USB ports resulting in most braille displays coming with USB ports and connection options through USB.
The Bluetooth segment is expected to become the fastest-growing segment. The growing number of devices that offer Bluetooth connection, advancements in Bluetooth connectivity, and ease of access using Bluetooth are expected to result in the rapid growth of the Bluetooth connection segment.
Based on the various cell ranges, the market is segmented into 10 to 20 cell range, 20 to 30 cell range, and above 40 cell range. The 10 to 20 cell range segment held the lion’s share of the market. The growing demand for portable braille displays has resulted in the dominance of the 10 to 20 cell range segment and is expected to continue to do so during the forecast period.
Based on region, the market can be segmented into various regions such as North America, Europe, Central and South America, Middle East and North Africa, and Asia Pacific regions. The North American region is expected to be the dominant force in the market during the forecast period. The region’s increased spending on public infrastructure and the increased support for its disabled population has resulted in the dominance of the region. The growing number of blind people opting for higher education and a large number of digital braille display vendors in North America have resulted in larger sales revenue from the region.
The APAC region is envisaged to log significantly greater growth rates than the other regions during the forecast period. The growing number of people suffering from blindness and the increasing initiatives and awareness programs to support the blind population in the region by governments are expected to contribute to the rapid growth of the market in the region.
Alva Access Group, American Thermoform Corporation, APH, BAUM Retec, Brailletec, Eurobraille, Freedom Scientific, Harpo, Help Tech GmbH, HIMS, HumanWare Group, Innovision, myInfinitec, Nippon Telesoft, Optelec, Papenmeier, Pulse Data, Sighted Electronics, Bristol Braille Technology, and Visiobraille, among others are the key players in the digital braille displays market.
Please note: This is not an exhaustive list of companies profiled in the report.
Chapter 1 Methodology
1.1 Market Scope & Definitions
1.2 Estimates & Forecast Calculation
1.3 Historical Data Overview and Validation
1.4 Data Sources
1.4.1 Secondary
1.4.2 Primary
Chapter 2 Report Outlook
2.1 Digital Braille Displays Industry Overview, 2021-2027
2.1.1 Industry Overview
2.1.2 Age Group Overview
2.1.3 Connectivity Overview
2.1.4 Cell Range Overview
2.1.6 Regional Overview
Chapter 3 Digital Braille Displays Market Trends
3.1 Market Segmentation
3.2 Industry Background, 2021-2027
3.3 Market Key Trends
3.3.1 Positive Trends
3.3.1.1 Rising prevalence of blindness
3.3.2 Industry Challenges
3.3.2.1 Availability of alternated devices and high cost of braille displays
3.4 Prospective Growth Scenario
3.4.1 Age Group Growth Scenario
3.4.2 Connectivity Growth Scenario
3.4.3 Cell Range Growth Scenario
3.5 COVID-19 Influence over Industry Growth
3.6 Porter’s Analysis
3.7 PESTEL Analysis
3.8 Value Chain & Supply Chain Analysis
3.9 Regulatory Framework
3.9.1 North America
3.9.2 Europe
3.9.3 APAC
3.9.4 LATAM
3.9.5 MEA
3.10 Cell Range Overview
3.11 Market Share Analysis, 2021
3.11.1 Company Positioning Overview, 2021
Chapter 4 Digital Braille Displays Market, By Age Group
4.1 Age Group Outlook
4.2 Adults
4.2.1 Market Size, By Region, 2021-2027 (USD Million)
4.3 Children
4.3.1 Market Size, By Region, 2021-2027 (USD Million)
4.4 Geriatrics
4.4.1 Market Size, By Region, 2021-2027 (USD Million)
Chapter 5 Digital Braille Displays Market, By Connectivity
5.1 Connectivity Outlook
5.2 Bluetooth Connection
5.2.1 Market Size, By Region, 2021-2027 (USD Million)
5.3 WiFi Connection
5.3.1 Market Size, By Region, 2021-2027 (USD Million)
5.4 USB Connection
5.4.1 Market Size, By Region, 2021-2027 (USD Million)
Chapter 6 Digital Braille Displays Market, By Cell Range
6.1 10 to 20 Cell Range
6.1.1 Market Size, By Region, 2021-2027 (USD Million)
6.2 20 to 30 Cell Range
6.2.1 Market Size, By Region, 2021-2027 (USD Million)
6.3 Above 40 Cell Range
6.3.1 Market Size, By Region, 2021-2027 (USD Million)
Chapter 7 Digital Braille Displays Market, By Region
7.1 Regional outlook
7.2 North America
7.2.1 Market Size, By Country 2021-2027 (USD Million)
7.2.2 Market Size, By Age Group, 2021-2027 (USD Million)
7.2.3 Market Size, By Connectivity, 2021-2027 (USD Million)
7.2.4 Market Size, By Cell Range, 2021-2027 (USD Million)
7.2.5 U.S.
7.2.5.1 Market Size, By Age Group, 2021-2027 (USD Million)
7.2.5.2 Market Size, By Connectivity, 2021-2027 (USD Million)
7.2.5.3 Market Size, By Cell Range, 2021-2027 (USD Million)
7.2.6 Canada
7.2.6.1 Market Size, By Age Group, 2021-2027 (USD Million)
7.2.6.2 Market Size, By Connectivity, 2021-2027 (USD Million)
7.2.6.3 Market Size, By Cell Range, 2021-2027 (USD Million)
7.3 Europe
7.3.1 Market Size, By Country 2021-2027 (USD Million)
7.3.2 Market Size, By Age Group, 2021-2027 (USD Million)
7.3.3 Market Size, By Connectivity, 2021-2027 (USD Million)
7.3.4 Market Size, By Cell Range, 2021-2027 (USD Million)
7.3.6 Germany
7.3.6.1 Market Size, By Age Group, 2021-2027 (USD Million)
7.3.6.2 Market Size, By Connectivity, 2021-2027 (USD Million)
7.3.6.3 Market Size, By Cell Range, 2021-2027 (USD Million)
7.3.7 UK
7.3.7.1 Market Size, By Age Group, 2021-2027 (USD Million)
7.3.7.2 Market Size, By Connectivity, 2021-2027 (USD Million)
7.3.7.3 Market Size, By Cell Range, 2021-2027 (USD Million)
7.3.8 France
7.3.7.1 Market Size, By Age Group, 2021-2027 (USD Million)
7.3.7.2 Market Size, By Connectivity, 2021-2027 (USD Million)
7.3.7.3 Market Size, By Cell Range, 2021-2027 (USD Million)
7.3.9 Italy
7.3.9.1 Market Size, By Age Group, 2021-2027 (USD Million)
7.3.9.2 Market Size, By Connectivity, 2021-2027 (USD Million)
7.3.9.3 Market Size, By Cell Range, 2021-2027 (USD Million)
7.3.10 Spain
7.3.10.1 Market Size, By Age Group, 2021-2027 (USD Million)
7.3.10.2 Market Size, By Connectivity, 2021-2027 (USD Million)
7.3.10.3 Market Size, By Cell Range, 2021-2027 (USD Million)
7.3.11 Russia
7.3.11.1 Market Size, By Age Group, 2021-2027 (USD Million)
7.3.11.2 Market Size, By Connectivity, 2021-2027 (USD Million)
7.3.11.3 Market Size, By Cell Range, 2021-2027 (USD Million)
7.4 Asia Pacific
7.4.1 Market Size, By Country 2021-2027 (USD Million)
7.4.2 Market Size, By Age Group, 2021-2027 (USD Million)
7.4.3 Market Size, By Connectivity, 2021-2027 (USD Million)
7.4.4 Market Size, By Cell Range, 2021-2027 (USD Million)
7.4.6 China
7.4.6.1 Market Size, By Age Group, 2021-2027 (USD Million)
7.4.6.2 Market Size, By Connectivity, 2021-2027 (USD Million)
7.4.6.3 Market Size, By Cell Range, 2021-2027 (USD Million)
7.4.7 India
7.4.7.1 Market Size, By Age Group, 2021-2027 (USD Million)
7.4.7.2 Market Size, By Connectivity, 2021-2027 (USD Million)
7.4.7.3 Market Size, By Cell Range, 2021-2027 (USD Million)
7.4.8 Japan
7.4.7.1 Market Size, By Age Group, 2021-2027 (USD Million)
7.4.7.2 Market Size, By Connectivity, 2021-2027 (USD Million)
7.4.7.3 Market Size, By Cell Range, 2021-2027 (USD Million)
7.4.9 Australia
7.4.9.1 Market Size, By Age Group, 2021-2027 (USD Million)
7.4.9.2 Market size, By Connectivity, 2021-2027 (USD Million)
7.4.9.3 Market Size, By Cell Range, 2021-2027 (USD Million)
7.4.10 South Korea
7.4.10.1 Market Size, By Age Group, 2021-2027 (USD Million)
7.4.10.2 Market Size, By Connectivity, 2021-2027 (USD Million)
7.4.10.3 Market Size, By Cell Range, 2021-2027 (USD Million)
7.5 Latin America
7.5.1 Market Size, By Country 2021-2027 (USD Million)
7.5.2 Market Size, By Age Group, 2021-2027 (USD Million)
7.5.3 Market Size, By Connectivity, 2021-2027 (USD Million)
7.5.4 Market Size, By Cell Range, 2021-2027 (USD Million)
7.5.6 Brazil
7.5.6.1 Market Size, By Age Group, 2021-2027 (USD Million)
7.5.6.2 Market Size, By Connectivity, 2021-2027 (USD Million)
7.5.6.3 Market Size, By Cell Range, 2021-2027 (USD Million)
7.5.7 Mexico
7.5.7.1 Market Size, By Age Group, 2021-2027 (USD Million)
7.5.7.2 Market Size, By Connectivity, 2021-2027 (USD Million)
7.5.7.3 Market Size, By Cell Range, 2021-2027 (USD Million)
7.5.8 Argentina
7.5.7.1 Market Size, By Age Group, 2021-2027 (USD Million)
7.5.7.2 Market Size, By Connectivity, 2021-2027 (USD Million)
7.5.7.3 Market Size, By Cell Range, 2021-2027 (USD Million)
7.6 MEA
7.6.1 Market Size, By Country 2021-2027 (USD Million)
7.6.2 Market Size, By Age Group, 2021-2027 (USD Million)
7.6.3 Market Size, By Connectivity, 2021-2027 (USD Million)
7.6.4 Market Size, By Cell Range, 2021-2027 (USD Million)
7.6.6 Saudi Arabia
7.6.6.1 Market Size, By Age Group, 2021-2027 (USD Million)
7.6.6.2 Market Size, By Connectivity, 2021-2027 (USD Million)
7.6.6.3 Market Size, By Cell Range, 2021-2027 (USD Million)
7.6.7 UAE
7.6.7.1 Market Size, By Age Group, 2021-2027 (USD Million)
7.6.7.2 Market Size, By Connectivity, 2021-2027 (USD Million)
7.6.7.3 Market Size, By Cell Range, 2021-2027 (USD Million)
7.6.8 South Africa
7.6.7.1 Market Size, By Age Group, 2021-2027 (USD Million)
7.6.7.2 Market Size, By Connectivity, 2021-2027 (USD Million)
7.6.7.3 Market Size, By Cell Range, 2021-2027 (USD Million)
Chapter 8 Company Landscape
8.1 Competitive Analysis, 2021
8.2 Alva Access Group
8.2.1 Company Overview
8.2.2 Financial Analysis
8.2.3 Strategic Positioning
8.2.4 Info Graphic Analysis
8.3 American Thermoform corporation
8.3.1 Company Overview
8.3.2 Financial Analysis
8.3.3 Strategic Positioning
8.3.4 Info Graphic Analysis
8.4 APH
8.4.1 Company Overview
8.4.2 Financial Analysis
8.4.3 Strategic Positioning
8.4.4 Info Graphic Analysis
8.5 BAUM Retec
8.5.1 Company Overview
8.5.2 Financial Analysis
8.5.3 Strategic Positioning
8.5.4 Info Graphic Analysis
8.6 Brailletec
8.6.1 Company Overview
8.6.2 Financial Analysis
8.6.3 Strategic Positioning
8.6.4 Info Graphic Analysis
8.7 Eurobraille
8.7.1 Company Overview
8.7.2 Financial Analysis
8.7.3 Strategic Positioning
8.7.4 Info Graphic Analysis
8.8 Freedom Scientific
8.8.1 Company Overview
8.8.2 Financial Analysis
8.8.3 Strategic Positioning
8.8.4 Info Graphic Analysis
8.9 Harpo
8.8.1 Company Overview
8.8.2 Financial Analysis
8.8.3 Strategic Positioning
8.8.4 Info Graphic Analysis
8.10 Help Tech GmbH
8.10.1 Company Overview
8.10.2 Financial Analysis
8.10.3 Strategic Positioning
8.10.4 Info Graphic Analysis
8.11 Other Companies
8.11.1 Company Overview
8.11.2 Financial Analysis
8.11.3 Strategic Positioning
8.11.4 Info Graphic Analysis
The Global Digital Braille Displays Market has been studied from the year 2019 till 2027. However, the CAGR provided in the report is from the year 2022 to 2027. The research methodology involved three stages: Desk research, Primary research, and Analysis & Output from the entire research process.

The desk research involved a robust background study which meant referring to paid and unpaid databases to understand the market dynamics; mapping contracts from press releases; identifying the key players in the market, studying their product portfolio, competition level, annual reports/SEC filings & investor presentations; and learning the demand and supply-side analysis for the Digital Braille Displays Market.

The primary research activity included telephonic conversations with more than 50 tier 1 industry consultants, distributors, and end-use product manufacturers.

Finally, based on the above thorough research process, an in-depth analysis was carried out considering the following aspects: market attractiveness, current & future market trends, market share analysis, SWOT analysis of the company and customer analytics.

Frequently Asked Questions

This FREE sample includes market data points, ranging from trend analyses to market estimates & forecasts. See for yourself.
Or view our licence options:
Tailor made solutions just for you
80% of our clients seek made-to-order reports. How do you want us to tailor yours?
OUR CLIENTS


