This report was recently updated on August 14 2025 with the latest and most recent
market numbers
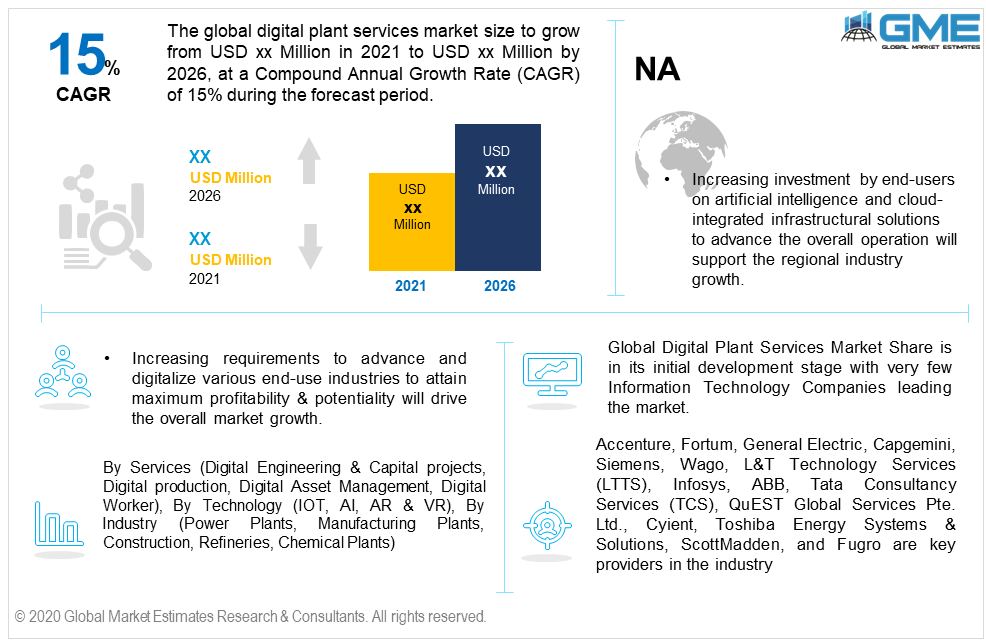
Global Digital Plant Services Market Size, Trends & Analysis - Forecasts to 2026 By Services (Digital Engineering & Capital projects, Digital production, Digital Asset Management, Digital Worker), By Technology (IOT, AI, AR & VR), By Industry (Power Plants, Manufacturing Plants, Construction, Refineries, Chemical Plants), By Region (North America, Asia Pacific, Europe, Latin America, Middle East & Africa); End-User Landscape, Company Market Share Analysis, and Competitor Analysis
The global digital plant services market size will witness more than 15% CAGR from 2021 to 2026, with the Asia Pacific observing the highest gains. Increasing requirements to advance and digitalize various end-use industries to attain maximum profitability & potentiality will drive the overall market growth. The industry is also witnessing positive responsiveness from the construction and refineries sector. In these industries, the prime emphasis is towards improved synergy between software and machinery, upgraded efficiencies, and cost maintenance. These massive technological advancements help in maintaining the track of automation, data analysis, and asset management to digitally transform the working site.
Digital engineering & capital projects, digital production, digital asset management, and digital worker are the major services offered in the market. Annually, numerous end-use industries and factories spend large amounts of money on automation and integration.
These digitalized solutions provide optimum collaborations of software and machinery which have proven to advance the overall site operation. Energy maintenance, high speed, and improved output are among the major advantages offered by these solutions. Asset management is another major offering solution in the industry. Compatibility with numerous processes and assets are the prime reasons to drive adoption in this segment.
By industry, the market is categorized into power plants, manufacturing plants, construction, refineries, chemical plants among others. The power plants sector dominated the overall industry segment and accounted for around 30% of the demand in 2019. The rising need to digitalize large-scale factories to optimize their overall functionality and operation is the major factor influencing demand in this segment. The rising dependence on the network integrated infrastructure and demand for better internal assessment & connectivity will proliferate the industry growth.
Robotic Process Automation is taking place at a rapid pace in various end-use industries, which makes the industry more lucrative in nature. Other major segments to observe high gains are the construction and refineries. The increasing need to operate assets at a high speed with intelligence to focus on better management and output will drive the adoption in these segments.
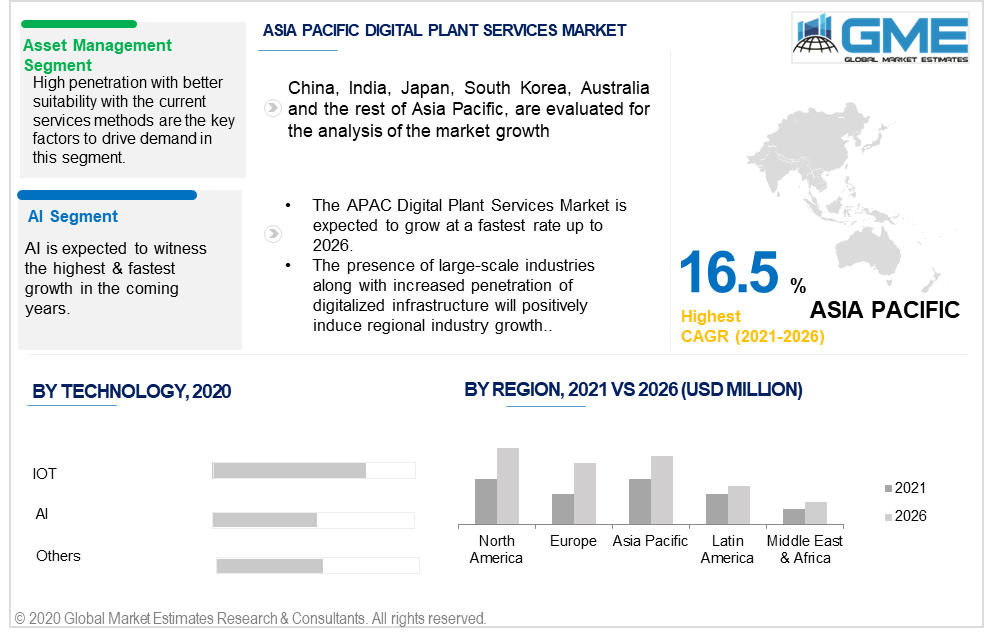
By technology, the industry is divided into AI, IoT, AR & VR, among others. IOT dominated the global technology segment demand in 2019 and is expected to hold its dominance during the forecast period. Increased penetration and implementation of interacting solutions accompanied by improved aptness with the existing site are major attributing factors to drive demand in this segment. The offering solution is trusted and holds long-term success potential. Thus, making it an optimum solution in various end-use industries.
AI observed notable gains in recent years and is intended to endure this progress in the coming years. Higher suitability, improved functionality, and cost optimization are major success factors to promote growth in this segment.
In 2019, The North American market held the maximum revenue share owing to its early adoption of technology-oriented infrastructural solutions. Increasing investment by end-users on artificial intelligence and cloud-integrated infrastructural solutions to advance the overall operation will support the regional industry growth. The wide presence of key providers accompanied by increased production company's capacity to spend on the latest technology offerings will influence the regional market penetration.
The European market is anticipated to grow at a significant pace during the forecast period. Increased product penetration in various manufacturing and chemical factories to optimize the overall production process and manage the assets properly has induced regional industry growth. Large scale industries such as power, energy, refineries, and constructions have faced heavy loss during the initial phase of the covid-19 pandemic. Thus, these industries are rigorously working to adopt cost optimization methodologies and programs.
The APAC industry will grow at the fastest rate from 2021 to 2026. The presence of large-scale industries along with increased penetration of digitalized infrastructure will positively induce regional industry growth. Countries such as China, Japan, South Korea, and Singapore will be the major supporter and consumers of these advanced solutions.
Accenture, Fortum, General Electric, Capgemini, Siemens, Wago, L&T Technology Services (LTTS), Infosys, ABB, Tata Consultancy Services (TCS), QuEST Global Services Pte. Ltd., Cyient, Toshiba Energy Systems & Solutions, ScottMadden, and Fugro are key providers in the industry.
Please note: This is not an exhaustive list of companies profiled in the report.
Collaboration and acquisition with the tech startup companies to fund novel products and technologies will provide ample prospects in the industry. Market leaders are financing and investing in advanced technologies to improvise the consumer experience.
Chapter 1 Methodology
1.1 Market scope & definitions
1.2 Estimates & forecast calculation
1.3 Historical data overview and validation
1.4 Data sources
1.4.1 Secondary
1.4.2 Primary
Chapter 2 Report Outlook
2.1 Digital Plant Services industry overview, 2019-2026
2.1.1 Industry overview
2.1.2 Services overview
2.1.3 Industry overview
2.1.4 Technology overview
2.1.5 Regional overview
Chapter 3 Digital Plant Services Market Trends
3.1 Market segmentation
3.2 Industry background, 2019-2026
3.3 Market key trends
3.3.1 Positive trends
3.3.2 Industry challenges
3.4 Prospective growth scenario
3.5 COVID-19 influence over industry growth
3.6 Porter’s analysis
3.7 PESTEL analysis
3.8 Value chain & supply chain analysis
3.9 Regulatory framework
3.9.1 North America
3.9.2 Europe
3.9.3 APAC
3.9.4 LATAM
3.9.5 MEA
3.10 Technology overview
3.11 Market share analysis, 2020
3.11.1 Company positioning overview, 2020
Chapter 4 Digital Plant Services Market, By Services
4.1 Services Outlook
4.2 Digital Engineering & Capital projects
4.2.1 Market size, by region, 2019-2026 (USD Million)
4.3 Digital production
4.3.1 Market size, by region, 2019-2026 (USD Million)
4.4 Digital Asset Management
4.4.1 Market size, by region, 2019-2026 (USD Million)
4.5 Digital Worker
4.5.1 Market size, by region, 2019-2026 (USD Million)
4.6 Others
4.6.1 Market size, by region, 2019-2026 (USD Million)
Chapter 5 Digital Plant Services Market, By Technology
5.1 Technology Outlook
5.2 IOT
5.2.1 Market size, by region, 2019-2026 (USD Million)
5.3 AI
5.3.1 Market size, by region, 2019-2026 (USD Million)
5.4 AR & VR
5.4.1 Market size, by region, 2019-2026 (USD Million)
5.5 Others
5.5.1 Market size, by region, 2019-2026 (USD Million)
Chapter 6 Digital Plant Services Market, By Industry
6.1 Industry Outlook
6.2 Power Plants
6.2.1 Market size, by region, 2019-2026 (USD Million)
6.3 Manufacturing Plants
6.3.1 Market size, by region, 2019-2026 (USD Million)
6.4 Construction
6.4.1 Market size, by region, 2019-2026 (USD Million)
6.5 Refineries
6.5.1 Market size, by region, 2019-2026 (USD Million)
6.6 Chemical Plants
6.6.1 Market size, by region, 2019-2026 (USD Million)
6.7 Others
6.7.1 Market size, by region, 2019-2026 (USD Million)
Chapter 7 Digital Plant Services Market, By Region
7.1 Regional outlook
7.2 North America
7.2.1 Market size, by country 2019-2026 (USD Million)
7.2.2 Market size, by services, 2019-2026 (USD Million)
7.2.3 Market size, by industry, 2019-2026 (USD Million)
7.2.4 Market size, by technology, 2019-2026 (USD Million)
7.2.5 U.S.
7.2.5.1 Market size, by services, 2019-2026 (USD Million)
7.2.5.2 Market size, by industry, 2019-2026 (USD Million)
7.2.5.3 Market size, by technology, 2019-2026 (USD Million)
7.2.6 Canada
7.2.6.1 Market size, by services, 2019-2026 (USD Million)
7.2.6.2 Market size, by industry, 2019-2026 (USD Million)
7.2.6.3 Market size, by technology, 2019-2026 (USD Million)
7.3 Europe
7.3.1 Market size, by country 2019-2026 (USD Million)
7.3.2 Market size, by services, 2019-2026 (USD Million)
7.3.3 Market size, by industry, 2019-2026 (USD Million)
7.3.4 Market size, by technology, 2019-2026 (USD Million)
7.3.5 Germany
7.2.5.1 Market size, by services, 2019-2026 (USD Million)
7.2.5.2 Market size, by industry, 2019-2026 (USD Million)
7.2.5.3 Market size, by technology, 2019-2026 (USD Million)
7.3.6 UK
7.3.6.1 Market size, by services, 2019-2026 (USD Million)
7.3.6.2 Market size, by industry, 2019-2026 (USD Million)
7.3.6.3 Market size, by technology, 2019-2026 (USD Million)
7.3.7 France
7.3.7.1 Market size, by services, 2019-2026 (USD Million)
7.3.7.2 Market size, by industry, 2019-2026 (USD Million)
7.3.7.3 Market size, by technology, 2019-2026 (USD Million)
7.3.8 Italy
7.3.8.1 Market size, by services, 2019-2026 (USD Million)
7.3.8.2 Market size, by industry, 2019-2026 (USD Million)
7.3.8.3 Market size, by technology, 2019-2026 (USD Million)
7.4 Asia Pacific
7.4.1 Market size, by country 2019-2026 (USD Million)
7.4.2 Market size, by services, 2019-2026 (USD Million)
7.4.3 Market size, by industry, 2019-2026 (USD Million)
7.4.4 Market size, by technology, 2019-2026 (USD Million)
7.4.5 China
7.4.5.1 Market size, by services, 2019-2026 (USD Million)
7.4.5.2 Market size, by industry, 2019-2026 (USD Million)
7.4.5.3 Market size, by technology, 2019-2026 (USD Million)
7.4.6 India
7.4.6.1 Market size, by services, 2019-2026 (USD Million)
7.4.6.2 Market size, by industry, 2019-2026 (USD Million)
7.4.6.3 Market size, by technology, 2019-2026 (USD Million)
7.4.7 Japan
7.4.7.1 Market size, by services, 2019-2026 (USD Million)
7.4.7.2 Market size, by industry, 2019-2026 (USD Million)
7.4.7.3 Market size, by technology, 2019-2026 (USD Million)
7.4.8 Australia
7.4.8.1 Market size, by services, 2019-2026 (USD Million)
7.4.8.2 Market size, by industry, 2019-2026 (USD Million)
7.4.8.3 Market size, by technology, 2019-2026 (USD Million)
7.4.9 South Korea
7.4.9.1 Market size, by services, 2019-2026 (USD Million)
7.4.9.2 Market size, by industry, 2019-2026 (USD Million)
7.4.9.3 Market size, by technology, 2019-2026 (USD Million)
7.5 Latin America
7.5.1 Market size, by country 2019-2026 (USD Million)
7.5.2 Market size, by services, 2019-2026 (USD Million)
7.5.3 Market size, by industry, 2019-2026 (USD Million)
7.5.4 Market size, by technology, 2019-2026 (USD Million)
7.5.5 Brazil
7.5.5.1 Market size, by services, 2019-2026 (USD Million)
7.5.5.2 Market size, by industry, 2019-2026 (USD Million)
7.5.5.3 Market size, by technology, 2019-2026 (USD Million)
7.5.6 Mexico
7.5.6.1 Market size, by services, 2019-2026 (USD Million)
7.5.6.2 Market size, by industry, 2019-2026 (USD Million)
7.5.6.3 Market size, by technology, 2019-2026 (USD Million)
7.6 MEA
7.6.1 Market size, by country 2019-2026 (USD Million)
7.6.2 Market size, by services, 2019-2026 (USD Million)
7.6.3 Market size, by industry, 2019-2026 (USD Million)
7.6.4 Market size, by technology, 2019-2026 (USD Million)
7.6.5 Saudi Arabia
7.6.5.1 Market size, by services, 2019-2026 (USD Million)
7.6.5.2 Market size, by industry, 2019-2026 (USD Million)
7.6.5.3 Market size, by technology, 2019-2026 (USD Million)
7.6.6 UAE
7.6.6.1 Market size, by services, 2019-2026 (USD Million)
7.6.6.2 Market size, by industry, 2019-2026 (USD Million)
7.6.6.3 Market size, by technology, 2019-2026 (USD Million)
7.6.7 South Africa
7.6.7.1 Market size, by services, 2019-2026 (USD Million)
7.6.7.2 Market size, by industry, 2019-2026 (USD Million)
7.6.7.3 Market size, by technology, 2019-2026 (USD Million)
Chapter 8 Company Landscape
8.1 Competitive analysis, 2020
8.2 Accenture
8.2.1 Company overview
8.2.2 Financial analysis
8.2.3 Strategic positioning
8.2.4 Info graphic analysis
8.3 Fortum
8.3.1 Company overview
8.3.2 Financial analysis
8.3.3 Strategic positioning
8.3.4 Info graphic analysis
8.4 GE
8.4.1 Company overview
8.4.2 Financial analysis
8.4.3 Strategic positioning
8.4.4 Info graphic analysis
8.5 Capgemini
8.5.1 Company overview
8.5.2 Financial analysis
8.5.3 Strategic positioning
8.5.4 Info graphic analysis
8.6 Siemens
8.6.1 Company overview
8.6.2 Financial analysis
8.6.3 Strategic positioning
8.6.4 Info graphic analysis
8.7 Wago
8.7.1 Company overview
8.7.2 Financial analysis
8.7.3 Strategic positioning
8.7.4 Info graphic analysis
8.8 L&T Technology Services (LTTS)
8.8.1 Company overview
8.8.2 Financial analysis
8.8.3 Strategic positioning
8.8.4 Info graphic analysis
8.9 Infosys
8.9.1 Company overview
8.9.2 Financial analysis
8.9.3 Strategic positioning
8.9.4 Info graphic analysis
8.10 ABB
8.10.1 Company overview
8.10.2 Financial analysis
8.10.3 Strategic positioning
8.10.4 Info graphic analysis
8.11 Tata Consultancy Services (TCS)
8.11.1 Company overview
8.11.2 Financial analysis
8.11.3 Strategic positioning
8.11.4 Info graphic analysis
8.12 QuEST Global Services Pte. Ltd.
8.12.1 Company overview
8.12.2 Financial analysis
8.12.3 Strategic positioning
8.12.4 Info graphic analysis
8.13 Cyient
8.13.1 Company overview
8.13.2 Financial analysis
8.13.3 Strategic positioning
8.13.4 Info graphic analysis
8.14 Toshiba Energy Systems & Solutions
8.14.1 Company overview
8.14.2 Financial analysis
8.14.3 Strategic positioning
8.14.4 Info graphic analysis
8.15 ScottMadden
8.15.1 Company overview
8.15.2 Financial analysis
8.15.3 Strategic positioning
8.15.4 Info graphic analysis
8.16 Fugro
8.16.1 Company overview
8.16.2 Financial analysis
8.16.3 Strategic positioning
8.16.4 Info graphic analysis
The Global Digital Plant Services Market has been studied from the year 2019 till 2026. However, the CAGR provided in the report is from the year 2021 to 2026. The research methodology involved three stages: Desk research, Primary research, and Analysis & Output from the entire research process.

The desk research involved a robust background study which meant referring to paid and unpaid databases to understand the market dynamics; mapping contracts from press releases; identifying the key players in the market, studying their product portfolio, competition level, annual reports/SEC filings & investor presentations; and learning the demand and supply-side analysis for the Digital Plant Services Market.

The primary research activity included telephonic conversations with more than 50 tier 1 industry consultants, distributors, and end-use product manufacturers.

Finally, based on the above thorough research process, an in-depth analysis was carried out considering the following aspects: market attractiveness, current & future market trends, market share analysis, SWOT analysis of the company and customer analytics.

Frequently Asked Questions

This FREE sample includes market data points, ranging from trend analyses to market estimates & forecasts. See for yourself.
Or view our licence options:
Tailor made solutions just for you
80% of our clients seek made-to-order reports. How do you want us to tailor yours?
OUR CLIENTS


