This report was recently updated on August 10 2025 with the latest and most recent
market numbers
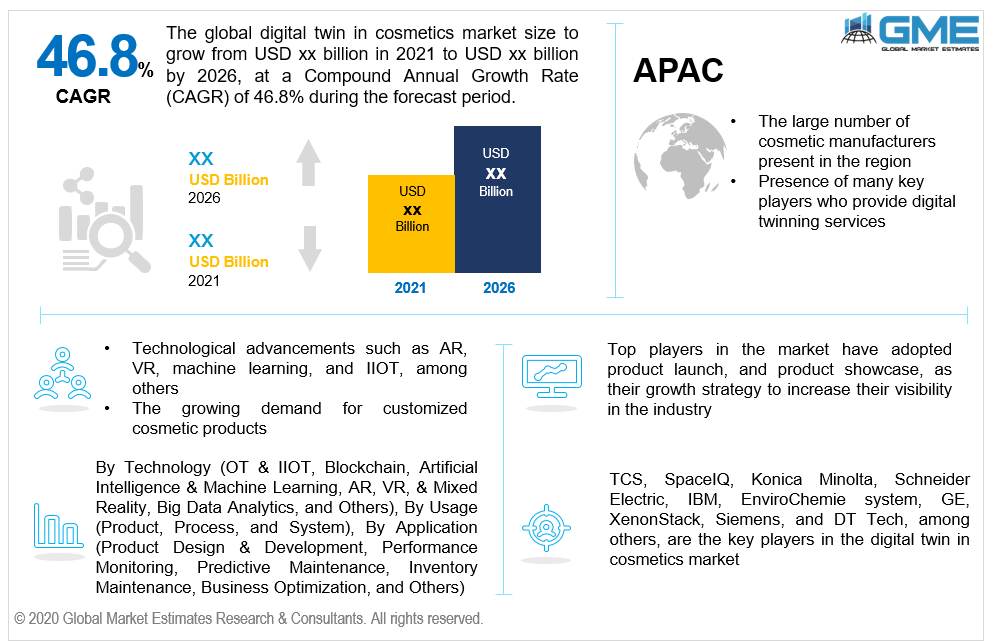
Global Digital Twin in Cosmetics Market Size, Trends & Analysis - Forecasts to 2026 By Technology (OT & IIoT (Industrial Internet of Things), Blockchain, Artificial Intelligence & Machine Learning, Augmented Reality (AR), Virtual Reality (VR), & Mixed Reality, Big Data Analytics, and Others), By Usage (Product, Process, and System), By Application (Product Design & Development, Performance Monitoring, Predictive Maintenance, Inventory Maintenance, Business Optimization, and Others), By Region (North America, Asia Pacific, CSA, Europe, and the Middle East and Africa), Company Market Share Analysis, and Competitor Analysis
The global digital twin in cosmetics market is projected to grow at a CAGR value of 46.8% between 2021 and 2026. Digital twinning is the creation of a computer-simulated model of a real-world complex system. In the cosmetic industry, the growing adoption of technological innovations to create new products, and the growing demand for tailor-made cosmetic products are expected to be the major drivers of the digital twins in cosmetics market.
The demand for highly customized products that are suited to the skin type and color of customers is expected to increase the adoption of digital twins in the cosmetics industry. In the cosmetics industry, digital twins will allow consumers to see the exact result they can expect from the use of products. It can also help consumers to identify the exact product they would require to achieve their desired outcome.
Digital twins can also be used to improve marketing and increase sales revenue. The growing preference for e-commerce and online market channels is expected to be another driver for increasing the adoption of digital twins in the cosmetics industry. With online purchases, customers are more likely to stick to known brands and products as they will be unsure of the outcome from the use of new products. Digital twins will allow consumers to experiment with new products and combinations. The large penetration of e-commerce and its wide reach among the population offers novel market channels for the cosmetics industry.
Digital twins can also be used in the product development phase to understand the working of the product and to ensure there are no side effects or unforeseen mishaps. Digital twins will allow manufacturers to save costs on product testing and attaining product approvals from the necessary regulatory bodies.
The growing adoption of smartphone applications offer a new avenue of growth as digital twins can be used to provide smartphone-based personalized skincare that will increase the access of digital twins to large parts of the population.
The high cost of implementation and development of digital twins will hamper the growth of the market. The collection of personal data and the integration of cloud and IoT will bring about privacy and data security concerns which could hamper the growth of the market. The threat of cyberattacks and the need for increased cybersecurity will also be of concern to the growth of the market.
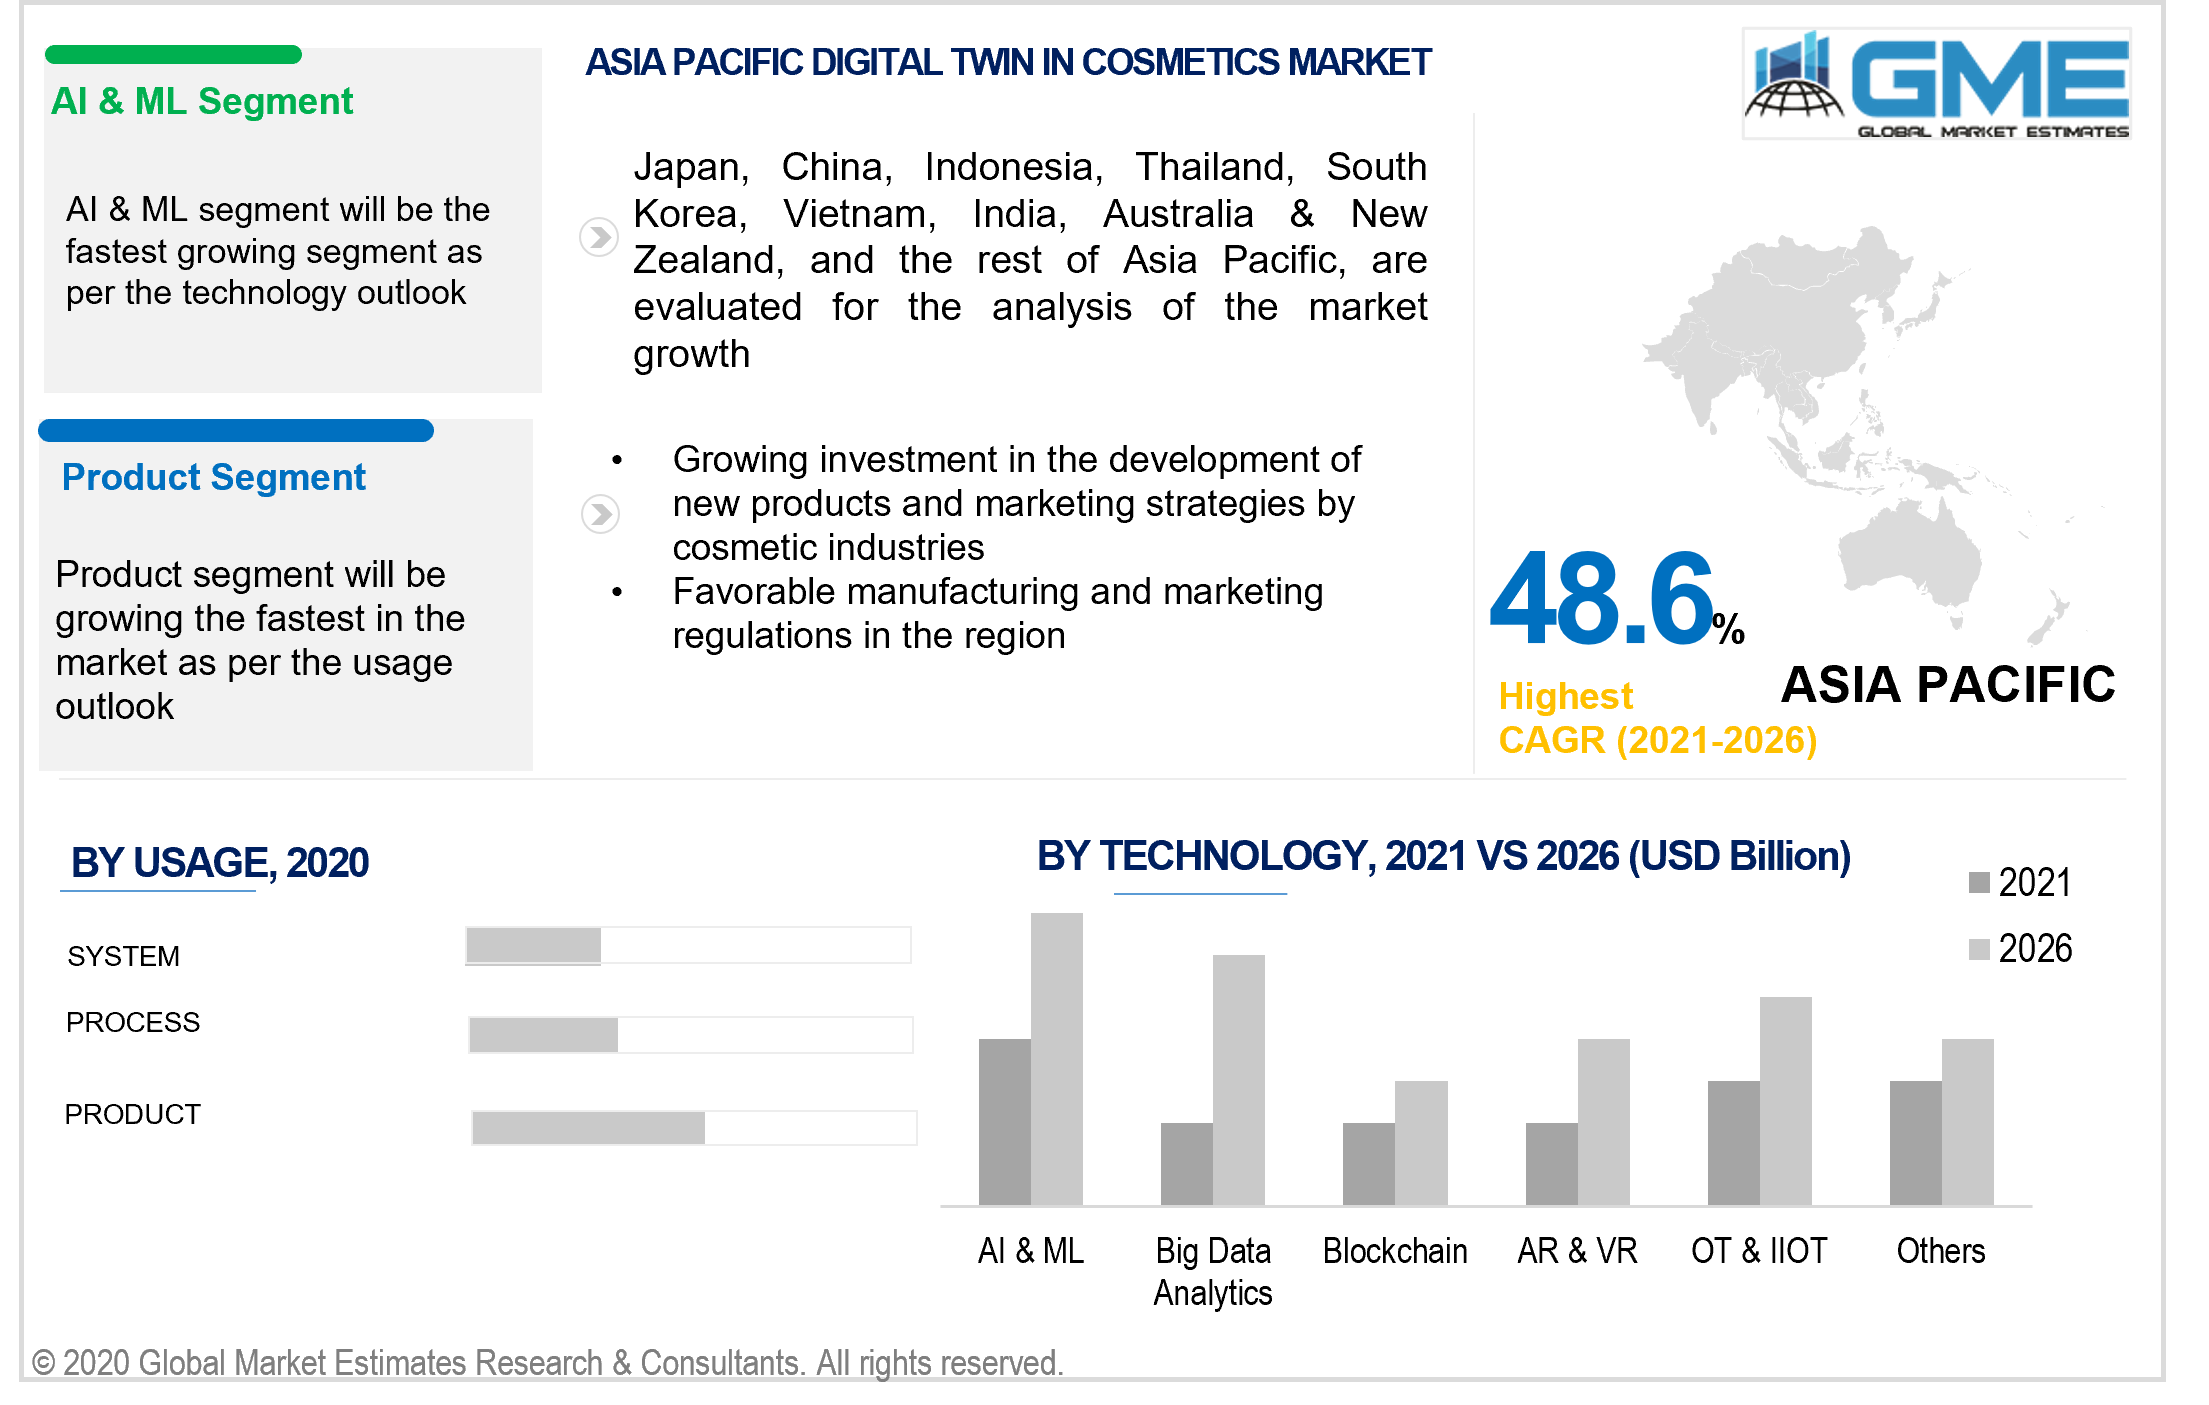
Based on the technology implemented in the industry, the market is segmented into OT & IIoT (industrial internet of things), blockchain, artificial intelligence & machine learning, augmented reality (AR), virtual reality (VR), & mixed reality, big data analytics, and others. The artificial intelligence & machine learning segment is expected to hold the largest share of the revenues generated in the market. Artificial learning and machine learning technologies allow cosmetics manufacturers to create realistic digital twins that can be widely used for product development and end-user-facing applications.
The big data analytics segment is expected to grow at a faster rate than the other segments during the forecast period. The development of digital twins requires large amounts of data and they have to be processed to attain meaningful results. The large amounts of data generated through technologies like IoT and the growing demand for digital twins are expected to enhance the growth of the big data analytics segment.
Based on the usage of digital twins, the market is segmented into product, process, and system. The product segment is expected to hold the dominant share of the market. The growing demand for customized cosmetic products is also expected to further the growth of the product segment.
Based on the various applications of digital twins in the cosmetics industry, the market is segmented into product design & development, performance monitoring, predictive maintenance, inventory maintenance, business optimization, and others. The product design & development segment is expected to hold the largest share of the revenues generated in the market. The use of digital twins will allow researchers to understand the complex interactions between different types of skin with light and the other various interactions that occur between the skin, product, and the environment. Digital twins can help cosmetics manufacturers to understand the needs of the customer better and create customized products to suit different skin types and colors.
Based on region, the market is segmented into North America, Europe, Central and South America, Middle East and Africa, and Asia Pacific regions. The North American region is expected to hold the lion’s share of the digital twin in the cosmetics market. Heavy investment in R&D by cosmetics industries in the region and the growing number of companies that offer digital twins and other technologically advanced solutions are the major drivers of the North American market.
The APAC region is expected to grow at a faster rate than any other regions during the forecast period. A large number of cosmetics manufacturers in the region, growing demand for customized cosmetic products, and the less stringent regulations on product development and marketing are the major drivers of the market in the region.
TCS, SpaceIQ, Konica Minolta, Schneider Electric, IBM, EnviroChemie system, GE, XenonStack, Siemens, and DT Tech, among others are the key players in the digital twin in cosmetics market.
Please note: This is not an exhaustive list of companies profiled in the report.
Chapter 1 Methodology
1.1 Market Scope & Definitions
1.2 Estimates & Forecast Calculation
1.3 Historical Data Overview and Validation
1.4 Data Sources
1.4.1 Secondary
1.4.2 Primary
Chapter 2 Report Outlook
2.1 Digital Twin in Cosmetics Industry Overview, 2020-2026
2.1.1 Industry Overview
2.1.2 Technology Overview
2.1.3 Usage Overview
2.1.4 Process Overview
2.1.6 Regional Overview
Chapter 3 Digital Twin in Cosmetics Market Trends
3.1 Market Segmentation
3.2 Industry Background, 2020-2026
3.3 Market Key Trends
3.3.1 Positive Trends
3.3.1.1 Growing demand for customized cosmetic products
3.3.2 Industry Challenges
3.3.2.1 High cost of development of digital twins
3.4 Prospective Growth Scenario
3.4.1 Technology Growth Scenario
3.4.2 Usage Growth Scenario
3.4.3 Process Growth Scenario
3.5 COVID-19 Influence over Industry Growth
3.6 Porter’s Analysis
3.7 PESTEL Analysis
3.8 Value Chain & Supply Chain Analysis
3.9 Regulatory Framework
3.9.1 North America
3.9.2 Europe
3.9.3 APAC
3.9.4 LATAM
3.9.5 MEA
3.10 End-User Overview
3.11 Market Share Analysis, 2020
3.11.1 Company Positioning Overview, 2020
Chapter 4 Digital Twin in Cosmetics Market, By Technology
4.1 Technology Outlook
4.2 OT & IIOT
4.2.1 Market Size, By Region, 2020-2026 (USD Billion)
4.3 Blockchain
4.3.1 Market Size, By Region, 2020-2026 (USD Billion)
4.4 Artificial Intelligence & Machine Learning
4.4.1 Market Size, By Region, 2020-2026 (USD Billion)
4.5 Augmented Reality, Virtual Reality, & Mixed Reality
4.5.1 Market Size, By Region, 2020-2026 (USD Billion)
4.6 Big Data Analytics
4.6.1 Market Size, By Region, 2020-2026 (USD Billion)
4.7 Others
4.7.1 Market Size, By Region, 2020-2026 (USD Billion)
Chapter 5 Digital Twin in Cosmetics Market, By Usage
5.1 Usage Outlook
5.2 Product
5.2.1 Market Size, By Region, 2020-2026 (USD Billion)
5.3 Process
5.3.1 Market Size, By Region, 2020-2026 (USD Billion)
5.4 System
5.4.1 Market Size, By Region, 2020-2026 (USD Billion)
Chapter 6 Digital Twin in Cosmetics Market, By Process
6.1 Usage Outlook
6.2 Product design & development
6.2.1 Market Size, By Region, 2020-2026 (USD Billion)
6.3 Performance monitoring
6.3.1 Market Size, By Region, 2020-2026 (USD Billion)
6.4 Predictive maintenance
6.4.1 Market Size, By Region, 2020-2026 (USD Billion)
6.5 Inventory Management
6.5.1 Market Size, By Region, 2020-2026 (USD Billion)
6.6 Business Optimization
6.6.1 Market Size, By Region, 2020-2026 (USD Billion)
6.7 Others
6.7.1 Market Size, By Region, 2020-2026 (USD Billion)
Chapter 7 Digital Twin in Cosmetics Market, By Region
7.1 Regional outlook
7.2 North America
7.2.1 Market Size, By Country 2020-2026 (USD Billion)
7.2.2 Market Size, By Technology, 2020-2026 (USD Billion)
7.2.3 Market Size, By Usage, 2020-2026 (USD Billion)
7.2.4 Market Size, By Process, 2020-2026 (USD Billion)
7.2.6 U.S.
7.2.6.1 Market Size, By Technology, 2020-2026 (USD Billion)
7.2.4.2 Market Size, By Usage, 2020-2026 (USD Billion)
7.2.4.3 Market Size, By Process, 2020-2026 (USD Billion)
7.2.7 Canada
7.2.7.1 Market Size, By Technology, 2020-2026 (USD Billion)
7.2.7.2 Market Size, By Usage, 2020-2026 (USD Billion)
7.2.7.3 Market Size, By Process, 2020-2026 (USD Billion)
7.3 Europe
7.3.1 Market Size, By Country 2020-2026 (USD Billion)
7.3.2 Market Size, By Technology, 2020-2026 (USD Billion)
7.3.3 Market Size, By Usage, 2020-2026 (USD Billion)
7.3.4 Market Size, By Process, 2020-2026 (USD Billion)
7.3.6 Germany
7.3.6.1 Market Size, By Technology, 2020-2026 (USD Billion)
7.3.6.2 Market Size, By Usage, 2020-2026 (USD Billion)
7.3.6.3 Market Size, By Process, 2020-2026 (USD Billion)
7.3.7 UK
7.3.7.1 Market Size, By Technology, 2020-2026 (USD Billion)
7.3.7.2 Market Size, By Usage, 2020-2026 (USD Billion)
7.3.7.3 Market Size, By Process, 2020-2026 (USD Billion)
7.3.8 France
7.3.7.1 Market Size, By Technology, 2020-2026 (USD Billion)
7.3.7.2 Market Size, By Usage, 2020-2026 (USD Billion)
7.3.7.3 Market Size, By Process, 2020-2026 (USD Billion)
7.3.9 Italy
7.3.9.1 Market Size, By Technology, 2020-2026 (USD Billion)
7.3.9.2 Market Size, By Usage, 2020-2026 (USD Billion)
7.3.9.3 Market Size, By Process, 2020-2026 (USD Billion)
7.3.10 Spain
7.3.10.1 Market Size, By Technology, 2020-2026 (USD Billion)
7.3.10.2 Market Size, By Usage, 2020-2026 (USD Billion)
7.3.10.3 Market Size, By Process, 2020-2026 (USD Billion)
7.3.11 Russia
7.3.11.1 Market Size, By Technology, 2020-2026 (USD Billion)
7.3.11.2 Market Size, By Usage, 2020-2026 (USD Billion)
7.3.11.3 Market Size, By Process, 2020-2026 (USD Billion)
7.4 Asia Pacific
7.4.1 Market Size, By Country 2020-2026 (USD Billion)
7.4.2 Market Size, By Technology, 2020-2026 (USD Billion)
7.4.3 Market Size, By Usage, 2020-2026 (USD Billion)
7.4.4 Market Size, By Process, 2020-2026 (USD Billion)
7.4.6 China
7.4.6.1 Market Size, By Technology, 2020-2026 (USD Billion)
7.4.6.2 Market Size, By Usage, 2020-2026 (USD Billion)
7.4.6.3 Market Size, By Process, 2020-2026 (USD Billion)
7.4.7 India
7.4.7.1 Market Size, By Technology, 2020-2026 (USD Billion)
7.4.7.2 Market Size, By Usage, 2020-2026 (USD Billion)
7.4.7.3 Market Size, By Process, 2020-2026 (USD Billion)
7.4.8 Japan
7.4.7.1 Market Size, By Technology, 2020-2026 (USD Billion)
7.4.7.2 Market Size, By Usage, 2020-2026 (USD Billion)
7.4.7.3 Market Size, By Process, 2020-2026 (USD Billion)
7.4.9 Australia
7.4.9.1 Market Size, By Technology, 2020-2026 (USD Billion)
7.4.9.2 Market size, By Usage, 2020-2026 (USD Billion)
7.4.9.3 Market Size, By Process, 2020-2026 (USD Billion)
7.4.10 South Korea
7.4.10.1 Market Size, By Technology, 2020-2026 (USD Billion)
7.4.10.2 Market Size, By Usage, 2020-2026 (USD Billion)
7.4.10.3 Market Size, By Process, 2020-2026 (USD Billion)
7.5 Latin America
7.5.1 Market Size, By Country 2020-2026 (USD Billion)
7.5.2 Market Size, By Technology, 2020-2026 (USD Billion)
7.5.3 Market Size, By Usage, 2020-2026 (USD Billion)
7.5.4 Market Size, By Process, 2020-2026 (USD Billion)
7.5.6 Brazil
7.5.6.1 Market Size, By Technology, 2020-2026 (USD Billion)
7.5.6.2 Market Size, By Usage, 2020-2026 (USD Billion)
7.5.6.3 Market Size, By Process, 2020-2026 (USD Billion)
7.5.7 Mexico
7.5.7.1 Market Size, By Technology, 2020-2026 (USD Billion)
7.5.7.2 Market Size, By Usage, 2020-2026 (USD Billion)
7.5.7.3 Market Size, By Process, 2020-2026 (USD Billion)
7.5.8 Argentina
7.5.7.1 Market Size, By Technology, 2020-2026 (USD Billion)
7.5.7.2 Market Size, By Usage, 2020-2026 (USD Billion)
7.5.7.3 Market Size, By Process, 2020-2026 (USD Billion)
7.6 MEA
7.6.1 Market Size, By Country 2020-2026 (USD Billion)
7.6.2 Market Size, By Technology, 2020-2026 (USD Billion)
7.6.3 Market Size, By Usage, 2020-2026 (USD Billion)
7.6.4 Market Size, By Process, 2020-2026 (USD Billion)
7.6.6 Saudi Arabia
7.6.6.1 Market Size, By Technology, 2020-2026 (USD Billion)
7.6.6.2 Market Size, By Usage, 2020-2026 (USD Billion)
7.6.6.3 Market Size, By Process, 2020-2026 (USD Billion)
7.6.7 UAE
7.6.7.1 Market Size, By Technology, 2020-2026 (USD Billion)
7.6.7.2 Market Size, By Usage, 2020-2026 (USD Billion)
7.6.7.3 Market Size, By Process, 2020-2026 (USD Billion)
7.6.8 South Africa
7.6.7.1 Market Size, By Technology, 2020-2026 (USD Billion)
7.6.7.2 Market Size, By Usage, 2020-2026 (USD Billion)
7.6.7.3 Market Size, By Process, 2020-2026 (USD Billion)
Chapter 8 Company Landscape
8.1 Competitive Analysis, 2020
8.2 TCS
8.2.1 Company Overview
8.2.2 Financial Analysis
8.2.3 Strategic Positioning
8.2.4 Info Graphic Analysis
8.3 SpaceIQ
8.3.1 Company Overview
8.3.2 Financial Analysis
8.3.3 Strategic Positioning
8.3.4 Info Graphic Analysis
8.4 Konica Minolta
8.4.1 Company Overview
8.4.2 Financial Analysis
8.4.3 Strategic Positioning
8.4.4 Info Graphic Analysis
8.5 Schneider Electric
8.5.1 Company Overview
8.5.2 Financial Analysis
8.5.3 Strategic Positioning
8.5.4 Info Graphic Analysis
8.6 IBM
8.6.1 Company Overview
8.6.2 Financial Analysis
8.6.3 Strategic Positioning
8.6.4 Info Graphic Analysis
8.7 EnviroChemie System
8.7.1 Company Overview
8.7.2 Financial Analysis
8.7.3 Strategic Positioning
8.7.4 Info Graphic Analysis
8.8 GE
8.8.1 Company Overview
8.8.2 Financial Analysis
8.8.3 Strategic Positioning
8.8.4 Info Graphic Analysis
8.9 XenonStack
8.8.1 Company Overview
8.8.2 Financial Analysis
8.8.3 Strategic Positioning
8.8.4 Info Graphic Analysis
8.10 Siemens
8.10.1 Company Overview
8.10.2 Financial Analysis
8.10.3 Strategic Positioning
8.10.4 Info Graphic Analysis
8.11 DT Tech
8.11.1 Company Overview
8.11.2 Financial Analysis
8.11.3 Strategic Positioning
8.11.4 Info Graphic Analysis
8.12 Other Companies
8.12.1 Company Overview
8.12.2 Financial Analysis
8.12.3 Strategic Positioning
8.12.4 Info Graphic Analysis
The Global Digital Twin in Cosmetics Market has been studied from the year 2019 till 2026. However, the CAGR provided in the report is from the year 2021 to 2026. The research methodology involved three stages: Desk research, Primary research, and Analysis & Output from the entire research process.

The desk research involved a robust background study which meant referring to paid and unpaid databases to understand the market dynamics; mapping contracts from press releases; identifying the key players in the market, studying their product portfolio, competition level, annual reports/SEC filings & investor presentations; and learning the demand and supply-side analysis for the Digital Twin in Cosmetics Market.

The primary research activity included telephonic conversations with more than 50 tier 1 industry consultants, distributors, and end-use product manufacturers.

Finally, based on the above thorough research process, an in-depth analysis was carried out considering the following aspects: market attractiveness, current & future market trends, market share analysis, SWOT analysis of the company and customer analytics.

Frequently Asked Questions

This FREE sample includes market data points, ranging from trend analyses to market estimates & forecasts. See for yourself.
Or view our licence options:
Tailor made solutions just for you
80% of our clients seek made-to-order reports. How do you want us to tailor yours?
OUR CLIENTS


