This report was recently updated on August 24 2025 with the latest and most recent
market numbers
Global Digital Twin in Supply Chain Market Size, Trends & Analysis - Forecasts to 2028 By Software Type (Process Digital Twin and Product Digital Twin), By Application (Logistics & Supply Chain Network Optimization, Logistics Infrastructure & Design, Warehouse Simulation, Equipment Condition Monitoring, and Others), and By Region (North America, Asia Pacific, Central & South America, Europe, and Middle East and Africa), Competitive Landscape, Company Market Share Analysis, and Competitor Analysis
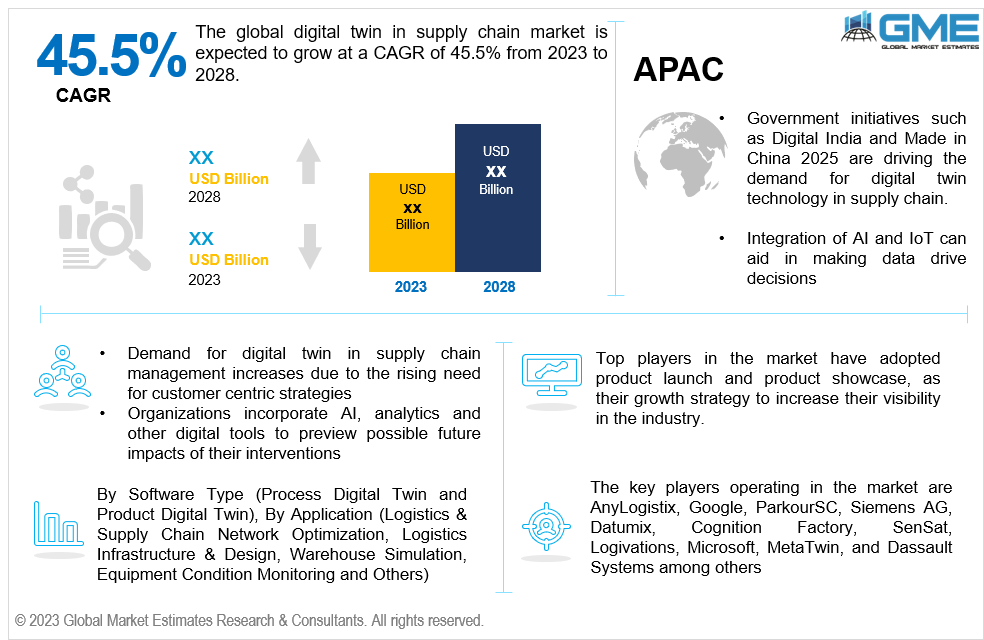
The global digital twin in supply chain market is expected to grow at a CAGR of 45.5% from 2023 to 2028. Digital twin is a digital clone or a replica of the intended physical object, process, or person. It imitates all the characteristics of any intended object given. Digital twin technology is used to create replicas of supply chains by organizations to test different models, scenarios, and policies and understand the potential impact of the decisions and disruptions made in the process on their operations.
The increasing need for customer-centric strategies and the adoption of AI tools drive the demand for digital twins in the supply chain. Artificial Intelligence (AI) and advanced analytics can help create simulations and show a preview of the possible future scenario depending on the situational market driving factors and constraints for a given supply chain strategy. Such a deep understanding of the future impact can assist the organizations and market players using the technology to make more customer-centric strategies or modify and innovate existing schemes to fulfil consumer demands, which drives the growth of the digital twin in supply chain market.
However, the initial high level of investments associated with implementing digital twin technology and data privacy concerns hinder the market growth. The software and equipment requires to involve significant financial investment and require skilled professionals. With the great extent of cyber security concerns, there can be considerable concerns about data privacy and security from the client’s end regarding the integration of digital twin technology in the supply chain.
Based on software type, the market is segmented into process digital twin and product digital twin. Process digital twin segment held the largest share of the market in 2022 and is expected to retain its dominance during the forecast period. The segment growth is attributed to the rising demand for optimization and better supply chain operations management, such as better inventory management, production processes, and logistics. The technology assists in real-time monitoring, predictive analysis, and decision-making to streamline the movement of goods.
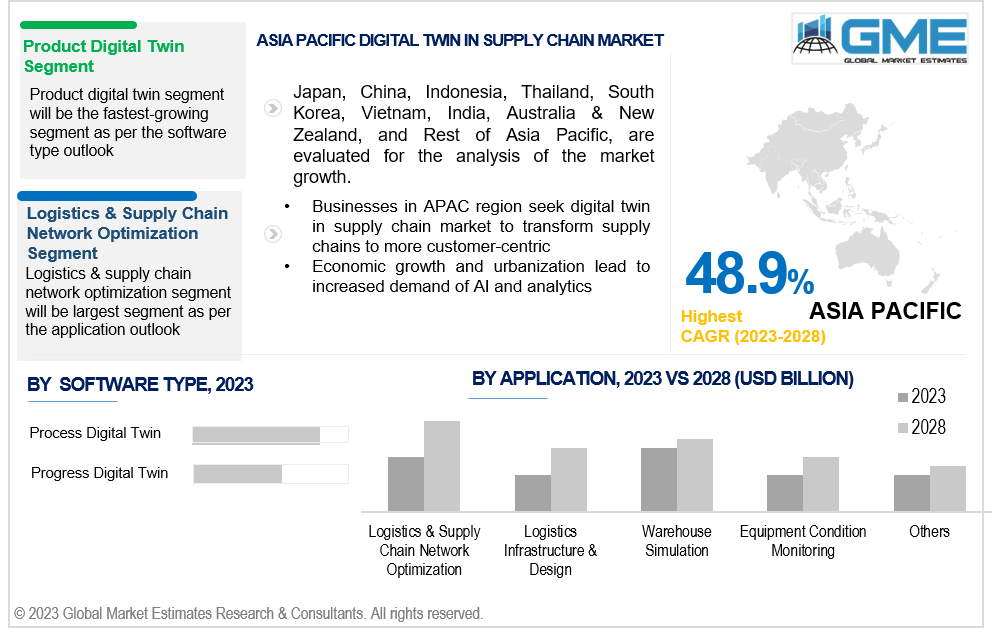
Product digital twin segment is anticipated to witness fastest growth in the market in the forecast period between 2023 to 2028. The growth of the segment is attributed to the role of digital twin technology in product design and quality control of the intended products.
Based on application, the market is segmented into logistics & supply chain network optimization, logistics infrastructure & design, warehouse simulation, equipment condition monitoring, and others. Logistics & supply chain optimization held the largest share in the market in 2022 and is projected to retain its dominance in the market in the forecast period. This application of digital twin technology in logistics & supply chain network helps recreate supply chain networks to reduce transit period, minimize cost of operation and enhance the overall chain efficiency.
Logistics infrastructure & design segment is projected to witness fastest growth during the forecast period between 2023 to 2030. The segment growth is attributed to the increasing adoption of digital twin technology for designing and modelling infrastructures such as warehouses and transportation hubs. Infrastructure simulations allow the companies to test different operational scenarios, ensuring efficient layouts and optimized inventory management.
North America is analysed to be the largest region in the global digital twin in supply chain market during the forecast period. Countries such as the United States and Canada are developed and digitally advanced economies. End users of digital twin technology in the supply chain in the United States are investing in adopting digital twin technology to optimize the traditional linear supply chain to a more advanced version. The region has a presence of major market players such as Siemens AG and Google, who hold a significant share in the digital twin technology market.
Asia Pacific is projected to be the fastest growing region across the global digital twin in supply chain market. The growth of the regional market is attributed to the growing e-commerce industry, urbanization, and technological advancements such as the Internet of Things (IoT). Moreover, using digital twin technology helps minimize carbon footprints and thus makes the process sustainable in nature, thereby driving market growth. Government initiatives in several nations have also driven the demand for digital twin technology in supply chain. Initiatives like ‘Made in China 2025’ by the Chinese government and the ‘Digital India’ program by the Indian government aim to adopt AI and other intelligence tools and transform the supply chain, among other transformations.
The key players operating in the market are AnyLogistix, Google, ParkourSC, Siemens AG, Datumix, Cognition Factory, SenSat, Logivations, Microsoft, MetaTwin, and Dassault Systems among others.
Please note: This is not an exhaustive list of companies profiled in the report.
In September 2021, Google Cloud launched the Supply Chain Twin, which allows companies to create a digital twin, a virtual representation of their physical supply chain by orchestrating data from disparate sources to get a more complete view of suppliers, inventories, and other information. It also provides real-time analytics and alerts on issues about potential disruptions and others.
1 STRATEGIC INSIGHTS ON NEW REVENUE POCKETS
1.1 Strategic Opportunity & Attractiveness Analysis
1.1.1 Hot Revenue Pockets
1.1.2 Market Attractiveness Score
1.1.3 Revenue Impacting Opportunity
1.1.4 High Growing Region/Country
1.1.5 Competitor Analysis
1.1.6 Consumer Analysis
1.2 Global Market Estimates' View
1.3 Strategic Insights across Business Functions
1.3.1 For Chief Executive Officers
1.3.2 For Chief Marketing Officers
1.3.3 For Chief Strategy Officers
1.4 Evaluate the Potential of your Existing Business Lines vs. New Lines to Enter Into
2.1 Technological Adoption Rate
2.2 Current Trend Impact Analysis
2.3 Future Trend Impact Analysis
3.1.2 Adjacent Market Opportunities
3.1.3 Ancillary Market Opportunities
3.2.1 Market Drivers: Impact Analysis
3.2.2 Market Restraints: Impact Analysis
3.2.3 Market Opportunities: Impact Analysis
3.2.4 Market Challenges: Impact Analysis
3.3.1 Porter’s Five Forces Analysis
3.3.1.1 Threat of New Entrants
3.3.1.2 Threat of New Substitutes
3.3.1.3 Bargaining Power of Suppliers
3.3.1.4 Bargaining Power of Buyers
3.3.1.5 Intensity of Competitive Rivalry
3.3.2 SWOT Analysis; By Factor (Political & Legal, Economic, and Technological)
4 GLOBAL DIGITAL TWIN IN SUPPLY CHAIN MARKET, BY SOFTWARE TYPE
4.2 Digital Twin in Supply Chain Market: Software Type Scope Key Takeaways
4.3 Revenue Growth Analysis, 2022 & 2028
4.4.1 Process Digital Twin Market Estimates and Forecast, 2020-2028 (USD Million)
4.5.1 Product Digital Twin Market Estimates and Forecast, 2020-2028 (USD Million)
5 GLOBAL DIGITAL TWIN IN SUPPLY CHAIN MARKET, BY APPLICATION
5.2 Digital Twin in Supply Chain Market: Application Scope Key Takeaways
5.3 Revenue Growth Analysis, 2022 & 2028
5.4 Logistics & Supply Chain Network Optimization
5.5 Logistics Infrastructure & Design
5.5.1 Logistics Infrastructure & Design Market Estimates and Forecast, 2020-2028 (USD Million)
5.6.1 Warehouse Simulation Market Estimates and Forecast, 2020-2028 (USD Million)
5.7 Equipment Condition Monitoring
5.7.1 Equipment Condition Monitoring Market Estimates and Forecast, 2020-2028 (USD Million)
5.8.1 Others Market Estimates and Forecast, 2020-2028 (USD Million)
6 GLOBAL DIGITAL TWIN IN SUPPLY CHAIN MARKET, BY REGION
6.2.3.1 U.S. Digital Twin in Supply Chain Market Estimates and Forecast, 2020-2028 (USD Million)
6.2.3.2 Canada Digital Twin in Supply Chain Market Estimates and Forecast, 2020-2028 (USD Million)
6.2.3.3 Mexico Digital Twin in Supply Chain Market Estimates and Forecast, 2020-2028 (USD Million)
6.3 Europe Digital Twin in Supply Chain Market Estimates and Forecast, 2020-2028 (USD Million)
6.3.3.1 Germany Digital Twin in Supply Chain Market Estimates and Forecast, 2020-2028 (USD Million)
6.3.3.2 U.K. Digital Twin in Supply Chain Market Estimates and Forecast, 2020-2028 (USD Million)
6.3.3.3 France Digital Twin in Supply Chain Market Estimates and Forecast, 2020-2028 (USD Million)
6.3.3.4 Italy Digital Twin in Supply Chain Market Estimates and Forecast, 2020-2028 (USD Million)
6.3.3.5 Spain Digital Twin in Supply Chain Market Estimates and Forecast, 2020-2028 (USD Million)
6.4 Asia Pacific Digital Twin in Supply Chain Market Estimates and Forecast, 2020-2028 (USD Million)
6.4.3.1 China Digital Twin in Supply Chain Market Estimates and Forecast, 2020-2028 (USD Million)
6.4.3.2 Japan Digital Twin in Supply Chain Market Estimates and Forecast, 2020-2028 (USD Million)
6.4.3.3 India Digital Twin in Supply Chain Market Estimates and Forecast, 2020-2028 (USD Million)
6.4.3.6 Malaysia Digital Twin in Supply Chain Market Estimates and Forecast, 2020-2028 (USD Million)
6.4.3.7 Thailand Digital Twin in Supply Chain Market Estimates and Forecast, 2020-2028 (USD Million)
6.4.3.9 Vietnam Digital Twin in Supply Chain Market Estimates and Forecast, 2020-2028 (USD Million)
6.4.3.10 Taiwan Digital Twin in Supply Chain Market Estimates and Forecast, 2020-2028 (USD Million)
6.5.3.2 U.A.E. Digital Twin in Supply Chain Market Estimates and Forecast, 2020-2028 (USD Million)
6.5.3.3 Israel Digital Twin in Supply Chain Market Estimates and Forecast, 2020-2028 (USD Million)
6.6.3.1 Brazil Digital Twin in Supply Chain Market Estimates and Forecast, 2020-2028 (USD Million)
6.6.3.3 Chile Digital Twin in Supply Chain Market Estimates and Forecast, 2020-2028 (USD Million)
7.1 Company Market Share Analysis
7.2 Four Quadrant Positioning Matrix
7.4.1.1 Business Description & Financial Analysis
7.4.1.3 Products & Services Offered
7.4.1.4 Strategic Alliances between Business Partners
7.4.2.1 Business Description & Financial Analysis
7.4.2.3 Products & Services Offered
7.4.2.4 Strategic Alliances between Business Partners
7.4.3.1 Business Description & Financial Analysis
7.4.3.3 Products & Services Offered
7.4.3.4 Strategic Alliances between Business Partners
7.4.4.1 Business Description & Financial Analysis
7.4.4.3 Products & Services Offered
7.4.4.4 Strategic Alliances between Business Partners
7.4.5.1 Business Description & Financial Analysis
7.4.5.3 Products & Services Offered
7.4.5.4 Strategic Alliances between Business Partners
7.4.6.1 Business Description & Financial Analysis
7.4.6.3 Products & Services Offered
7.4.6.4 Strategic Alliances between Business Partners
7.4.7.1 Business Description & Financial Analysis
7.4.7.3 Products & Services Offered
7.4.7.4 Strategic Alliances between Business Partners
7.4.8.1 Business Description & Financial Analysis
7.4.8.3 Products & Services Offered
7.4.8.4 Strategic Alliances between Business Partners
7.4.9.1 Business Description & Financial Analysis
7.4.9.3 Products & Services Offered
7.4.9.4 Strategic Alliances between Business Partners
7.4.10.1 Business Description & Financial Analysis
7.4.10.3 Products & Services Offered
7.4.10.4 Strategic Alliances between Business Partners
7.4.11.1 Business Description & Financial Analysis
7.4.11.3 Products & Services Offered
7.4.11.4 Strategic Alliances between Business Partners
8.1.2 Market Scope & Segmentation
8.2.1.2 GMEs Internal Data Repository
8.2.1.3 Secondary Resources & Third Party Perspectives
8.2.1.4 Company Information Sources
8.2.2.1 Various Types of Respondents for Primary Interviews
8.2.2.2 Number of Interviews Conducted throughout the Research Process
8.2.2.4 Discussion Guide for Primary Participants
8.2.3.1 Expert Panels Across 30+ Industry
8.2.4.1 Paid Local Experts Across 30+ Industry Across each Region
8.3.1.1 Macro-Economic Indicators Considered
8.3.1.2 Micro-Economic Indicators Considered
8.3.2.1 Company Share Analysis Approach
8.3.2.2 Estimation of Potential Product Sales
8.4.2 Time Series, Cross Sectional & Panel Data Analysis
8.5.1 Inhouse AI Based Real Time Analytics Tool
8.5.2 Output From Desk & Primary Research
8.6 Research Assumptions & Limitations
LIST OF TABLES
1 Global Digital Twin in Supply Chain Market, By Software Type, 2020-2028 (USD Mllion)
2 Process Digital Twin Market, By Region, 2020-2028 (USD Mllion)
3 Product Digital Twin Market, By Region, 2020-2028 (USD Mllion)
4 Global Digital Twin in Supply Chain Market, By Application, 2020-2028 (USD Mllion)
5 Logistics & Supply Chain Network Optimization Market, By Region, 2020-2028 (USD Mllion)
6 Logistics Infrastructure & Design Market, By Region, 2020-2028 (USD Mllion)
7 Warehouse Simulation Market, By Region, 2020-2028 (USD Mllion)
8 Equipment Condition Monitoring Market, By Region, 2020-2028 (USD Mllion)
9 Equipment Condition Monitoring Market, By Region, 2020-2028 (USD Mllion)
10 Regional Analysis, 2020-2028 (USD Mllion)
11 North America Digital Twin in Supply Chain Market, By Software Type, 2020-2028 (USD Mllion)
12 North America Digital Twin in Supply Chain Market, By Application, 2020-2028 (USD Mllion)
13 U.S. Digital Twin in Supply Chain Market, By Software Type, 2020-2028 (USD Mllion)
14 U.S. Digital Twin in Supply Chain Market, By Application, 2020-2028 (USD Mllion)
15 Canada Digital Twin in Supply Chain Market, By Software Type, 2020-2028 (USD Mllion)
16 Canada Digital Twin in Supply Chain Market, By Application, 2020-2028 (USD Mllion)
17 Mexico Digital Twin in Supply Chain Market, By Software Type, 2020-2028 (USD Mllion)
18 Mexico Digital Twin in Supply Chain Market, By Application, 2020-2028 (USD Mllion)
19 Europe Digital Twin in Supply Chain Market, By Software Type, 2020-2028 (USD Mllion)
20 Europe Digital Twin in Supply Chain Market, By Application, 2020-2028 (USD Mllion)
21 Germany Digital Twin in Supply Chain Market, By Software Type, 2020-2028 (USD Mllion)
22 Germany Digital Twin in Supply Chain Market, By Application, 2020-2028 (USD Mllion)
23 U.K. Digital Twin in Supply Chain Market, By Software Type, 2020-2028 (USD Mllion)
24 U.K. Digital Twin in Supply Chain Market, By Application, 2020-2028 (USD Mllion)
25 France Digital Twin in Supply Chain Market, By Software Type, 2020-2028 (USD Mllion)
26 France Digital Twin in Supply Chain Market, By Application, 2020-2028 (USD Mllion)
27 Italy Digital Twin in Supply Chain Market, By Software Type, 2020-2028 (USD Mllion)
28 Italy Digital Twin in Supply Chain Market, By Application, 2020-2028 (USD Mllion)
29 Spain Digital Twin in Supply Chain Market, By Software Type, 2020-2028 (USD Mllion)
30 Spain Digital Twin in Supply Chain Market, By Application, 2020-2028 (USD Mllion)
31 Netherlands Digital Twin in Supply Chain Market, By Software Type, 2020-2028 (USD Mllion)
32 Netherlands Digital Twin in Supply Chain Market, By Application, 2020-2028 (USD Mllion)
33 Rest Of Europe Digital Twin in Supply Chain Market, By Software Type, 2020-2028 (USD Mllion)
34 Rest Of Europe Digital Twin in Supply Chain Market, By Application, 2020-2028 (USD Mllion)
35 Asia Pacific Digital Twin in Supply Chain Market, By Software Type, 2020-2028 (USD Mllion)
36 Asia Pacific Digital Twin in Supply Chain Market, By Application, 2020-2028 (USD Mllion)
37 China Digital Twin in Supply Chain Market, By Software Type, 2020-2028 (USD Mllion)
38 China Digital Twin in Supply Chain Market, By Application, 2020-2028 (USD Mllion)
39 Japan Digital Twin in Supply Chain Market, By Software Type, 2020-2028 (USD Mllion)
40 Japan Digital Twin in Supply Chain Market, By Application, 2020-2028 (USD Mllion)
41 India Digital Twin in Supply Chain Market, By Software Type, 2020-2028 (USD Mllion)
42 India Digital Twin in Supply Chain Market, By Application, 2020-2028 (USD Mllion)
43 South Korea Digital Twin in Supply Chain Market, By Software Type, 2020-2028 (USD Mllion)
44 South Korea Digital Twin in Supply Chain Market, By Application, 2020-2028 (USD Mllion)
45 Singapore Digital Twin in Supply Chain Market, By Software Type, 2020-2028 (USD Mllion)
46 Singapore Digital Twin in Supply Chain Market, By Application, 2020-2028 (USD Mllion)
47 Thailand Digital Twin in Supply Chain Market, By Software Type, 2020-2028 (USD Mllion)
48 Thailand Digital Twin in Supply Chain Market, By Application, 2020-2028 (USD Mllion)
49 Malaysia Digital Twin in Supply Chain Market, By Software Type, 2020-2028 (USD Mllion)
50 Malaysia Digital Twin in Supply Chain Market, By Application, 2020-2028 (USD Mllion)
51 Indonesia Digital Twin in Supply Chain Market, By Software Type, 2020-2028 (USD Mllion)
52 Indonesia Digital Twin in Supply Chain Market, By Application, 2020-2028 (USD Mllion)
53 Vietnam Digital Twin in Supply Chain Market, By Software Type, 2020-2028 (USD Mllion)
54 Vietnam Digital Twin in Supply Chain Market, By Application, 2020-2028 (USD Mllion)
55 Taiwan Digital Twin in Supply Chain Market, By Software Type, 2020-2028 (USD Mllion)
56 Taiwan Digital Twin in Supply Chain Market, By Application, 2020-2028 (USD Mllion)
57 Rest of APAC Digital Twin in Supply Chain Market, By Software Type, 2020-2028 (USD Mllion)
58 Rest of APAC Digital Twin in Supply Chain Market, By Application, 2020-2028 (USD Mllion)
59 Middle East and Africa Digital Twin in Supply Chain Market, By Software Type, 2020-2028 (USD Mllion)
60 Middle East and Africa Digital Twin in Supply Chain Market, By Application, 2020-2028 (USD Mllion)
61 Saudi Arabia Digital Twin in Supply Chain Market, By Software Type, 2020-2028 (USD Mllion)
62 Saudi Arabia Digital Twin in Supply Chain Market, By Application, 2020-2028 (USD Mllion)
63 UAE Digital Twin in Supply Chain Market, By Software Type, 2020-2028 (USD Mllion)
64 UAE Digital Twin in Supply Chain Market, By Application, 2020-2028 (USD Mllion)
65 Israel Digital Twin in Supply Chain Market, By Software Type, 2020-2028 (USD Mllion)
66 Israel Digital Twin in Supply Chain Market, By Application, 2020-2028 (USD Mllion)
67 South Africa Digital Twin in Supply Chain Market, By Software Type, 2020-2028 (USD Mllion)
68 South Africa Digital Twin in Supply Chain Market, By Application, 2020-2028 (USD Mllion)
69 Rest Of Middle East and Africa Digital Twin in Supply Chain Market, By Software Type, 2020-2028 (USD Mllion)
70 Rest Of Middle East and Africa Digital Twin in Supply Chain Market, By Application, 2020-2028 (USD Mllion)
71 Central & South America Digital Twin in Supply Chain Market, By Software Type, 2020-2028 (USD Mllion)
72 Central & South America Digital Twin in Supply Chain Market, By Application, 2020-2028 (USD Mllion)
73 Brazil Digital Twin in Supply Chain Market, By Software Type, 2020-2028 (USD Mllion)
74 Brazil Digital Twin in Supply Chain Market, By Application, 2020-2028 (USD Mllion)
75 Chile Digital Twin in Supply Chain Market, By Software Type, 2020-2028 (USD Mllion)
76 Chile Digital Twin in Supply Chain Market, By Application, 2020-2028 (USD Mllion)
77 Argentina Digital Twin in Supply Chain Market, By Software Type, 2020-2028 (USD Mllion)
78 Argentina Digital Twin in Supply Chain Market, By Application, 2020-2028 (USD Mllion)
79 Rest Of Central & South America Digital Twin in Supply Chain Market, By Software Type, 2020-2028 (USD Mllion)
80 Rest Of Central & South America Digital Twin in Supply Chain Market, By Application, 2020-2028 (USD Mllion)
81 AnyLogistix: Products & Services Offering
82 Google: Products & Services Offering
83 ParkourSC: Products & Services Offering
84 Siemens AG: Products & Services Offering
85 Datumix: Products & Services Offering
86 COGNITION FACTORY: Products & Services Offering
87 SenSat : Products & Services Offering
88 Logivations : Products & Services Offering
89 Microsoft, Inc: Products & Services Offering
90 MetaTwin: Products & Services Offering
91 Other Companies: Products & Services Offering
LIST OF FIGURES
1 Global Digital Twin in Supply Chain Market Overview
2 Global Digital Twin in Supply Chain Market Value From 2020-2028 (USD Mllion)
3 Global Digital Twin in Supply Chain Market Share, By Software Type (2022)
4 Global Digital Twin in Supply Chain Market Share, By Application (2022)
5 Global Digital Twin in Supply Chain Market, By Region (Asia Pacific Market)
6 Technological Trends In Global Digital Twin in Supply Chain Market
7 Four Quadrant Competitor Positioning Matrix
8 Impact Of Macro & Micro Indicators On The Market
9 Impact Of Key Drivers On The Global Digital Twin in Supply Chain Market
10 Impact Of Challenges On The Global Digital Twin in Supply Chain Market
11 Porter’s Five Forces Analysis
12 Global Digital Twin in Supply Chain Market: By Software Type Scope Key Takeaways
13 Global Digital Twin in Supply Chain Market, By Software Type Segment: Revenue Growth Analysis
14 Process Digital Twin Market, By Region, 2020-2028 (USD Mllion)
15 Product Digital Twin Market, By Region, 2020-2028 (USD Mllion)
16 Global Digital Twin in Supply Chain Market: By Application Scope Key Takeaways
17 Global Digital Twin in Supply Chain Market, By Application Segment: Revenue Growth Analysis
18 Logistics & Supply Chain Network Optimization Market, By Region, 2020-2028 (USD Mllion)
19 Logistics Infrastructure & Design Market, By Region, 2020-2028 (USD Mllion)
20 Warehouse Simulation Market, By Region, 2020-2028 (USD Mllion)
21 Equipment Condition Monitoring Market, By Region, 2020-2028 (USD Mllion)
22 Others Market, By Region, 2020-2028 (USD Mllion)
23 Regional Segment: Revenue Growth Analysis
24 Global Digital Twin in Supply Chain Market: Regional Analysis
25 North America Digital Twin in Supply Chain Market Overview
26 North America Digital Twin in Supply Chain Market, By Software Type
27 North America Digital Twin in Supply Chain Market, By Application
28 North America Digital Twin in Supply Chain Market, By Country
29 U.S. Digital Twin in Supply Chain Market, By Software Type
30 U.S. Digital Twin in Supply Chain Market, By Application
31 Canada Digital Twin in Supply Chain Market, By Software Type
32 Canada Digital Twin in Supply Chain Market, By Application
33 Mexico Digital Twin in Supply Chain Market, By Software Type
34 Mexico Digital Twin in Supply Chain Market, By Application
35 Four Quadrant Positioning Matrix
36 Company Market Share Analysis
37 AnyLogistix: Company Snapshot
38 AnyLogistix: SWOT Analysis
39 AnyLogistix: Geographic Presence
40 Google: Company Snapshot
41 Google: SWOT Analysis
42 Google: Geographic Presence
43 ParkourSC: Company Snapshot
44 ParkourSC: SWOT Analysis
45 ParkourSC: Geographic Presence
46 Siemens AG: Company Snapshot
47 Siemens AG: Swot Analysis
48 Siemens AG: Geographic Presence
49 Datumix: Company Snapshot
50 Datumix: SWOT Analysis
51 Datumix: Geographic Presence
52 COGNITION FACTORY: Company Snapshot
53 COGNITION FACTORY: SWOT Analysis
54 COGNITION FACTORY: Geographic Presence
55 SenSat : Company Snapshot
56 SenSat : SWOT Analysis
57 SenSat : Geographic Presence
58 Logivations : Company Snapshot
59 Logivations : SWOT Analysis
60 Logivations : Geographic Presence
61 Microsoft, Inc.: Company Snapshot
62 Microsoft, Inc.: SWOT Analysis
63 Microsoft, Inc.: Geographic Presence
64 MetaTwin: Company Snapshot
65 MetaTwin: SWOT Analysis
66 MetaTwin: Geographic Presence
67 Other Companies: Company Snapshot
68 Other Companies: SWOT Analysis
69 Other Companies: Geographic Presence
The Global Digital Twin in Supply Chain Market has been studied from the year 2019 till 2028. However, the CAGR provided in the report is from the year 2023 to 2028. The research methodology involved three stages: Desk research, Primary research, and Analysis & Output from the entire research process.

The desk research involved a robust background study which meant referring to paid and unpaid databases to understand the market dynamics; mapping contracts from press releases; identifying the key players in the market, studying their product portfolio, competition level, annual reports/SEC filings & investor presentations; and learning the demand and supply-side analysis for the Digital Twin in Supply Chain Market.

The primary research activity included telephonic conversations with more than 50 tier 1 industry consultants, distributors, and end-use product manufacturers.

Finally, based on the above thorough research process, an in-depth analysis was carried out considering the following aspects: market attractiveness, current & future market trends, market share analysis, SWOT analysis of the company and customer analytics.

Frequently Asked Questions

This FREE sample includes market data points, ranging from trend analyses to market estimates & forecasts. See for yourself.
Or view our licence options:
Tailor made solutions just for you
80% of our clients seek made-to-order reports. How do you want us to tailor yours?
OUR CLIENTS


