This report was recently updated on August 11 2025 with the latest and most recent
market numbers
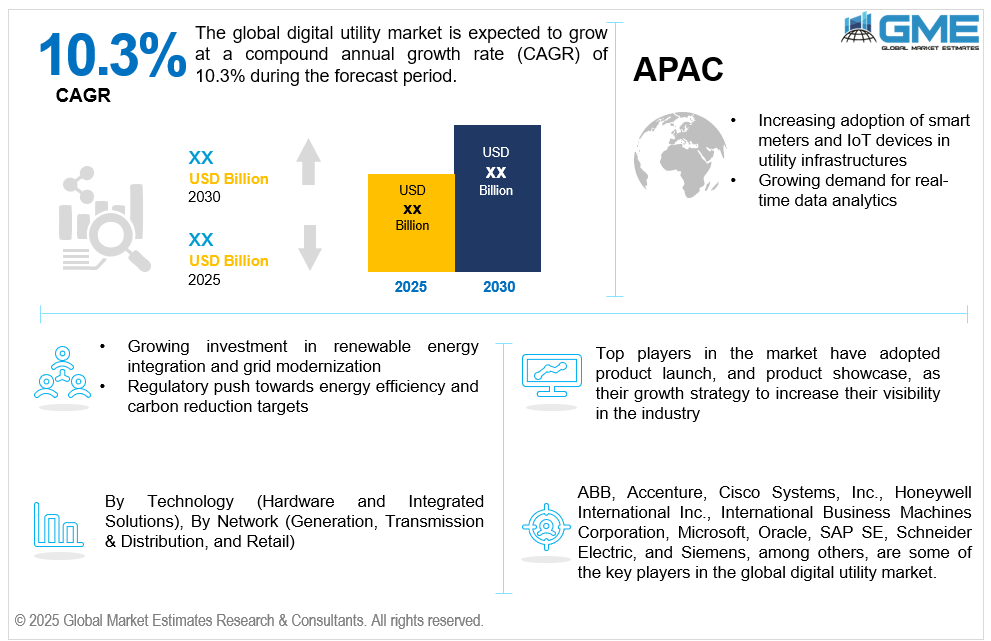
Global Digital Utility Market Size, Trends & Analysis - Forecasts to 2030 By Technology (Hardware and Integrated Solutions), By Network (Generation, Transmission & Distribution, and Retail), and By Region (North America, Asia Pacific, Central and South America, Europe, and Middle East and Africa), Competitive Landscape, Company Market Share Analysis, and End User Analysis
The global digital utility market is estimated to exhibit a CAGR of 10.3% from 2025 to 2030.
The primary factors propelling the market growth are the increasing adoption of smart meters and IoT devices in utility infrastructures and the growing demand for real-time data analytics. Smart meters and IoT technologies enable real-time monitoring, data collection, and remote control of utility assets, allowing utilities to enhance operational efficiency and customer service. Smart meters provide accurate, automated readings, reducing the need for manual interventions and minimizing billing errors. Meanwhile, IoT devices facilitate predictive maintenance, load forecasting, and efficient grid management by generating actionable insights from vast amounts of data. This shift supports the transition from traditional utilities to intelligent, data-driven systems. Moreover, the integration of these technologies enhances energy conservation efforts and enables demand-side management, contributing to sustainability goals. Governments and regulatory bodies worldwide are encouraging utilities to digitize their operations, further accelerating market growth. As utilities modernize their infrastructure to meet evolving energy demands and regulatory requirements, the demand for digital utility solutions powered by smart meters and IoT continues to rise.
The growing investment in renewable energy integration and grid modernization, along with the regulatory push towards energy efficiency and carbon reduction targets, is expected to support the market growth. As nations strive to meet ambitious carbon reduction targets, there's a concerted push to incorporate solar, wind, and other renewable sources into the energy mix. But because these energy sources are intermittent, sophisticated grid infrastructure that can monitor in real time and balance loads dynamically is required. This is where digital utility solutions come into play. Technologies like smart meters, advanced metering infrastructure (AMI), and automated grid management systems enable utilities to efficiently manage the complexities introduced by renewable energy sources. For instance, the European Commission's "Digitalization of Energy System" action plan includes a significant investment in smart grid technologies to facilitate renewable energy integration. Similarly, China's substantial investment in power grid modernization underscores the global commitment to enhancing grid resilience and accommodating renewable energy. These advancements not only support sustainability goals but also stimulate the digital utility market by creating demand for innovative solutions that ensure efficient and reliable energy distribution.
Expansion of smart cities and demand response initiatives, coupled with the integration of blockchain for secure energy transactions, propels market growth. To optimize public services, garbage disposal, water management, and energy utilization, smart cities mostly rely on digital infrastructure. Because they make it possible for real-time data monitoring, predictive analytics, and effective energy distribution, digital utility solutions are essential in this situation. Demand response programs—designed to adjust energy consumption during peak periods—are increasingly being adopted by utilities to enhance grid reliability and reduce energy costs. These initiatives require advanced digital platforms, smart meters, and IoT-enabled devices to communicate with end-users and automate consumption adjustments. Furthermore, smart city projects often integrate renewable energy sources, electric vehicle infrastructure, and microgrids, all of which depend on digital technologies for seamless operation. As urbanization accelerates and sustainability becomes a priority, utilities are compelled to adopt digital solutions, thereby fueling the growth of the digital utility market globally.
Digital twin technology offers a transformative opportunity for utilities to simulate real-world infrastructure performance, test scenarios, and make proactive decisions that reduce downtime, cut costs, and enhance long-term asset planning. Additionally, with end-users demanding more control over their energy usage, there's a growing opportunity to develop digital tools and mobile apps that promote energy awareness, support self-service, and boost customer satisfaction through personalized energy insights. However, market expansion is hampered by high initial investment costs and integration issues with legacy systems.
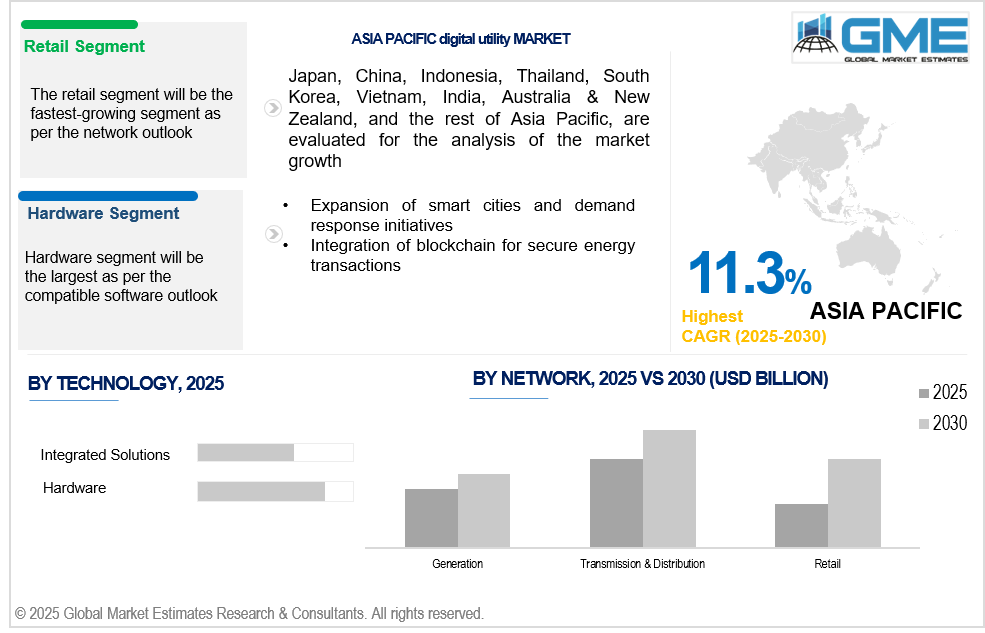
The hardware segment is expected to hold the largest share of the market over the forecast period. Automating power distribution requires hardware such as advanced distribution management systems (ADMS), remote terminal units (RTUs), and automatic reclosers. Their growing deployment in grid modernization projects strongly supports the leading position of the hardware segment.
The integrated solutions segment is expected to be the fastest-growing segment in the market from 2025 to 2030. Scaling across operations like energy generation, transmission, and customer service is possible with integrated platforms. This scalability allows utilities to grow digitally without overhauling existing systems, making integrated solutions an appealing and future-proof investment for rapid digital transformation.
The transmission & distribution segment is expected to hold the largest share of the market over the forecast period. Digital solutions for transmission and distribution (T&D) enable real-time grid monitoring, fault detection, and load balancing. As the demand for uninterrupted, efficient power supply grows, utilities increasingly rely on digital T&D systems, boosting their dominance in the global market.
The retail segment is anticipated to be the fastest-growing segment in the market from 2025 to 2030. Modern retail utility consumers are demanding clean energy options. Digital platforms allow retailers to offer green energy packages, carbon footprint tracking, and sustainability metrics, making them increasingly relevant and driving fast adoption in the environmentally conscious customer base.
North America is expected to be the largest region in the global market. North America is experiencing a surge in solar, wind, and battery storage projects. The need for real-time energy balancing and monitoring in decentralized grids drives investment in digital T&D and retail systems, reinforcing regional market leadership.
Asia Pacific is anticipated to witness rapid growth during the forecast period. Governments in Asia Pacific are actively promoting smart city projects, integrating digital utilities with urban infrastructure. Countries like China, India, and Japan are focusing on digitalizing their energy infrastructure to support sustainable growth, driving the digital utility market's growth in the region.
ABB, Accenture, Cisco Systems, Inc., Honeywell International Inc., International Business Machines Corporation, Microsoft, Oracle, SAP SE, Schneider Electric, and Siemens, among others, are some of the key players in the global digital utility market.
Please note: This is not an exhaustive list of companies profiled in the report.
In May 2024, A platform called Honeywell Forge Performance+ for Utilities was unveiled by Honeywell International Inc. with the goal of improving grid asset performance and utility operations. To monitor assets, find underlying issues, and employ predictive analytics for proactive grid management, this solution combines AI, machine learning, and digital twin capabilities.
In 2024 February, Siemens introduced Gridscale X, a software modularity tool to help utilities manage the energy transition. Gridscale X makes it possible to handle the complexity of distributed energy resources (DERs), scale grid capacity quickly, and increase grid flexibility.
REPORT CONTENT
1 STRATEGIC INSIGHTS ON NEW REVENUE POCKETS
1.1 Strategic Opportunity & Attractiveness Analysis
1.1.1 Hot Revenue Pockets
1.1.2 Market Attractiveness Score
1.1.3 Revenue Impacting Opportunity
1.1.4 High Growing Region/Country
1.1.5 Competitor Analysis
1.1.6 Consumer Analysis
1.2 Global Market Estimates' View
1.3 Strategic Insights across Business Functions
1.3.1 For Chief Executive Officers
1.3.2 For Chief Marketing Officers
1.3.3 For Chief Strategy Officers
1.4 Evaluate the Potential of your Existing Business Lines vs. New Lines to Enter Into
2.1 Technological Adoption Rate
2.2 Current Trend Impact Analysis
2.3 Future Trend Impact Analysis
3.1.2 Adjacent Market Opportunities
3.1.3 Ancillary Market Opportunities
3.2.1 Market Drivers: Impact Analysis
3.2.2 Market Restraints: Impact Analysis
3.2.3 Market Opportunities: Impact Analysis
3.2.4 Market Challenges: Impact Analysis
3.3.1 Porter’s Five Forces Analysis
3.3.1.1 Threat of New Entrants
3.3.1.2 Threat of New Substitutes
3.3.1.3 Bargaining Power of Suppliers
3.3.1.4 Bargaining Power of Buyers
3.3.1.5 Intensity of Competitive Rivalry
3.3.2 SWOT Analysis; By Factor (Political & Legal, Economic, and Technological)
4 GLOBAL DIGITAL UTILITY MARKET, BY Technology
4.2 Digital Utility Market: Technology Scope Key Takeaways
4.3 Revenue Growth Analysis, 2023 & 2029
4.4.1 Hardware Market Estimates and Forecast, 2021-2029 (USD Million)
4.5.1 Integrated Solutions Market Estimates and Forecast, 2021-2029 (USD Million)
5 GLOBAL DIGITAL UTILITY MARKET, BY NETWORK
5.2 Digital Utility Market: Network Scope Key Takeaways
5.3 Revenue Growth Analysis, 2023 & 2029
5.4.1 Generation Market Estimates and Forecast, 2021-2029 (USD Million)
5.5 Transmission & Distribution
5.5.1 Transmission & Distribution Market Estimates and Forecast, 2021-2029 (USD Million)
5.6.1 Retail Market Estimates and Forecast, 2021-2029 (USD Million)
6 GLOBAL DIGITAL UTILITY MARKET, BY REGION
6.2 North America Digital Utility Market Estimates and Forecast, 2021-2029 (USD Million)
6.2.3.1 U.S. Digital Utility Market Estimates and Forecast, 2021-2029 (USD Million)
6.2.3.2 Canada Digital Utility Market Estimates and Forecast, 2021-2029 (USD Million)
6.2.3.3 Mexico Digital Utility Market Estimates and Forecast, 2021-2029 (USD Million)
6.3 Europe Digital Utility Market Estimates and Forecast, 2021-2029 (USD Million)
6.3.3.1 Germany Digital Utility Market Estimates and Forecast, 2021-2029 (USD Million)
6.3.3.2 U.K. Digital Utility Market Estimates and Forecast, 2021-2029 (USD Million)
6.3.3.3 France Digital Utility Market Estimates and Forecast, 2021-2029 (USD Million)
6.3.3.4 Italy Digital Utility Market Estimates and Forecast, 2021-2029 (USD Million)
6.3.3.5 Spain Digital Utility Market Estimates and Forecast, 2021-2029 (USD Million)
6.3.3.6 Netherlands Digital Utility Market Estimates and Forecast, 2021-2029 (USD Million)
6.3.3.7 Rest of Europe Digital Utility Market Estimates and Forecast, 2021-2029 (USD Million)
6.4 Asia Pacific Digital Utility Market Estimates and Forecast, 2021-2029 (USD Million)
6.4.3.1 China Digital Utility Market Estimates and Forecast, 2021-2029 (USD Million)
6.4.3.2 Japan Digital Utility Market Estimates and Forecast, 2021-2029 (USD Million)
6.4.3.3 India Digital Utility Market Estimates and Forecast, 2021-2029 (USD Million)
6.4.3.4 South Korea Digital Utility Market Estimates and Forecast, 2021-2029 (USD Million)
6.4.3.5 Singapore Digital Utility Market Estimates and Forecast, 2021-2029 (USD Million)
6.4.3.6 Malaysia Digital Utility Market Estimates and Forecast, 2021-2029 (USD Million)
6.4.3.7 Thailand Digital Utility Market Estimates and Forecast, 2021-2029 (USD Million)
6.4.3.8 Indonesia Digital Utility Market Estimates and Forecast, 2021-2029 (USD Million)
6.4.3.9 Vietnam Digital Utility Market Estimates and Forecast, 2021-2029 (USD Million)
6.4.3.10 Taiwan Digital Utility Market Estimates and Forecast, 2021-2029 (USD Million)
6.4.3.11 Rest of Asia Pacific Digital Utility Market Estimates and Forecast, 2021-2029 (USD Million)
6.5 Middle East and Africa Digital Utility Market Estimates and Forecast, 2021-2029 (USD Million)
6.5.3.1 Saudi Arabia Digital Utility Market Estimates and Forecast, 2021-2029 (USD Million)
6.5.3.2 U.A.E. Digital Utility Market Estimates and Forecast, 2021-2029 (USD Million)
6.5.3.3 Israel Digital Utility Market Estimates and Forecast, 2021-2029 (USD Million)
6.5.3.4 South Africa Digital Utility Market Estimates and Forecast, 2021-2029 (USD Million)
6.6 Central and South America Digital Utility Market Estimates and Forecast, 2021-2029 (USD Million)
6.6.3.1 Brazil Digital Utility Market Estimates and Forecast, 2021-2029 (USD Million)
6.6.3.2 Argentina Digital Utility Market Estimates and Forecast, 2021-2029 (USD Million)
6.6.3.3 Chile Digital Utility Market Estimates and Forecast, 2021-2029 (USD Million)
7.1 Company Market Share Analysis
7.2 Four Quadrant Positioning Matrix
7.4.1.1 Business Description & Financial Analysis
7.4.1.3 Products & Services Offered
7.4.1.4 Strategic Alliances between Business Partners
7.4.2.1 Business Description & Financial Analysis
7.4.2.3 Products & Services Offered
7.4.2.4 Strategic Alliances between Business Partners
7.4.3.1 Business Description & Financial Analysis
7.4.3.3 Products & Services Offered
7.4.3.4 Strategic Alliances between Business Partners
7.4.4 Honeywell International Inc.
7.4.4.1 Business Description & Financial Analysis
7.4.4.3 Products & Services Offered
7.4.4.4 Strategic Alliances between Business Partners
7.4.5 International Business Machines Corporation
7.4.5.1 Business Description & Financial Analysis
7.4.5.3 Products & Services Offered
7.4.5.4 Strategic Alliances between Business Partners
7.4.6.1 Business Description & Financial Analysis
7.4.6.3 Products & Services Offered
7.4.6.4 Strategic Alliances between Business Partners
7.4.7.1 Business Description & Financial Analysis
7.4.7.3 Products & Services Offered
7.4.7.4 Strategic Alliances between Business Partners
7.4.8.1 Business Description & Financial Analysis
7.4.8.3 Products & Services Offered
7.4.8.4 Strategic Alliances between Business Partners
7.4.9.1 Business Description & Financial Analysis
7.4.9.3 Products & Services Offered
7.4.9.4 Strategic Alliances between Business Partners
7.4.10.1 Business Description & Financial Analysis
7.4.10.3 Products & Services Offered
7.4.10.4 Strategic Alliances between Business Partners
7.4.11.1 Business Description & Financial Analysis
7.4.11.3 Products & Services Offered
7.4.11.4 Strategic Alliances between Business Partners
8.1.2 Market Scope & Segmentation
8.2.1.2 GMEs Internal Data Repository
8.2.1.3 Secondary Resources & Third Party Perspectives
8.2.1.4 Company Information Sources
8.2.2.1 Various Type of Respondents for Primary Interviews
8.2.2.2 Number of Interviews Conducted throughout the Research Process
8.2.2.4 Discussion Guide for Primary Participants
8.2.3.1 Expert Panels Across 30+ Industry
8.2.4.1 Paid Local Experts Across 30+ Industry Across each Region
8.3.1.1 Macro-Economic Indicators Considered
8.3.1.2 Micro-Economic Indicators Considered
8.3.2.1 Company Share Analysis Approach
8.3.2.2 Estimation of Potential Product Sales
8.4.2 Time Series, Cross Sectional & Panel Data Analysis
8.5.1 Inhouse AI Based Real Time Analytics Tool
8.5.2 Output From Desk & Primary Research
8.6 Research Assumptions & Limitations
LIST OF TABLES
1 Global Digital Utility Market, By Technology, 2021-2029 (USD Million)
2 Hardware Market, By Region, 2021-2029 (USD Million)
3 Integrated Solutions Market, By Region, 2021-2029 (USD Million)
4 Global Digital Utility Market, By Network, 2021-2029 (USD Million)
5 Generation Market, By Region, 2021-2029 (USD Million)
6 Transmission & Distribution Market, By Region, 2021-2029 (USD Million)
7 Retail Market, By Region, 2021-2029 (USD Million)
8 Regional Analysis, 2021-2029 (USD Million)
9 North America Digital Utility Market, By Technology, 2021-2029 (USD Million)
10 North America Digital Utility Market, By Network, 2021-2029 (USD Million)
11 North America Digital Utility Market, By COUNTRY, 2021-2029 (USD Million)
12 U.S. Digital Utility Market, By Technology, 2021-2029 (USD Million)
13 U.S. Digital Utility Market, By Network, 2021-2029 (USD Million)
14 Canada Digital Utility Market, By Technology, 2021-2029 (USD Million)
15 Canada Digital Utility Market, By Network, 2021-2029 (USD Million)
16 Mexico Digital Utility Market, By Technology, 2021-2029 (USD Million)
17 Mexico Digital Utility Market, By Network, 2021-2029 (USD Million)
18 Europe Digital Utility Market, By Technology, 2021-2029 (USD Million)
19 Europe Digital Utility Market, By Network, 2021-2029 (USD Million)
20 EUROPE Digital Utility Market, By COUNTRY, 2021-2029 (USD Million)
21 Germany Digital Utility Market, By Technology, 2021-2029 (USD Million)
22 Germany Digital Utility Market, By Network, 2021-2029 (USD Million)
23 U.K. Digital Utility Market, By Technology, 2021-2029 (USD Million)
24 U.K. Digital Utility Market, By Network, 2021-2029 (USD Million)
25 France Digital Utility Market, By Technology, 2021-2029 (USD Million)
26 France Digital Utility Market, By Network, 2021-2029 (USD Million)
27 Italy Digital Utility Market, By Technology, 2021-2029 (USD Million)
28 Italy Digital Utility Market, By Network, 2021-2029 (USD Million)
29 Spain Digital Utility Market, By Technology, 2021-2029 (USD Million)
30 Spain Digital Utility Market, By Network, 2021-2029 (USD Million)
31 Netherlands Digital Utility Market, By Technology, 2021-2029 (USD Million)
32 Netherlands Digital Utility Market, By Network, 2021-2029 (USD Million)
33 Rest Of Europe Digital Utility Market, By Technology, 2021-2029 (USD Million)
34 Rest Of Europe Digital Utility Market, By Network, 2021-2029 (USD Million)
35 Asia Pacific Digital Utility Market, By Technology, 2021-2029 (USD Million)
36 Asia Pacific Digital Utility Market, By Network, 2021-2029 (USD Million)
37 ASIA PACIFIC Digital Utility Market, By COUNTRY, 2021-2029 (USD Million)
38 China Digital Utility Market, By Technology, 2021-2029 (USD Million)
39 China Digital Utility Market, By Network, 2021-2029 (USD Million)
40 Japan Digital Utility Market, By Technology, 2021-2029 (USD Million)
41 Japan Digital Utility Market, By Network, 2021-2029 (USD Million)
42 India Digital Utility Market, By Technology, 2021-2029 (USD Million)
43 India Digital Utility Market, By Network, 2021-2029 (USD Million)
44 South Korea Digital Utility Market, By Technology, 2021-2029 (USD Million)
45 South Korea Digital Utility Market, By Network, 2021-2029 (USD Million)
46 Singapore Digital Utility Market, By Technology, 2021-2029 (USD Million)
47 Singapore Digital Utility Market, By Network, 2021-2029 (USD Million)
48 Thailand Digital Utility Market, By Technology, 2021-2029 (USD Million)
49 Thailand Digital Utility Market, By Network, 2021-2029 (USD Million)
50 Malaysia Digital Utility Market, By Technology, 2021-2029 (USD Million)
51 Malaysia Digital Utility Market, By Network, 2021-2029 (USD Million)
52 Indonesia Digital Utility Market, By Technology, 2021-2029 (USD Million)
53 Indonesia Digital Utility Market, By Network, 2021-2029 (USD Million)
54 Vietnam Digital Utility Market, By Technology, 2021-2029 (USD Million)
55 Vietnam Digital Utility Market, By Network, 2021-2029 (USD Million)
56 Taiwan Digital Utility Market, By Technology, 2021-2029 (USD Million)
57 Taiwan Digital Utility Market, By Network, 2021-2029 (USD Million)
58 Rest of APAC Digital Utility Market, By Technology, 2021-2029 (USD Million)
59 Rest of APAC Digital Utility Market, By Network, 2021-2029 (USD Million)
60 Middle East and Africa Digital Utility Market, By Technology, 2021-2029 (USD Million)
61 Middle East and Africa Digital Utility Market, By Network, 2021-2029 (USD Million)
62 MIDDLE EAST & AFRICA Digital Utility Market, By COUNTRY, 2021-2029 (USD Million)
63 Saudi Arabia Digital Utility Market, By Technology, 2021-2029 (USD Million)
64 Saudi Arabia Digital Utility Market, By Network, 2021-2029 (USD Million)
65 UAE Digital Utility Market, By Technology, 2021-2029 (USD Million)
66 UAE Digital Utility Market, By Network, 2021-2029 (USD Million)
67 Israel Digital Utility Market, By Technology, 2021-2029 (USD Million)
68 Israel Digital Utility Market, By Network, 2021-2029 (USD Million)
69 South Africa Digital Utility Market, By Technology, 2021-2029 (USD Million)
70 South Africa Digital Utility Market, By Network, 2021-2029 (USD Million)
71 Rest Of Middle East and Africa Digital Utility Market, By Technology, 2021-2029 (USD Million)
72 Rest Of Middle East and Africa Digital Utility Market, By Network, 2021-2029 (USD Million)
73 Central and South America Digital Utility Market, By Technology, 2021-2029 (USD Million)
74 Central and South America Digital Utility Market, By Network, 2021-2029 (USD Million)
75 CENTRAL AND SOUTH AMERICA Digital Utility Market, By COUNTRY, 2021-2029 (USD Million)
76 Brazil Digital Utility Market, By Technology, 2021-2029 (USD Million)
77 Brazil Digital Utility Market, By Network, 2021-2029 (USD Million)
78 Chile Digital Utility Market, By Technology, 2021-2029 (USD Million)
79 Chile Digital Utility Market, By Network, 2021-2029 (USD Million)
80 Argentina Digital Utility Market, By Technology, 2021-2029 (USD Million)
81 Argentina Digital Utility Market, By Network, 2021-2029 (USD Million)
82 Rest Of Central and South America Digital Utility Market, By Technology, 2021-2029 (USD Million)
83 Rest Of Central and South America Digital Utility Market, By Network, 2021-2029 (USD Million)
84 ABB: Products & Services Offering
85 Accenture: Products & Services Offering
86 Cisco Systems, Inc.: Products & Services Offering
87 Honeywell International Inc.: Products & Services Offering
88 International Business Machines Corporation: Products & Services Offering
89 MICROSOFT: Products & Services Offering
90 Oracle: Products & Services Offering
91 SAP SE: Products & Services Offering
92 Schneider Electric, Inc: Products & Services Offering
93 Siemens: Products & Services Offering
94 Other Companies: Products & Services Offering
LIST OF FIGURES
1 Global Digital Utility Market Overview
2 Global Digital Utility Market Value From 2021-2029 (USD Million)
3 Global Digital Utility Market Share, By Technology (2023)
4 Global Digital Utility Market Share, By Network (2023)
5 Global Digital Utility Market, By Region (Asia Pacific Market)
6 Technological Trends In Global Digital Utility Market
7 Four Quadrant Competitor Positioning Matrix
8 Impact Of Macro & Micro Indicators On The Market
9 Impact Of Key Drivers On The Global Digital Utility Market
10 Impact Of Challenges On The Global Digital Utility Market
11 Porter’s Five Forces Analysis
12 Global Digital Utility Market: By Technology Scope Key Takeaways
13 Global Digital Utility Market, By Technology Segment: Revenue Growth Analysis
14 Hardware Market, By Region, 2021-2029 (USD Million)
15 Integrated Solutions Market, By Region, 2021-2029 (USD Million)
16 Global Digital Utility Market: By Network Scope Key Takeaways
17 Global Digital Utility Market, By Network Segment: Revenue Growth Analysis
18 Generation Market, By Region, 2021-2029 (USD Million)
19 Transmission & Distribution Market, By Region, 2021-2029 (USD Million)
20 Retail Market, By Region, 2021-2029 (USD Million)
21 Regional Segment: Revenue Growth Analysis
22 Global Digital Utility Market: Regional Analysis
23 North America Digital Utility Market Overview
24 North America Digital Utility Market, By Technology
25 North America Digital Utility Market, By Network
26 North America Digital Utility Market, By Country
27 U.S. Digital Utility Market, By Technology
28 U.S. Digital Utility Market, By Network
29 Canada Digital Utility Market, By Technology
30 Canada Digital Utility Market, By Network
31 Mexico Digital Utility Market, By Technology
32 Mexico Digital Utility Market, By Network
33 Four Quadrant Positioning Matrix
34 Company Market Share Analysis
35 ABB: Company Snapshot
36 ABB: SWOT Analysis
37 ABB: Geographic Presence
38 Accenture: Company Snapshot
39 Accenture: SWOT Analysis
40 Accenture: Geographic Presence
41 Cisco Systems, Inc.: Company Snapshot
42 Cisco Systems, Inc.: SWOT Analysis
43 Cisco Systems, Inc.: Geographic Presence
44 Honeywell International Inc.: Company Snapshot
45 Honeywell International Inc.: Swot Analysis
46 Honeywell International Inc.: Geographic Presence
47 International Business Machines Corporation: Company Snapshot
48 International Business Machines Corporation: SWOT Analysis
49 International Business Machines Corporation: Geographic Presence
50 MICROSOFT: Company Snapshot
51 MICROSOFT: SWOT Analysis
52 MICROSOFT: Geographic Presence
53 Oracle : Company Snapshot
54 Oracle : SWOT Analysis
55 Oracle : Geographic Presence
56 SAP SE: Company Snapshot
57 SAP SE: SWOT Analysis
58 SAP SE: Geographic Presence
59 Schneider Electric, Inc.: Company Snapshot
60 Schneider Electric, Inc.: SWOT Analysis
61 Schneider Electric, Inc.: Geographic Presence
62 Siemens: Company Snapshot
63 Siemens: SWOT Analysis
64 Siemens: Geographic Presence
65 Other Companies: Company Snapshot
66 Other Companies: SWOT Analysis
67 Other Companies: Geographic Presence
The Global Digital Utility Market has been studied from the year 2019 till 2030. However, the CAGR provided in the report is from the year 2025 to 2030. The research methodology involved three stages: Desk research, Primary research, and Analysis & Output from the entire research process.

The desk research involved a robust background study which meant referring to paid and unpaid databases to understand the market dynamics; mapping contracts from press releases; identifying the key players in the market, studying their product portfolio, competition level, annual reports/SEC filings & investor presentations; and learning the demand and supply-side analysis for the Digital Utility Market.

The primary research activity included telephonic conversations with more than 50 tier 1 industry consultants, distributors, and end-use product manufacturers.

Finally, based on the above thorough research process, an in-depth analysis was carried out considering the following aspects: market attractiveness, current & future market trends, market share analysis, SWOT analysis of the company and customer analytics.

Frequently Asked Questions

This FREE sample includes market data points, ranging from trend analyses to market estimates & forecasts. See for yourself.
Or view our licence options:
Tailor made solutions just for you
80% of our clients seek made-to-order reports. How do you want us to tailor yours?
OUR CLIENTS


