This report was recently updated on August 20 2025 with the latest and most recent
market numbers
Global Dual and Multi Energy Computed Tomography Market Size, Trends & Analysis - Forecasts to 2028 By Type (Prospective and Retrospective), By End-use (Hospitals, Diagnostic Imaging Centers, and Ambulatory Imaging Centers), By Application (Oncology, Neurology, Cardiology, Vascular, Musculoskeletal, and Others), and By Region (North America, Asia Pacific, Central and South America, Europe, and Middle East and Africa), Competitive Landscape, Company Market Share Analysis, and End User Analysis
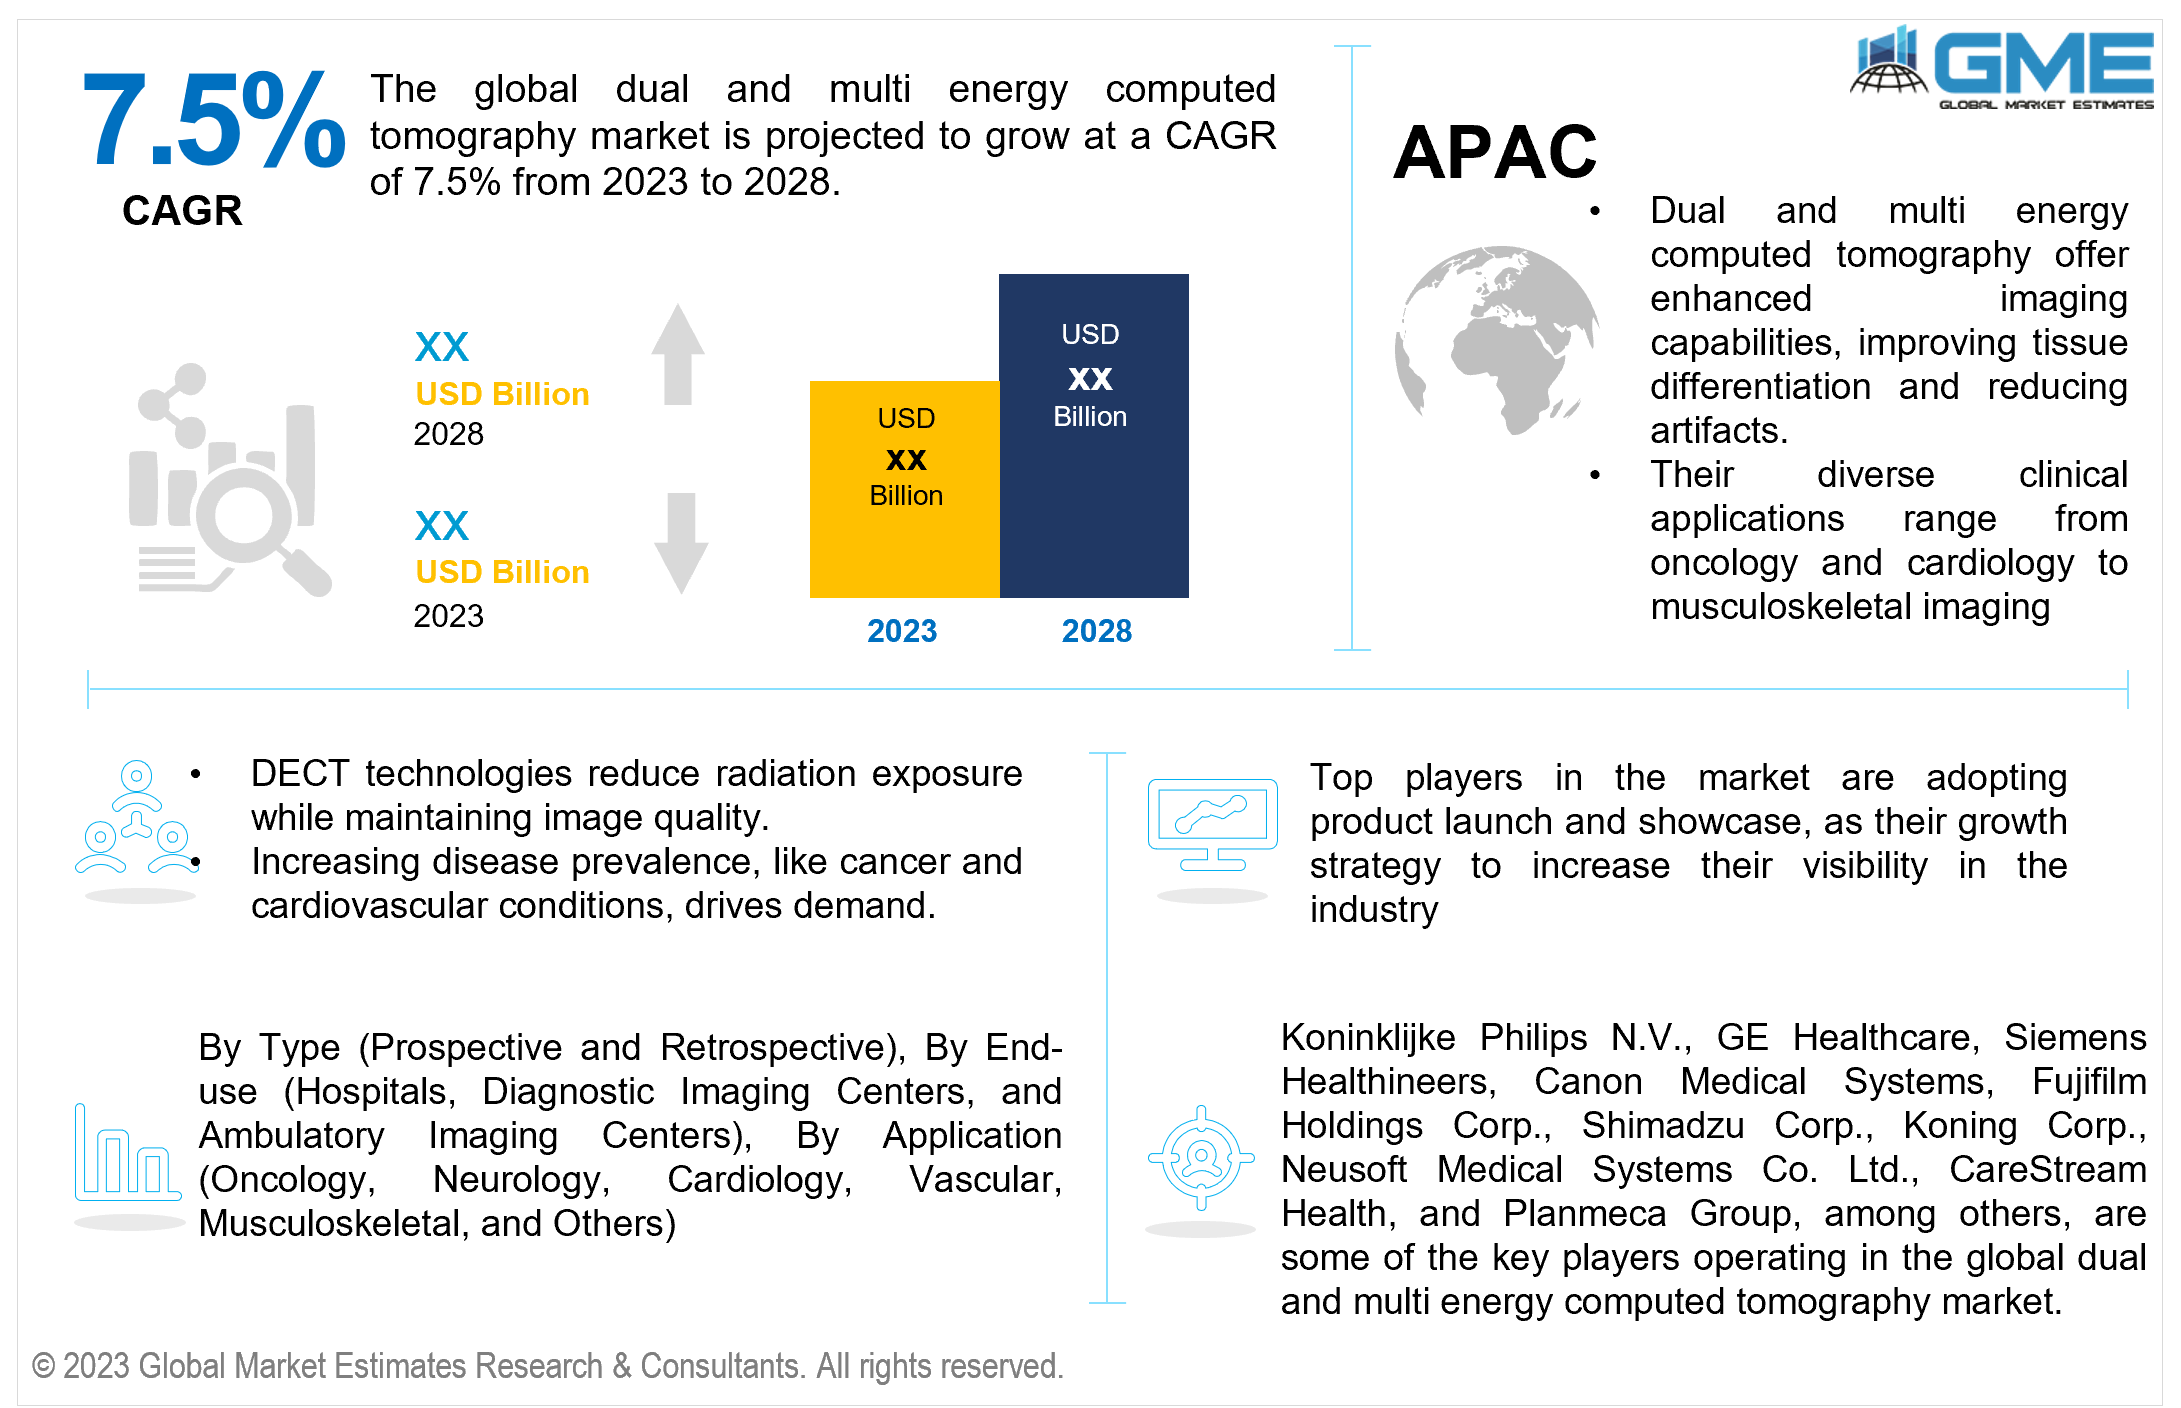
The global dual and multi energy computed tomography market is projected to grow at a CAGR of 7.5% from 2023 to 2028.
Dual and multi energy computed tomography offer enhanced imaging capabilities, including improved tissue differentiation, reduced artifacts, and better contrast resolution. These features are valuable in diagnosing a wide range of medical conditions. Its technology has diverse clinical applications, from oncology and cardiology to musculoskeletal imaging. They are used for material differentiation, vascular imaging, and quantifying tissue properties like iodine concentration.
Increasing prevalence of diseases like cancer, cardiovascular conditions, and kidney stones drives the demand for advanced imaging techniques. With an aging population, the incidence of age-related diseases and conditions that require diagnostic imaging is on the rise.
As per the National Institutes of Health (NIH) data, individuals aged 65 and older undergo diagnostic imaging at a rate that is two to three times higher than that of younger individuals.
Moreover, there has been a growing adoption of Dual-energy CT (DECT) in diagnostic imaging, this increased usage can be attributed primarily to DECT's ability to lower the effective radiation dose and reduce the need for intravenous contrast when compared to conventional CT scans.
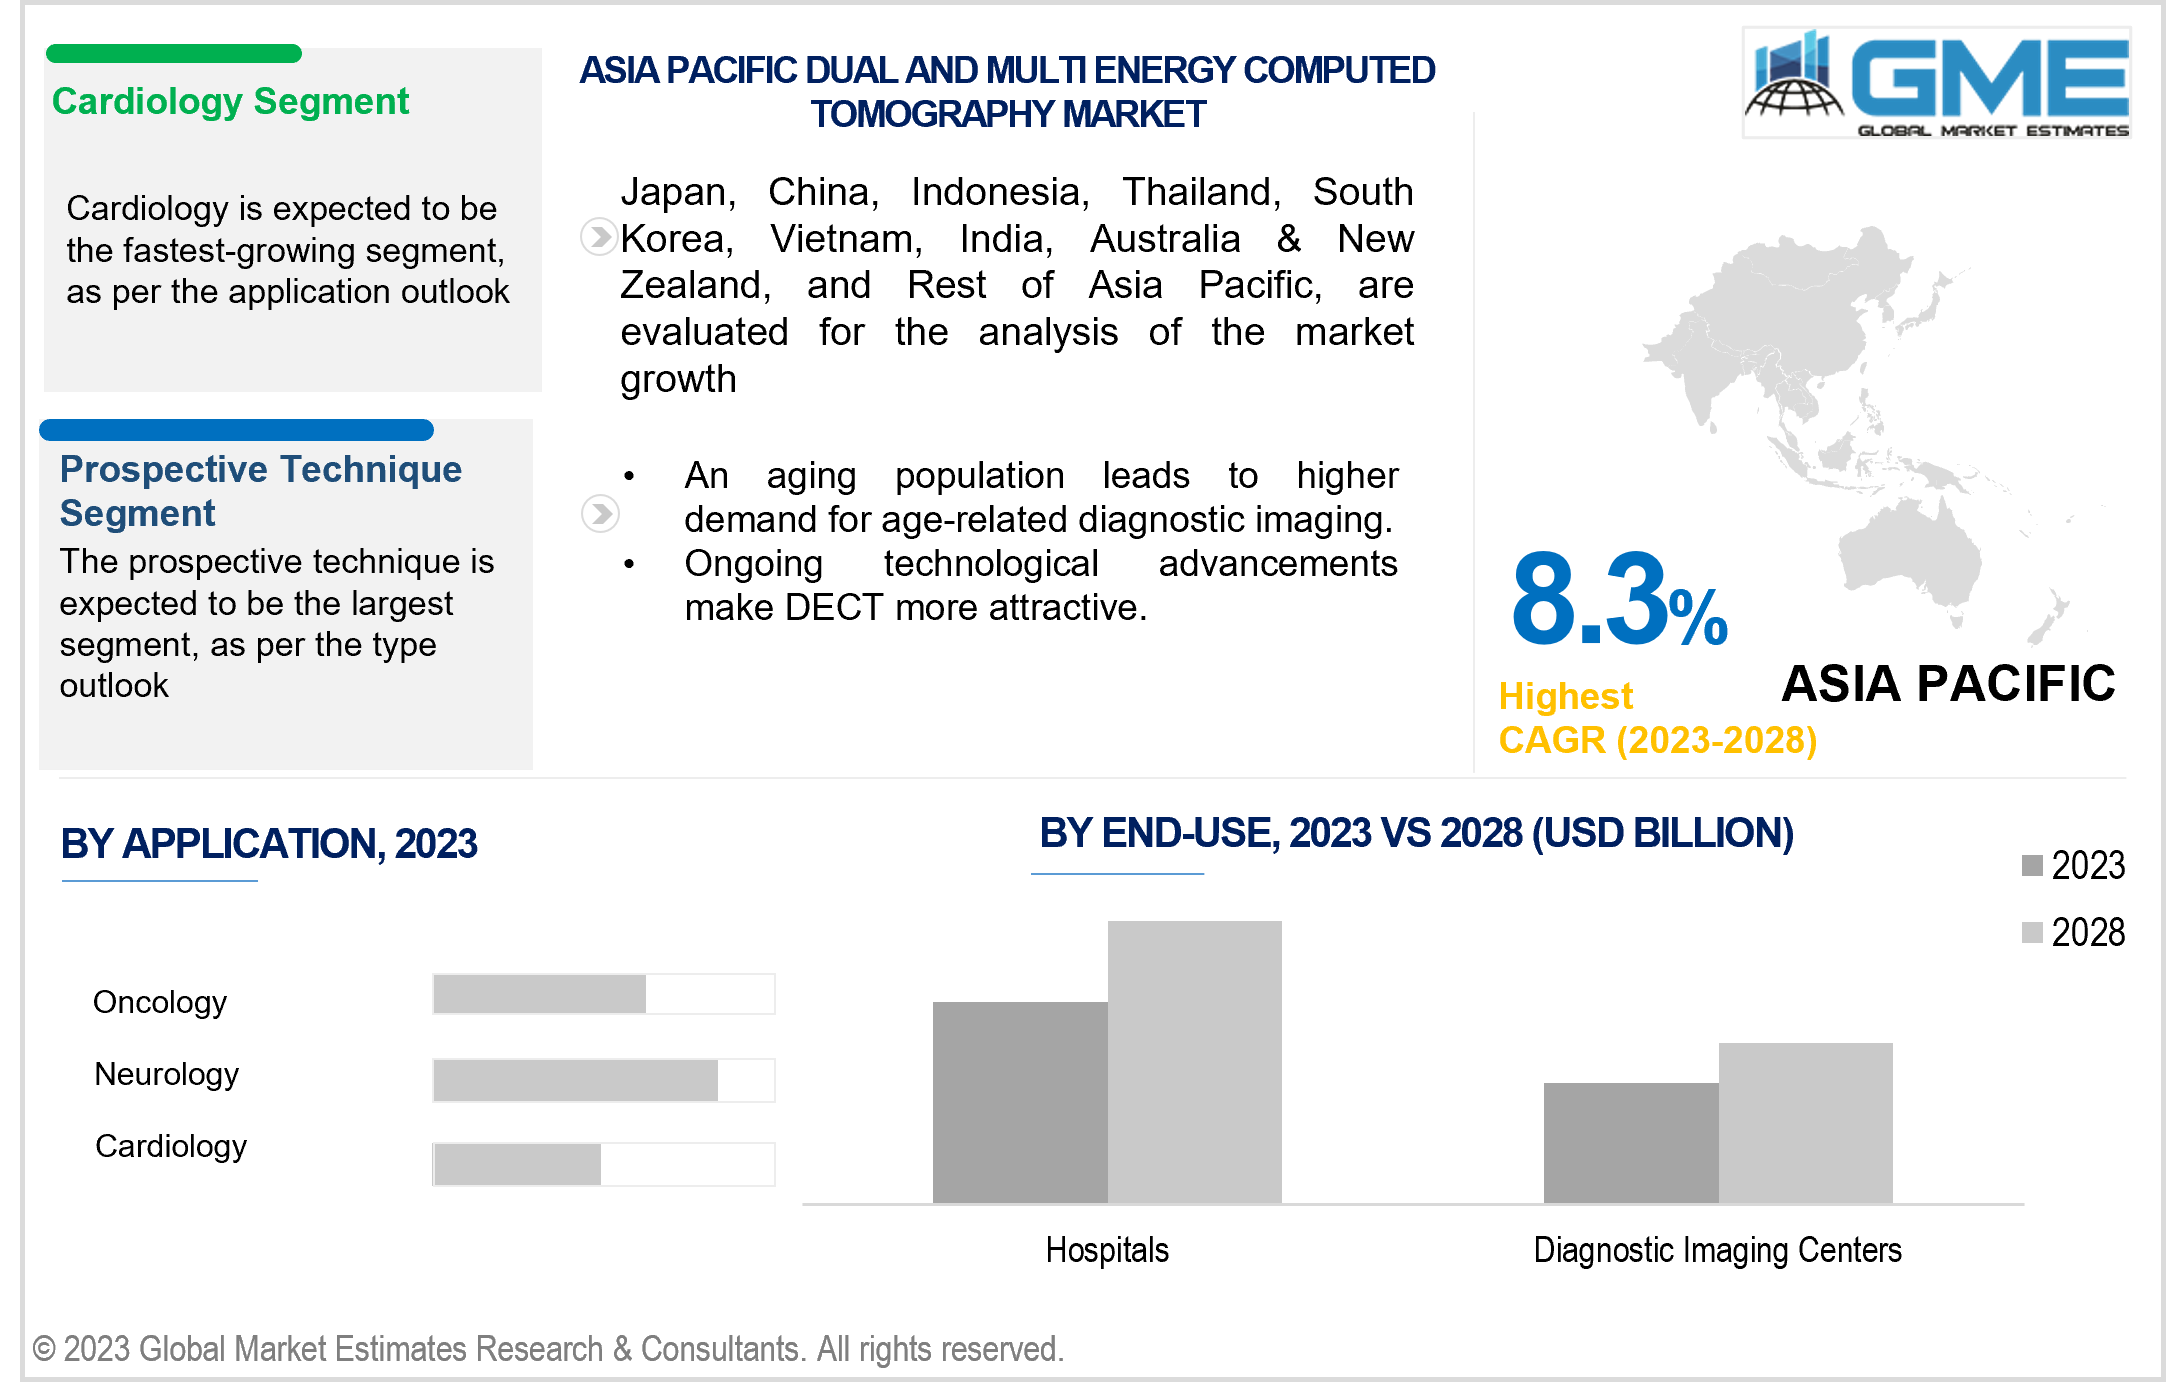
Prospective segment is expected to hold the largest share in the market. Prospective techniques offer high diagnostic accuracy, allowing for improved patient care. In medical settings where accuracy and precision are paramount, these techniques may be the preferred choice. It also provides quicker imaging results compared to retrospective techniques. In scenarios where time is critical, such as trauma cases or emergency medical situations, rapid imaging can be a deciding factor.
Retrospective segment is expected to be the fastest-growing segment in the market from 2023-2028, owing to its convenience and flexibility. Unlike the prospective technique, it doesn't require prior selection, offering a complete field view and excellent temporal resolution, making it increasingly popular for various diagnostic applications, thereby driving its market growth.
Cardiology is anticipated to be the fastest-growing segment in the market from 2023-2028. This is attributed to the changing lifestyle and increasing heart related diseases such as high blood pressure, high cholesterol. According to World Health Organization in 2019, approximately 17.9 million individuals worldwide lost their lives to cardiovascular diseases (CVDs), accounting for around 32% of the total global mortality. Dual and multi energy computed tomography are valuable for cardiac imaging, including coronary artery assessment, calcium scoring, and the evaluation of cardiac anatomy and function.
Oncology segment is expected to hold the largest share of the market. The growth of the oncology segment is expected to be fuelled by several factors such as, the increasing prevalence of cancer worldwide is driving the demand for CT scans, which are vital in diagnosing various types of cancers, including the detection of lumps and tumors. According to WHO Cancer is a leading contributor to global death rate, causing nearly 10 million fatalities in 2020, which is equivalent to roughly one out of every six deaths.
The diagnostic imaging centers segment is anticipated to be the fastest-growing segment in the market from 2023-2028. The increasing elderly population and the widespread occurrence of chronic illnesses are driving a greater need for diagnostic imaging services. Diagnostic imaging centers specialize in providing efficient and comprehensive diagnostics, addressing this growing need. In the United States, chronic diseases like heart disease, cancer, and diabetes are the main causes of death and health-related deaths.
The hospital segment holds the largest share of the market. CT scans are recognized as a highly effective tool for precise diagnosis both before and after surgical procedures, aiding in the assessment of treatment effectiveness. Consequently, research within this hospital sector presents significant opportunities, which in turn impact the market share of research institutions.
North America is expected to be the largest region in the market. The primary reasons boosting the market growth in this region include highly skilled medical workforce, increased government healthcare spending, a rising incidence of cancer, and a higher obesity rate compared to other countries. According to National Center for Chronic Disease Prevention, between 1999-2000 and March 2017-2020, obesity rates in the United States rose significantly, going from 30.5% to 41.9%. Concurrently, the prevalence of severe obesity also saw an increase, climbing from 4.7% to 9.2%.
Asia Pacific is predicted to witness rapid growth during the forecast period. This can be attributed to several factors, including heightened research efforts aimed at developing new imaging systems, increased government healthcare investments, and a substantial demand for advanced imaging devices.
Koninklijke Philips N.V., GE Healthcare, Siemens Healthineers, Canon Medical Systems, Fujifilm Holdings Corp., Shimadzu Corp., Koning Corp., Neusoft Medical Systems Co. Ltd., CareStream Health, and Planmeca Group, among others, are some of the key players operating in the global dual and multi energy computed tomography market.
Please note: This is not an exhaustive list of companies profiled in the report.
In May 2023, Philips introduced new AI- driven CT system, the Philips CT 3500. The new system is specifically created to fulfill the needs of regular radiology procedures and screening programs with high patient volume.
1 STRATEGIC INSIGHTS ON NEW REVENUE POCKETS
1.1 Strategic Opportunity & Attractiveness Analysis
1.1.1 Hot Revenue Pockets
1.1.2 Market Attractiveness Score
1.1.3 Revenue Impacting Opportunity
1.1.4 High Growing Region/Country
1.1.5 Competitor Analysis
1.1.6 Consumer Analysis
1.2 Global Market Estimates' View
1.3 Strategic Insights across Business Functions
1.3.1 For Chief Executive Officers
1.3.2 For Chief Marketing Officers
1.3.3 For Chief Strategy Officers
1.4 Evaluate the Potential of your Existing Business Lines vs. New Lines to Enter Into
2 TECHNOLOGICAL TRENDS
2.1 Technological Adoption Rate
2.2 Current Trend Impact Analysis
2.3 Future Trend Impact Analysis
3 GLOBAL DUAL AND MULTI ENERGY COMPUTED TOMOGRAPHY MARKET OUTLOOK
3.1 Market Pyramid Analysis
3.1.1 Introduction
3.1.2 Adjacent Market Opportunities
3.1.3 Ancillary Market Opportunities
3.2 Demand Side Analysis
3.2.1 Market Drivers: Impact Analysis
3.2.2 Market Restraints: Impact Analysis
3.2.3 Market Opportunities: Impact Analysis
3.2.4 Market Challenges: Impact Analysis
3.3 Supply Side Analysis
3.3.1 Porter’s Five Forces Analysis
3.3.1.1 Threat of New Entrants
3.3.1.2 Threat of New Substitutes
3.3.1.3 Bargaining Power of Suppliers
3.3.1.4 Bargaining Power of Buyers
3.3.1.5 Intensity of Competitive Rivalry
3.3.2 SWOT Analysis; By Factor (Political & Legal, Economic, and Technological)
3.3.2.1 Political Landscape
3.3.2.2 Economic Landscape
3.3.2.3 Social Landscape
3.3.2.4 Technology Landscape
3.3.3 Value Chain Analysis
3.3.4 Trend Analysis
3.3.5 Gap Analysis
3.3.6 Cost Analysis
4 GLOBAL DUAL AND MULTI ENERGY COMPUTED TOMOGRAPHY MARKET, BY APPLICATION
4.1 Introduction
4.2 Dual And Multi Energy Computed Tomography Market: Application Scope Key Takeaways
4.3 Revenue Growth Analysis, 2022 & 2028
4.4 Oncology
4.4.1 Oncology Market Estimates and Forecast, 2020-2028 (USD Million)
4.5 Neurology
4.5.1 Neurology Market Estimates and Forecast, 2020-2028 (USD Million)
4.6 Cardiology
4.6.1 Cardiology Market Estimates and Forecast, 2020-2028 (USD Million)
4.7 Vascular
4.7.1 Vascular Market Estimates and Forecast, 2020-2028 (USD Million)
4.8 Musculoskeletal
4.8.1 Musculoskeletal Market Estimates and Forecast, 2020-2028 (USD Million)
4.9 Others
4.9.1 Others Market Estimates and Forecast, 2020-2028 (USD Million)
5 GLOBAL DUAL AND MULTI ENERGY COMPUTED TOMOGRAPHY MARKET, BY END-USE
5.1 Introduction
5.2 Dual And Multi Energy Computed Tomography Market: End-use Scope Key Takeaways
5.3 Revenue Growth Analysis, 2022 & 2028
5.4 Hospitals
5.4.1 Hospitals Market Estimates and Forecast, 2020-2028 (USD Million)
5.5 Diagnostic Imaging Centers
5.5.1 Diagnostic Imaging Centers Market Estimates and Forecast, 2020-2028 (USD Million)
5.6 Ambulatory Imaging Centers
5.6.1 Ambulatory Imaging Centers Market Estimates and Forecast, 2020-2028 (USD Million)
6 GLOBAL DUAL AND MULTI ENERGY COMPUTED TOMOGRAPHY MARKET, BY TYPE
6.1 Introduction
6.2 Dual And Multi Energy Computed Tomography Market: Type Scope Key Takeaways
6.3 Revenue Growth Analysis, 2022 & 2028
6.4 Prospective
6.4.1 Prospective Market Estimates and Forecast, 2020-2028 (USD Million)
6.5 Retrospective
6.5.1 Retrospective Market Estimates and Forecast, 2020-2028 (USD Million)
7 GLOBAL DUAL AND MULTI ENERGY COMPUTED TOMOGRAPHY MARKET, BY REGION
7.1 Introduction
7.2 North America Dual And Multi Energy Computed Tomography Market Estimates and Forecast, 2020-2028 (USD Million)
7.2.1 By Application
7.2.2 By End-use
7.2.3 By Type
7.2.4 By Country
7.2.4.1 U.S. Dual And Multi Energy Computed Tomography Market Estimates and Forecast, 2020-2028 (USD Million)
7.2.4.1.1 By Application
7.2.4.1.2 By End-use
7.2.4.1.3 By Type
7.2.4.2 Canada Dual And Multi Energy Computed Tomography Market Estimates and Forecast, 2020-2028 (USD Million)
7.2.4.2.1 By Application
7.2.4.2.2 By End-use
7.2.4.2.3 By Type
7.2.4.3 Mexico Dual And Multi Energy Computed Tomography Market Estimates and Forecast, 2020-2028 (USD Million)
7.2.4.3.1 By Application
7.2.4.3.2 By End-use
7.2.4.3.3 By Type
7.3 Europe Dual And Multi Energy Computed Tomography Market Estimates and Forecast, 2020-2028 (USD Million)
7.3.1 By Application
7.3.2 By End-use
7.3.3 By Type
7.3.4 By Country
7.3.4.1 Germany Dual And Multi Energy Computed Tomography Market Estimates and Forecast, 2020-2028 (USD Million)
7.3.4.1.1 By Application
7.3.4.1.2 By End-use
7.3.4.1.3 By Type
7.3.4.2 U.K. Dual And Multi Energy Computed Tomography Market Estimates and Forecast, 2020-2028 (USD Million)
7.3.4.2.1 By Application
7.3.4.2.2 By End-use
7.3.4.2.3 By Type
7.3.4.3 France Dual And Multi Energy Computed Tomography Market Estimates and Forecast, 2020-2028 (USD Million)
7.3.4.3.1 By Application
7.3.4.3.2 By End-use
7.3.4.3.3 By Type
7.3.4.4 Italy Dual And Multi Energy Computed Tomography Market Estimates and Forecast, 2020-2028 (USD Million)
7.3.4.4.1 By Application
7.3.4.4.2 By End-use
7.2.4.4.3 By Type
7.3.4.5 Spain Dual And Multi Energy Computed Tomography Market Estimates and Forecast, 2020-2028 (USD Million)
7.3.4.5.1 By Application
7.3.4.5.2 By End-use
7.2.4.5.3 By Type
7.3.4.6 Netherlands Dual And Multi Energy Computed Tomography Market Estimates and Forecast, 2020-2028 (USD Million)
7.3.4.6.1 By Application
7.3.4.6.2 By End-use
7.2.4.6.3 By Type
7.3.4.7 Rest of Europe Dual And Multi Energy Computed Tomography Market Estimates and Forecast, 2020-2028 (USD Million)
7.3.4.7.1 By Application
7.3.4.7.2 By End-use
7.2.4.7.3 By Type
7.4 Asia Pacific Dual And Multi Energy Computed Tomography Market Estimates and Forecast, 2020-2028 (USD Million)
7.4.1 By Application
7.4.2 By End-use
7.4.3 By Type
7.4.4 By Country
7.4.4.1 China Dual And Multi Energy Computed Tomography Market Estimates and Forecast, 2020-2028 (USD Million)
7.4.4.1.1 By Application
7.4.4.1.2 By End-use
7.4.4.1.3 By Type
7.4.4.2 Japan Dual And Multi Energy Computed Tomography Market Estimates and Forecast, 2020-2028 (USD Million)
7.4.4.2.1 By Application
7.4.4.2.2 By End-use
7.4.4.2.3 By Type
7.4.4.3 India Dual And Multi Energy Computed Tomography Market Estimates and Forecast, 2020-2028 (USD Million)
7.4.4.3.1 By Application
7.4.4.3.2 By End-use
7.4.4.3.3 By Type
7.4.4.4 South Korea Dual And Multi Energy Computed Tomography Market Estimates and Forecast, 2020-2028 (USD Million)
7.4.4.4.1 By Application
7.4.4.4.2 By End-use
7.4.4.4.3 By Type
7.4.4.5 Singapore Dual And Multi Energy Computed Tomography Market Estimates and Forecast, 2020-2028 (USD Million)
7.4.4.5.1 By Application
7.4.4.5.2 By End-use
7.4.4.5.3 By Type
7.4.4.6 Malaysia Dual And Multi Energy Computed Tomography Market Estimates and Forecast, 2020-2028 (USD Million)
7.4.4.6.1 By Application
7.4.4.6.2 By End-use
7.4.4.6.3 By Type
7.4.4.7 Thailand Dual And Multi Energy Computed Tomography Market Estimates and Forecast, 2020-2028 (USD Million)
7.4.4.7.1 By Application
7.4.4.7.2 By End-use
7.4.4.7.3 By Type
7.4.4.8 Indonesia Dual And Multi Energy Computed Tomography Market Estimates and Forecast, 2020-2028 (USD Million)
7.4.4.8.1 By Application
7.4.4.8.2 By End-use
7.4.4.8.3 By Type
7.4.4.9 Vietnam Dual And Multi Energy Computed Tomography Market Estimates and Forecast, 2020-2028 (USD Million)
7.4.4.9.1 By Application
7.4.4.9.2 By End-use
7.4.4.9.3 By Type
7.4.4.10 Taiwan Dual And Multi Energy Computed Tomography Market Estimates and Forecast, 2020-2028 (USD Million)
7.4.4.10.1 By Application
7.4.4.10.2 By End-use
7.4.4.10.3 By Type
7.4.4.11 Rest of Asia Pacific Dual And Multi Energy Computed Tomography Market Estimates and Forecast, 2020-2028 (USD Million)
7.4.4.11.1 By Application
7.4.4.11.2 By End-use
7.4.4.11.3 By Type
7.5 Middle East and Africa Dual And Multi Energy Computed Tomography Market Estimates and Forecast, 2020-2028 (USD Million)
7.5.1 By Application
7.5.2 By End-use
7.5.3 By Type
7.5.4 By Country
7.5.4.1 Saudi Arabia Dual And Multi Energy Computed Tomography Market Estimates and Forecast, 2020-2028 (USD Million)
7.5.4.1.1 By Application
7.5.4.1.2 By End-use
7.5.4.1.3 By Type
7.5.4.2 U.A.E. Dual And Multi Energy Computed Tomography Market Estimates and Forecast, 2020-2028 (USD Million)
7.5.4.2.1 By Application
7.5.4.2.2 By End-use
7.5.4.2.3 By Type
7.5.4.3 Israel Dual And Multi Energy Computed Tomography Market Estimates and Forecast, 2020-2028 (USD Million)
7.5.4.3.1 By Application
7.5.4.3.2 By End-use
7.5.4.3.3 By Type
7.5.4.4 South Africa Dual And Multi Energy Computed Tomography Market Estimates and Forecast, 2020-2028 (USD Million)
7.5.4.4.1 By Application
7.5.4.4.2 By End-use
7.5.4.4.3 By Type
7.5.4.5 Rest of Middle East and Africa Dual And Multi Energy Computed Tomography Market Estimates and Forecast, 2020-2028 (USD Million)
7.5.4.5.1 By Application
7.5.4.5.2 By End-use
7.5.4.5.2 By Type
7.6 Central and South America Dual And Multi Energy Computed Tomography Market Estimates and Forecast, 2020-2028 (USD Million)
7.6.1 By Application
7.6.2 By End-use
7.6.3 By Type
7.6.4 By Country
7.6.4.1 Brazil Dual And Multi Energy Computed Tomography Market Estimates and Forecast, 2020-2028 (USD Million)
7.6.4.1.1 By Application
7.6.4.1.2 By End-use
7.6.4.1.3 By Type
7.6.4.2 Argentina Eaporative Air Cooler Market Estimates and Forecast, 2020-2028 (USD Million)
7.6.4.2.1 By Application
7.6.4.2.2 By End-use
7.6.4.2.3 By Type
7.6.4.3 Chile Dual And Multi Energy Computed Tomography Market Estimates and Forecast, 2020-2028 (USD Million)
7.6.4.3.1 By Application
7.6.4.3.2 By End-use
7.6.4.3.3 By Type
7.6.4.4 Rest of Central & South America Dual And Multi Energy Computed Tomography Market Estimates and Forecast, 2020-2028 (USD Million)
7.6.4.4.1 By Application
7.6.4.4.2 By End-use
7.6.4.4.3 By Type
8 COMPETITIVE LANDCAPE
8.1 Company Market Share Analysis
8.2 Four Quadrant Positioning Matrix
8.2.1 Market Leaders
8.2.2 Market Visionaries
8.2.3 Market Challengers
8.2.4 Niche Market Players
8.3 Vendor Landscape
8.3.1 North America
8.3.2 Europe
8.3.3 Asia Pacific
8.3.4 Rest of the World
8.4 Company Profiles
8.4.1 Koninklijke Philips N.V.
8.4.1.1 Business Description & Financial Analysis
8.4.1.2 SWOT Analysis
8.4.1.3 Products & Services Offered
8.4.1.4 Strategic Alliances between Business Partners
8.4.2 GE Healthcare
8.4.2.1 Business Description & Financial Analysis
8.4.2.2 SWOT Analysis
8.4.2.3 Products & Services Offered
8.4.2.4 Strategic Alliances between Business Partners
8.4.3 Siemens Healthineers
8.4.3.1 Business Description & Financial Analysis
8.4.3.2 SWOT Analysis
8.4.3.3 Products & Services Offered
8.4.3.4 Strategic Alliances between Business Partners
8.4.4 Canon Medical Systems
8.4.4.1 Business Description & Financial Analysis
8.4.4.2 SWOT Analysis
8.4.4.3 Products & Services Offered
8.4.4.4 Strategic Alliances between Business Partners
8.4.5 Fujifilm Holdings Corp.
8.4.5.1 Business Description & Financial Analysis
8.4.5.2 SWOT Analysis
8.4.5.3 Products & Services Offered
8.4.5.4 Strategic Alliances between Business Partners
8.4.6 Shimadzu Corp.
8.4.6.1 Business Description & Financial Analysis
8.4.6.2 SWOT Analysis
8.4.6.3 Products & Services Offered
8.4.6.4 Strategic Alliances between Business Partners
8.4.7 Koning Corp.
8.4.7.1 Business Description & Financial Analysis
8.4.7.2 SWOT Analysis
8.4.7.3 Products & Services Offered
8.4.8.4 Strategic Alliances between Business Partners
8.4.8 Neusoft Medical Systems Co. Ltd.
8.4.8.1 Business Description & Financial Analysis
8.4.8.2 SWOT Analysis
8.4.8.3 Products & Services Offered
8.4.8.4 Strategic Alliances between Business Partners
8.4.9 CareStream Health
8.4.9.1 Business Description & Financial Analysis
8.4.9.2 SWOT Analysis
8.4.9.3 Products & Services Offered
8.4.9.4 Strategic Alliances between Business Partners
8.4.10 Planmeca Group
8.4.10.1 Business Description & Financial Analysis
8.4.10.2 SWOT Analysis
8.4.10.3 Products & Services Offered
8.4.10.4 Strategic Alliances between Business Partners
8.4.11 Other Companies
8.4.11.1 Business Description & Financial Analysis
8.4.11.2 SWOT Analysis
8.4.11.3 Products & Services Offered
8.4.11.4 Strategic Alliances between Business Partners
9 RESEARCH METHODOLOGY
9.1 Market Introduction
9.1.1 Market Definition
9.1.2 Market Scope & Segmentation
9.2 Information Procurement
9.2.1 Secondary Research
9.2.1.1 Purchased Databases
9.2.1.2 GMEs Internal Data Repository
9.2.1.3 Secondary Resources & Third Party Perspectives
9.2.1.4 Company Information Sources
9.2.2 Primary Research
9.2.2.1 Various Types of Respondents for Primary Interviews
9.2.2.2 Number of Interviews Conducted throughout the Research Process
9.2.2.3 Primary Stakeholders
9.2.2.4 Discussion Guide for Primary Participants
9.2.3 Expert Panels
9.2.3.1 Expert Panels Across 30+ Industry
9.2.4 Paid Local Experts
9.2.4.1 Paid Local Experts Across 30+ Industry Across each Region
9.3 Market Estimation
9.3.1 Top-Down Approach
9.3.1.1 Macro-Economic Indicators Considered
9.3.1.2 Micro-Economic Indicators Considered
9.3.2 Bottom Up Approach
9.3.2.1 Company Share Analysis Approach
9.3.2.2 Estimation of Potential Product Sales
9.4 Data Triangulation
9.4.1 Data Collection
9.4.2 Time Series, Cross Sectional & Panel Data Analysis
9.4.3 Cluster Analysis
9.5 Analysis and Output
9.5.1 Inhouse AI Based Real Time Analytics Tool
9.5.2 Output From Desk & Primary Research
9.6 Research Assumptions & Limitations
9.7.1 Research Assumptions
9.7.2 Research Limitations
LIST OF TABLES
1 Global Dual And Multi Energy Computed Tomography Market, By Application , 2020-2028 (USD Mllion)
2 Oncology Market, By Region, 2020-2028 (USD Mllion)
3 Neurology Market, By Region, 2020-2028 (USD Mllion)
4 Cardiology Market, By Region, 2020-2028 (USD Mllion)
5 Vascular Market, By Region, 2020-2028 (USD Mllion)
6 Musculoskeletal Market, By Region, 2020-2028 (USD Mllion)
7 Other Market, By Region, 2020-2028 (USD Mllion)
8 Global Dual And Multi Energy Computed Tomography Market, By End-use, 2020-2028 (USD Mllion)
9 Hospitals Market, By Region, 2020-2028 (USD Mllion)
10 Diagnostic Imaging Centers Market, By Region, 2020-2028 (USD Mllion)
11 Ambulatory Imaging Centers Market, By Region, 2020-2028 (USD Mllion)
12 Global Dual And Multi Energy Computed Tomography Market, By Type, 2020-2028 (USD Mllion)
13 Prospective Market, By Region, 2020-2028 (USD Mllion)
14 Retrospective Market, By Region, 2020-2028 (USD Mllion)
15 Regional Analysis, 2020-2028 (USD Mllion)
16 North America Dual And Multi Energy Computed Tomography Market, By Application , 2020-2028 (USD Million)
17 North America Dual And Multi Energy Computed Tomography Market, By End-use, 2020-2028 (USD Million)
18 North America Dual And Multi Energy Computed Tomography Market, By Type, 2020-2028 (USD Million)
19 North America Dual And Multi Energy Computed Tomography Market, By Country, 2020-2028 (USD Million)
20 U.S Dual And Multi Energy Computed Tomography Market, By Application , 2020-2028 (USD Million)
21 U.S Dual And Multi Energy Computed Tomography Market, By End-use, 2020-2028 (USD Million)
22 U.S Dual And Multi Energy Computed Tomography Market, By Type, 2020-2028 (USD Million)
23 Canada Dual And Multi Energy Computed Tomography Market, By Application , 2020-2028 (USD Million)
24 Canada Dual And Multi Energy Computed Tomography Market, By End-use, 2020-2028 (USD Million)
25 Canada Dual And Multi Energy Computed Tomography Market, By Type, 2020-2028 (USD Million)
26 Mexico Dual And Multi Energy Computed Tomography Market, By Application , 2020-2028 (USD Million)
27 Mexico Dual And Multi Energy Computed Tomography Market, By End-use, 2020-2028 (USD Million)
28 Mexico Dual And Multi Energy Computed Tomography Market, By Type, 2020-2028 (USD Million)
29 Europe Dual And Multi Energy Computed Tomography Market, By Application , 2020-2028 (USD Million)
30 Europe Dual And Multi Energy Computed Tomography Market, By End-use, 2020-2028 (USD Million)
31 Europe Dual And Multi Energy Computed Tomography Market, By Type, 2020-2028 (USD Million)
32 Europe Dual And Multi Energy Computed Tomography Market, By country, 2020-2028 (USD Million)
33 Germany Dual And Multi Energy Computed Tomography Market, By Application , 2020-2028 (USD Million)
34 Germany Dual And Multi Energy Computed Tomography Market, By End-use, 2020-2028 (USD Million)
35 Germany Dual And Multi Energy Computed Tomography Market, By Type, 2020-2028 (USD Million)
36 UK Dual And Multi Energy Computed Tomography Market, By Application , 2020-2028 (USD Million)
37 UK Dual And Multi Energy Computed Tomography Market, By End-use, 2020-2028 (USD Million)
38 UK Dual And Multi Energy Computed Tomography Market, By Type, 2020-2028 (USD Million)
39 France Dual And Multi Energy Computed Tomography Market, By Application , 2020-2028 (USD Million)
40 France Dual And Multi Energy Computed Tomography Market, By End-use, 2020-2028 (USD Million)
41 France Dual And Multi Energy Computed Tomography Market, By Type, 2020-2028 (USD Million)
42 Italy Dual And Multi Energy Computed Tomography Market, By Application , 2020-2028 (USD Million)
43 Italy Dual And Multi Energy Computed Tomography Market, By End Use , 2020-2028 (USD Million)
44 Italy Dual And Multi Energy Computed Tomography Market, By Type, 2020-2028 (USD Million)
45 Spain Dual And Multi Energy Computed Tomography Market, By Application , 2020-2028 (USD Million)
46 Spain Dual And Multi Energy Computed Tomography Market, By End-use, 2020-2028 (USD Million)
47 Spain Dual And Multi Energy Computed Tomography Market, By Type, 2020-2028 (USD Million)
48 Rest Of Europe Dual And Multi Energy Computed Tomography Market, By Application , 2020-2028 (USD Million)
49 Rest Of Europe Dual And Multi Energy Computed Tomography Market, By End-use, 2020-2028 (USD Million)
50 Rest of Europe Dual And Multi Energy Computed Tomography Market, By Type, 2020-2028 (USD Million)
51 Asia Pacific Dual And Multi Energy Computed Tomography Market, By Application , 2020-2028 (USD Million)
52 Asia Pacific Dual And Multi Energy Computed Tomography Market, By End-use, 2020-2028 (USD Million)
53 Asia Pacific Dual And Multi Energy Computed Tomography Market, By Type, 2020-2028 (USD Million)
54 Asia Pacific Dual And Multi Energy Computed Tomography Market, By Country, 2020-2028 (USD Million)
55 China Dual And Multi Energy Computed Tomography Market, By Application , 2020-2028 (USD Million)
56 China Dual And Multi Energy Computed Tomography Market, By End-use, 2020-2028 (USD Million)
57 China Dual And Multi Energy Computed Tomography Market, By Type, 2020-2028 (USD Million)
58 India Dual And Multi Energy Computed Tomography Market, By Application , 2020-2028 (USD Million)
59 India Dual And Multi Energy Computed Tomography Market, By End-use, 2020-2028 (USD Million)
60 India Dual And Multi Energy Computed Tomography Market, By Type, 2020-2028 (USD Million)
61 Japan Dual And Multi Energy Computed Tomography Market, By Application , 2020-2028 (USD Million)
62 Japan Dual And Multi Energy Computed Tomography Market, By End-use, 2020-2028 (USD Million)
63 Japan Dual And Multi Energy Computed Tomography Market, By Type, 2020-2028 (USD Million)
64 South Korea Dual And Multi Energy Computed Tomography Market, By Application , 2020-2028 (USD Million)
65 South Korea Dual And Multi Energy Computed Tomography Market, By End-use, 2020-2028 (USD Million)
66 South Korea Dual And Multi Energy Computed Tomography Market, By Type, 2020-2028 (USD Million)
67 Indonesia Dual And Multi Energy Computed Tomography Market, By Application , 2020-2028 (USD Million)
68 Indonesia Dual And Multi Energy Computed Tomography Market, By End-use, 2020-2028 (USD Million)
69 Indonesia Dual And Multi Energy Computed Tomography Market, By Type, 2020-2028 (USD Million)
70 Vietnam Dual And Multi Energy Computed Tomography Market, By Application , 2020-2028 (USD Million)
71 Vietnam Dual And Multi Energy Computed Tomography Market, By End-use, 2020-2028 (USD Million)
72 Vietnam Dual And Multi Energy Computed Tomography Market, By Type, 2020-2028 (USD Million)
73 Taiwan Dual And Multi Energy Computed Tomography Market, By Application , 2020-2028 (USD Million)
74 Taiwan Dual And Multi Energy Computed Tomography Market, By End-use, 2020-2028 (USD Million)
75 Taiwan Dual And Multi Energy Computed Tomography Market, By Type, 2020-2028 (USD Million)
76 Rest of Asia Pacific Dual And Multi Energy Computed Tomography Market, By Application , 2020-2028 (USD Million)
77 Rest of Asia Pacific Korea Dual And Multi Energy Computed Tomography Market, By End-use, 2020-2028 (USD Million)
78 Rest of Asia Pacific Dual And Multi Energy Computed Tomography Market, By Type, 2020-2028 (USD Million)
79 Middle East and Africa Dual And Multi Energy Computed Tomography Market, By Application , 2020-2028 (USD Million)
80 Middle East and Africa Dual And Multi Energy Computed Tomography Market, By End-use, 2020-2028 (USD Million)
81 Middle East and Africa Dual And Multi Energy Computed Tomography Market, By Type, 2020-2028 (USD Million)
82 Middle East and Africa Dual And Multi Energy Computed Tomography Market, By Country, 2020-2028 (USD Million)
83 Saudi Arabia Dual And Multi Energy Computed Tomography Market, By Application , 2020-2028 (USD Million)
84 Saudi Arabia Dual And Multi Energy Computed Tomography Market, By End-use, 2020-2028 (USD Million)
85 Saudi Arabia Dual And Multi Energy Computed Tomography Market, By Type, 2020-2028 (USD Million)
86 UAE Dual And Multi Energy Computed Tomography Market, By Application , 2020-2028 (USD Million)
87 UAE Dual And Multi Energy Computed Tomography Market, By End-use, 2020-2028 (USD Million)
88 UAE Dual And Multi Energy Computed Tomography Market, By Type, 2020-2028 (USD Million)
89 South Africa Dual And Multi Energy Computed Tomography Market, By Application , 2020-2028 (USD Million)
90 South Africa Dual And Multi Energy Computed Tomography Market, By End-use, 2020-2028 (USD Million)
91 South Africa Dual And Multi Energy Computed Tomography Market, By Type, 2020-2028 (USD Million)
92 Rest of Middle East and Africa Dual And Multi Energy Computed Tomography Market, By Application , 2020-2028 (USD Million)
93 Rest of Middle East and Africa Dual And Multi Energy Computed Tomography Market, By End-use, 2020-2028 (USD Million)
94 Rest of Middle East and Africa Dual And Multi Energy Computed Tomography Market, By Type, 2020-2028 (USD Million)
95 Central and South America Dual And Multi Energy Computed Tomography Market, By Application , 2020-2028 (USD Million)
96 Central and South America Dual And Multi Energy Computed Tomography Market, By End-use, 2020-2028 (USD Million)
97 Central and South America Dual And Multi Energy Computed Tomography Market, By Type, 2020-2028 (USD Million)
98 Central and South America Dual And Multi Energy Computed Tomography Market, By Country, 2020-2028 (USD Million)
99 Brazil Dual And Multi Energy Computed Tomography Market, By Application , 2020-2028 (USD Million)
100 Brazil Dual And Multi Energy Computed Tomography Market, By End-use, 2020-2028 (USD Million)
101 Brazil Dual And Multi Energy Computed Tomography Market, By Type, 2020-2028 (USD Million)
102 Chile Dual And Multi Energy Computed Tomography Market, By Application , 2020-2028 (USD Million)
103 Chile Dual And Multi Energy Computed Tomography Market, By End-use, 2020-2028 (USD Million)
104 Chile Dual And Multi Energy Computed Tomography Market, By Type, 2020-2028 (USD Million)
105 Rest of Central and South America Dual And Multi Energy Computed Tomography Market, By Application , 2020-2028 (USD Million)
106 Rest of Central and South America Dual And Multi Energy Computed Tomography Market, By End-use, 2020-2028 (USD Million)
107 Rest of Central and South America Dual And Multi Energy Computed Tomography Market, By Type, 2020-2028 (USD Million)
108 Koninklijke Philips N.V.: Products & Services Offering
109 GE Healthcare: Products & Services Offering
110 Siemens Healthineers: Products & Services Offering
111 Canon Medical Systems: Products & Services Offering
112 Fujifilm Holdings Corp.: Products & Services Offering
113 SHIMADZU CORP.: Products & Services Offering
114 Koning Corp. : Products & Services Offering
115 Neusoft Medical Systems Co. Ltd.: Products & Services Offering
116 CareStream Health, Inc: Products & Services Offering
117 Planmeca Group: Products & Services Offering
118 Other Companies: Products & Services Offering
LIST OF FIGURES
1 Global Dual And Multi Energy Computed Tomography Market Overview
2 Global Dual And Multi Energy Computed Tomography Market Value From 2020-2028 (USD Mllion)
3 Global Dual And Multi Energy Computed Tomography Market Share, By Application (2022)
4 Global Dual And Multi Energy Computed Tomography Market Share, By End-use (2022)
5 Global Dual And Multi Energy Computed Tomography Market Share, By Type (2022)
6 Global Dual And Multi Energy Computed Tomography Market, By Region (Asia Pacific Market)
7 Technological Trends In Global Dual And Multi Energy Computed Tomography Market
8 Four Quadrant Competitor Positioning Matrix
9 Impact Of Macro & Micro Indicators On The Market
10 Impact Of Key Drivers On The Global Dual And Multi Energy Computed Tomography Market
11 Impact Of Challenges On The Global Dual And Multi Energy Computed Tomography Market
12 Porter’s Five Forces Analysis
13 Global Dual And Multi Energy Computed Tomography Market: By Application Scope Key Takeaways
14 Global Dual And Multi Energy Computed Tomography Market, By Application Segment: Revenue Growth Analysis
15 Oncology Market, By Region, 2020-2028 (USD Mllion)
16 Neurology Market, By Region, 2020-2028 (USD Mllion)
17 Cardiology Market, By Region, 2020-2028 (USD Mllion)
18 Vascular Market, By Region, 2020-2028 (USD Mllion)
19 Musculoskeletal Market, By Region, 2020-2028 (USD Mllion)
20 Others Market, By Region, 2020-2028 (USD Mllion)
21 Global Dual And Multi Energy Computed Tomography Market: By End-use Scope Key Takeaways
22 Global Dual And Multi Energy Computed Tomography Market, By End-use Segment: Revenue Growth Analysis
23 Hospitals Market, By Region, 2020-2028 (USD Mllion)
24 Diagnostic Imaging Centers Market, By Region, 2020-2028 (USD Mllion)
25 Ambulatory Imaging Centers Market, By Region, 2020-2028 (USD Mllion)
26 Global Dual And Multi Energy Computed Tomography Market: By Type Scope Key Takeaways
27 Global Dual And Multi Energy Computed Tomography Market, By Type Segment: Revenue Growth Analysis
28 Prospective Market, By Region, 2020-2028 (USD Mllion)
29 Retrospective Market, By Region, 2020-2028 (USD Mllion)
30 Regional Segment: Revenue Growth Analysis
31 Global Dual And Multi Energy Computed Tomography Market: Regional Analysis
32 North America Dual And Multi Energy Computed Tomography Market Overview
33 North America Dual And Multi Energy Computed Tomography Market, By Application
34 North America Dual And Multi Energy Computed Tomography Market, By End-use
35 North America Dual And Multi Energy Computed Tomography Market, By Type
36 North America Dual And Multi Energy Computed Tomography Market, By Country
37 U.S. Dual And Multi Energy Computed Tomography Market, By Application
38 U.S. Dual And Multi Energy Computed Tomography Market, By End-use
39 U.S. Dual And Multi Energy Computed Tomography Market, By Type
40 Canada Dual And Multi Energy Computed Tomography Market, By Application
41 Canada Dual And Multi Energy Computed Tomography Market, By End-use
42 Canada Dual And Multi Energy Computed Tomography Market, By Type
43 Mexico Dual And Multi Energy Computed Tomography Market, By Application
44 Mexico Dual And Multi Energy Computed Tomography Market, By End-use
45 Mexico Dual And Multi Energy Computed Tomography Market, By Type
46 Four Quadrant Positioning Matrix
47 Company Market Share Analysis
48 Koninklijke Philips N.V.: Company Snapshot
49 Koninklijke Philips N.V.: SWOT Analysis
50 Koninklijke Philips N.V.: Geographic Presence
51 GE Healthcare: Company Snapshot
52 GE Healthcare: SWOT Analysis
53 GE Healthcare: Geographic Presence
54 Siemens Healthineers: Company Snapshot
55 Siemens Healthineers: SWOT Analysis
56 Siemens Healthineers: Geographic Presence
57 Canon Medical Systems: Company Snapshot
58 Canon Medical Systems: Swot Analysis
59 Canon Medical Systems: Geographic Presence
60 Fujifilm Holdings Corp.: Company Snapshot
61 Fujifilm Holdings Corp.: SWOT Analysis
62 Fujifilm Holdings Corp.: Geographic Presence
63 Shimadzu Corp.: Company Snapshot
64 Shimadzu Corp.: SWOT Analysis
65 Shimadzu Corp.: Geographic Presence
66 Koning Corp. : Company Snapshot
67 Koning Corp. : SWOT Analysis
68 Koning Corp. : Geographic Presence
69 Neusoft Medical Systems Co. Ltd.: Company Snapshot
70 Neusoft Medical Systems Co. Ltd.: SWOT Analysis
71 Neusoft Medical Systems Co. Ltd.: Geographic Presence
72 CareStream Health, Inc.: Company Snapshot
73 CareStream Health, Inc.: SWOT Analysis
74 CareStream Health, Inc.: Geographic Presence
75 Planmeca Group: Company Snapshot
76 Planmeca Group: SWOT Analysis
77 Planmeca Group: Geographic Presence
78 Other Companies: Company Snapshot
79 Other Companies: SWOT Analysis
80 Other Companies: Geographic Presence
The Global Dual and Multi Energy Computed Tomography Market has been studied from the year 2019 till 2028. However, the CAGR provided in the report is from the year 2023 to 2028. The research methodology involved three stages: Desk research, Primary research, and Analysis & Output from the entire research process.

The desk research involved a robust background study which meant referring to paid and unpaid databases to understand the market dynamics; mapping contracts from press releases; identifying the key players in the market, studying their product portfolio, competition level, annual reports/SEC filings & investor presentations; and learning the demand and supply-side analysis for the Dual and Multi Energy Computed Tomography Market.

The primary research activity included telephonic conversations with more than 50 tier 1 industry consultants, distributors, and end-use product manufacturers.

Finally, based on the above thorough research process, an in-depth analysis was carried out considering the following aspects: market attractiveness, current & future market trends, market share analysis, SWOT analysis of the company and customer analytics.

Frequently Asked Questions

This FREE sample includes market data points, ranging from trend analyses to market estimates & forecasts. See for yourself.
Or view our licence options:
Tailor made solutions just for you
80% of our clients seek made-to-order reports. How do you want us to tailor yours?
OUR CLIENTS


