This report was recently updated on August 10 2025 with the latest and most recent
market numbers
Global Electric Bus Charging Infrastructure Market Size, Trends & Analysis - Forecasts to 2028 By Platform (Depot and On the Go), By Charging Type (On-board and Off-board), and By Region (North America, Asia Pacific, Central & South America, Europe, and Middle East and Africa), Competitive Landscape, Company Market Share Analysis, and End User Analysis
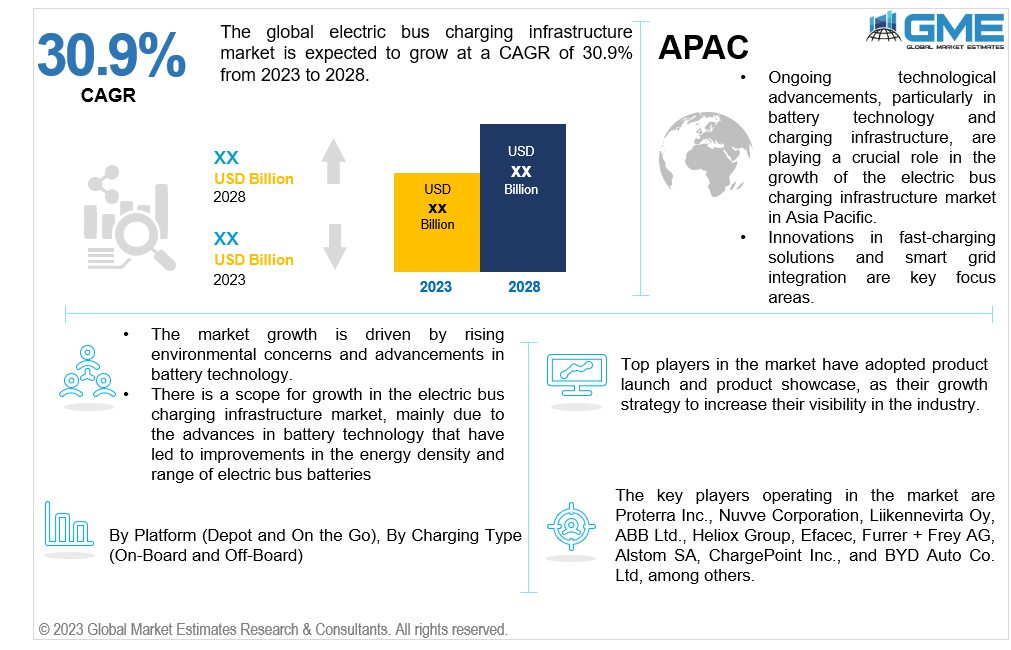
The global electric bus charging infrastructure market is expected to grow at a CAGR of 30.9% from 2023 to 2028. Most electric buses are charged at depots during non-operational hours. This involves overnight charging using conventional AC chargers.
The main growth drivers of the global electric bus charging infrastructure market are environmental concerns and technological advancements. Electric buses produce fewer emissions compared to traditional diesel buses, contributing to improved air quality and mitigating climate change. Many cities focus on becoming "smart cities" with sustainable and environmentally friendly transportation systems. Electric buses and charging infrastructure align with these goals, creating more liveable and sustainable urban environments. Battery technology advancements have improved electric bus batteries' energy density and range. Longer ranges and improved energy storage capacity make electric buses more viable for public transportation.
The market also has some restraints. The initial cost of implementation of electric vehicle charging infrastructure is high, and most of the EV technology is in the development and experimental phases. The commercial adoption of the electric vehicle and charging is slow.
Based on the platform, the market is segmented into depot and on the go. The on-the-go segment is expected to dominate the market in the forecast period. On-the-go charging is a time-sensitive method involving brief pauses during an ongoing journey. This approach enables electric buses to extend their operational durations without returning to a charging station for prolonged periods, ensuring continuous on-road performance.
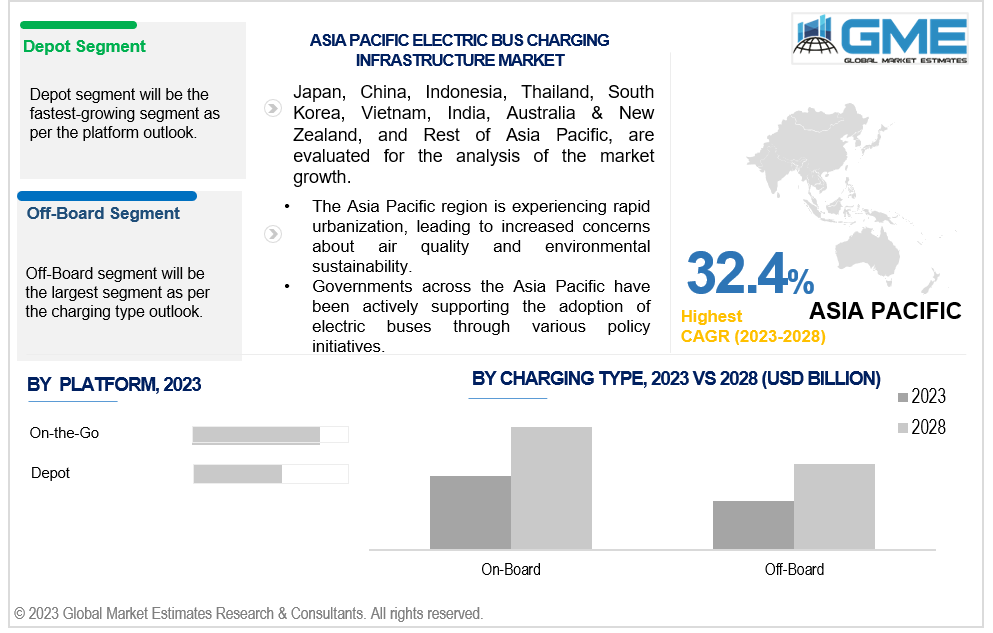
The depot segment is projected to have the highest growth rate in the forecast period. Factors driving the depot segment growth include the convenience and practicality of having a dedicated charging infrastructure at bus depots. Depot charging enables efficient overnight charging, minimizing downtime during operational hours and contributing to the seamless integration of electric buses into public transportation fleets. Additionally, depot charging often involves higher-capacity chargers, facilitating faster charging and supporting the operational demands of electric buses, especially in high-frequency service environments.
Based on charging type, the market is segmented into on-board and off-board. The off-board segment is expected to dominate the market in the forecast period. The expansion of this segment can be ascribed to the rapid-charging electric infrastructure that is accessible for efficiently charging buses within a shortened timeframe. The off-board high-power charger provides significant adaptability to the electric bus service by charging to the extent required for daily travel from one terminus to another or the subsequent available charging location. This system is particularly suitable for scenarios involving frequent operations, as the charging infrastructure can be shared by multiple buses per hour, irrespective of their manufacturers, given that the buses utilize the charging station for brief periods.
The on-board segment is projected to grow the fastest during the forecast period. The on-board charging segment is often favoured when electric buses are deployed for specific mobility services, such as shuttle or tourism routes. It also reduces dependency on external charging infrastructure, making it suitable for electric buses in regions where establishing a comprehensive charging network may be challenging or cost-prohibitive. This self-sufficiency contributes to the scalability and adaptability of electric bus fleets.
North America is analysed to be the largest region in the global electric bus charging infrastructure market during the forecast period. The United States and Canada have been actively promoting the adoption of electric buses as part of broader efforts to reduce carbon emissions and improve air quality. As cities grow, the need for sustainable and environmentally friendly public transportation options has become more apparent, leading to the adoption of electric buses and the development of charging infrastructure to support them.
Asia Pacific is projected to be the fastest-growing region across the global electric bus charging infrastructure market. The Asia Pacific region is experiencing rapid urbanization, increasing concerns about air quality and environmental sustainability. Governments across the Asia Pacific have been actively supporting the adoption of electric buses through various policy initiatives. This includes financial incentives, subsidies, and regulations aimed at encouraging the deployment of electric buses and the development of charging infrastructure. For instance, the Faster Adoption and Manufacturing of Hybrid and Electric Vehicles in India Scheme (FAME) by the Government of India provides incentives, including subsidies for electric vehicle buyers and support for charging infrastructure, to accelerate the adoption of electric and hybrid vehicles, including buses, fostering a conducive ecosystem for electric mobility. Ongoing technological advancements, particularly in battery technology and charging infrastructure, are playing a crucial role in the growth of the electric bus market in Asia Pacific. Innovations in fast-charging solutions and smart grid integration are key focus areas.
The key players operating in the market are Proterra Inc., Nuvve Corporation, Liikennevirta Oy, ABB Ltd., Heliox Group, Efacec, Furrer + Frey AG, Alstom SA, ChargePoint Inc., and BYD Auto Co. Ltd, amongst others.
On November 10, 2023, Volvo, a Sweden-based truck manufacturer, announced that it had won an auction for Proterra's battery business in the United States with a bid of USD 210 million. Volvo is aiming to finalize the acquisition of Proterra in early 2024.
On November 2, 2023, Nuvve Corporation announced that it had achieved a record in October for accelerating the electrification of transportation through its proprietary vehicle-to-grid (V2G) platform, a record number of 38 AC and DC bidirectional charging station connections — all linked to its V2G GIVe software platform to provide charging services to an additional 38 electric school buses (or 1.42 MW of capacity).
1 STRATEGIC INSIGHTS ON NEW REVENUE POCKETS
1.1 Strategic Opportunity & Attractiveness Analysis
1.1.1 Hot Revenue Pockets
1.1.2 Market Attractiveness Score
1.1.3 Revenue Impacting Opportunity
1.1.4 High Growing Region/Country
1.1.5 Competitor Analysis
1.1.6 Consumer Analysis
1.2 Global Market Estimates' View
1.3 Strategic Insights across Business Functions
1.3.1 For Chief Executive Officers
1.3.2 For Chief Marketing Officers
1.3.3 For Chief Strategy Officers
1.4 Evaluate the Potential of your Existing Business Lines vs. New Lines to Enter Into
2 TECHNOLOGICAL TRENDS
2.1 Technological Adoption Rate
2.2 Current Trend Impact Analysis
2.3 Future Trend Impact Analysis
3 GLOBAL MARKET OUTLOOK
3.1 Market Pyramid Analysis
3.1.1 Introduction
3.1.2 Adjacent Market Opportunities
3.1.3 Ancillary Market Opportunities
3.2 Demand Side Analysis
3.2.1 Market Drivers: Impact Analysis
3.2.2 Market Restraints: Impact Analysis
3.2.3 Market Opportunities: Impact Analysis
3.2.4 Market Challenges: Impact Analysis
3.3 Supply Side Analysis
3.3.1 Porter’s Five Forces Analysis
3.3.1.1 Threat of New Entrants
3.3.1.2 Threat of New Substitutes
3.3.1.3 Bargaining Power of Suppliers
3.3.1.4 Bargaining Power of Buyers
3.3.1.5 Intensity of Competitive Rivalry
3.3.2 SWOT Analysis; By Factor (Political & Legal, Economic, and Technological)
3.3.2.1 Political Landscape
3.3.2.2 Economic Landscape
3.3.2.3 Social Landscape
3.3.2.4 Technology Landscape
3.3.3 Value Chain Analysis
3.3.4 Trend Analysis
3.3.5 Gap Analysis
3.3.6 Cost Analysis
4 GLOBAL ELECTRIC BUS CHARGING INFRASTRUCTURE MARKET, BY PLATFORM
4.1 Introduction
4.2 Electric Bus Charging Infrastructure Market: Platform Scope Key Takeaways
4.3 Revenue Growth Analysis, 2022 & 2028
4.4 Depot
4.4.1 Depot Market Estimates and Forecast, 2020-2028 (USD Million)
4.5 On-the-Go
4.5.1 On-the-Go Market Estimates and Forecast, 2020-2028 (USD Million)
5 GLOBAL ELECTRIC BUS CHARGING INFRASTRUCTURE MARKET, BY CHARGING TYPE
5.1 Introduction
5.2 Electric Bus Charging Infrastructure Market: Charging Type Scope Key Takeaways
5.3 Revenue Growth Analysis, 2022 & 2028
5.4 On-Board
5.4.1 On-Board Market Estimates and Forecast, 2020-2028 (USD Million)
5.5 Off-Board
5.5.1 Off-Board Market Estimates and Forecast, 2020-2028 (USD Million)
6 GLOBAL ELECTRIC BUS CHARGING INFRASTRUCTURE MARKET, BY REGION
6.1 Introduction
6.2 North America Electric Bus Charging Infrastructure Market Estimates and Forecast, 2020-2028 (USD Million)
6.2.1 By Platform
6.2.2 By Charging Type
6.2.3 By Country
6.2.3.1 U.S. Electric Bus Charging Infrastructure Market Estimates and Forecast, 2020-2028 (USD Million)
6.2.3.1.1 By Platform
6.2.3.1.2 By Charging Type
6.2.3.2 Canada Electric Bus Charging Infrastructure Market Estimates and Forecast, 2020-2028 (USD Million)
6.2.3.2.1 By Platform
6.2.3.2.2 By Charging Type
6.2.3.3 Mexico Electric Bus Charging Infrastructure Market Estimates and Forecast, 2020-2028 (USD Million)
6.2.3.3.1 By Platform
6.2.3.3.2 By Charging Type
6.3 Europe Electric Bus Charging Infrastructure Market Estimates and Forecast, 2020-2028 (USD Million)
6.3.1 By Platform
6.3.2 By Charging Type
6.3.3 By Country
6.3.3.1 Germany Electric Bus Charging Infrastructure Market Estimates and Forecast, 2020-2028 (USD Million)
6.3.3.1.1 By Platform
6.3.3.1.2 By Charging Type
6.3.3.2 U.K. Electric Bus Charging Infrastructure Market Estimates and Forecast, 2020-2028 (USD Million)
6.3.3.2.1 By Platform
6.3.3.2.2 By Charging Type
6.3.3.3 France Electric Bus Charging Infrastructure Market Estimates and Forecast, 2020-2028 (USD Million)
6.3.3.3.1 By Platform
6.3.3.3.2 By Charging Type
6.3.3.4 Italy Electric Bus Charging Infrastructure Market Estimates and Forecast, 2020-2028 (USD Million)
6.3.3.4.1 By Platform
6.3.3.4.2 By Charging Type
6.3.3.5 Spain Electric Bus Charging Infrastructure Market Estimates and Forecast, 2020-2028 (USD Million)
6.3.3.5.1 By Platform
6.3.3.5.2 By Charging Type
6.3.3.6 Netherlands Electric Bus Charging Infrastructure Market Estimates and Forecast, 2020-2028 (USD Million)
6.3.3.6.1 By Platform
6.3.3.6.2 By Charging Type
6.3.3.7 Rest of Europe Electric Bus Charging Infrastructure Market Estimates and Forecast, 2020-2028 (USD Million)
6.3.3.6.1 By Platform
6.3.3.6.2 By Charging Type
6.4 Asia Pacific Electric Bus Charging Infrastructure Market Estimates and Forecast, 2020-2028 (USD Million)
6.4.1 By Platform
6.4.2 By Charging Type
6.4.3 By Country
6.4.3.1 China Electric Bus Charging Infrastructure Market Estimates and Forecast, 2020-2028 (USD Million)
6.4.3.1.1 By Platform
6.4.3.1.2 By Charging Type
6.4.3.2 Japan Electric Bus Charging Infrastructure Market Estimates and Forecast, 2020-2028 (USD Million)
6.4.3.2.1 By Platform
6.4.3.2.2 By Charging Type
6.4.3.3 India Electric Bus Charging Infrastructure Market Estimates and Forecast, 2020-2028 (USD Million)
6.4.3.3.1 By Platform
6.4.3.3.2 By Charging Type
6.4.3.4 South Korea Electric Bus Charging Infrastructure Market Estimates and Forecast, 2020-2028 (USD Million)
6.4.3.4.1 By Platform
6.4.3.4.2 By Charging Type
6.4.3.5 Singapore Electric Bus Charging Infrastructure Market Estimates and Forecast, 2020-2028 (USD Million)
6.4.3.5.1 By Platform
6.4.3.5.2 By Charging Type
6.4.3.6 Malaysia Electric Bus Charging Infrastructure Market Estimates and Forecast, 2020-2028 (USD Million)
6.4.3.6.1 By Platform
6.4.3.6.2 By Charging Type
6.4.3.7 Thailand Electric Bus Charging Infrastructure Market Estimates and Forecast, 2020-2028 (USD Million)
6.4.3.6.1 By Platform
6.4.3.6.2 By Charging Type
6.4.3.8 Indonesia Electric Bus Charging Infrastructure Market Estimates and Forecast, 2020-2028 (USD Million)
6.4.3.7.1 By Platform
6.4.3.7.2 By Charging Type
6.4.3.9 Vietnam Electric Bus Charging Infrastructure Market Estimates and Forecast, 2020-2028 (USD Million)
6.4.3.8.1 By Platform
6.4.3.8.2 By Charging Type
6.4.3.10 Taiwan Electric Bus Charging Infrastructure Market Estimates and Forecast, 2020-2028 (USD Million)
6.4.3.10.1 By Platform
6.4.3.10.2 By Charging Type
6.4.3.11 Rest of Asia Pacific Electric Bus Charging Infrastructure Market Estimates and Forecast, 2020-2028 (USD Million)
6.4.3.11.1 By Platform
6.4.3.11.2 By Charging Type
6.5 Middle East & Africa Electric Bus Charging Infrastructure Market Estimates and Forecast, 2020-2028 (USD Million)
6.5.1 By Platform
6.5.2 By Charging Type
6.5.3 By Country
6.5.3.1 Saudi Arabia Electric Bus Charging Infrastructure Market Estimates and Forecast, 2020-2028 (USD Million)
6.5.3.1.1 By Platform
6.5.3.1.2 By Charging Type
6.5.3.2 U.A.E. Electric Bus Charging Infrastructure Market Estimates and Forecast, 2020-2028 (USD Million)
6.5.3.2.1 By Platform
6.5.3.2.2 By Charging Type
6.5.3.3 Israel Electric Bus Charging Infrastructure Market Estimates and Forecast, 2020-2028 (USD Million)
6.5.3.3.1 By Platform
6.5.3.3.2 By Charging Type
6.5.3.4 South Africa Electric Bus Charging Infrastructure Market Estimates and Forecast, 2020-2028 (USD Million)
6.5.3.4.1 By Platform
6.5.3.4.2 By Charging Type
6.5.3.5 Rest of Middle East & Africa Electric Bus Charging Infrastructure Market Estimates and Forecast, 2020-2028 (USD Million)
6.5.3.5.1 By Platform
6.5.3.5.2 By Charging Type
6.6 Central & South America Electric Bus Charging Infrastructure Market Estimates and Forecast, 2020-2028 (USD Million)
6.6.1 By Platform
6.6.2 By Charging Type
6.6.3 By Country
6.6.3.1 Brazil Electric Bus Charging Infrastructure Market Estimates and Forecast, 2020-2028 (USD Million)
6.6.3.1.1 By Platform
6.6.3.1.2 By Charging Type
6.6.3.2 Argentina Electric Bus Charging Infrastructure Market Estimates and Forecast, 2020-2028 (USD Million)
6.6.3.2.1 By Platform
6.6.3.2.2 By Charging Type
6.6.3.3 Chile Electric Bus Charging Infrastructure Market Estimates and Forecast, 2020-2028 (USD Million)
6.6.3.3.1 By Platform
6.6.3.3.2 By Charging Type
6.6.3.3 Rest of Central & South America Electric Bus Charging Infrastructure Market Estimates and Forecast, 2020-2028 (USD Million)
6.6.3.3.1 By Platform
6.6.3.3.2 By Charging Type
7 COMPETITIVE LANDCAPE
7.1 Company Market Share Analysis
7.2 Four Quadrant Positioning Matrix
7.2.1 Market Leaders
7.2.2 Market Visionaries
7.2.3 Market Challengers
7.2.4 Niche Market Players
7.3 Vendor Landscape
7.3.1 North America
7.3.2 Europe
7.3.3 Asia Pacific
7.3.4 Rest of the World
7.4 Company Profiles
7.4.1 Proterra Inc
7.4.1.1 Business Description & Financial Analysis
7.4.1.2 SWOT Analysis
7.4.1.3 Products & Services Offered
7.4.1.4 Strategic Alliances between Business Partners
7.4.2 Nuvve Corporation
7.4.2.1 Business Description & Financial Analysis
7.4.2.2 SWOT Analysis
7.4.2.3 Products & Services Offered
7.4.2.4 Strategic Alliances between Business Partners
7.4.3 Liikennevirta Oy
7.4.3.1 Business Description & Financial Analysis
7.4.3.2 SWOT Analysis
7.4.3.3 Products & Services Offered
7.4.3.4 Strategic Alliances between Business Partners
7.4.4 ABB Ltd
7.4.4.1 Business Description & Financial Analysis
7.4.4.2 SWOT Analysis
7.4.4.3 Products & Services Offered
7.4.4.4 Strategic Alliances between Business Partners
7.4.5 Heliox Group
7.4.5.1 Business Description & Financial Analysis
7.4.5.2 SWOT Analysis
7.4.5.3 Products & Services Offered
7.4.5.4 Strategic Alliances between Business Partners
7.4.6 EFACEC
7.4.6.1 Business Description & Financial Analysis
7.4.6.2 SWOT Analysis
7.4.6.3 Products & Services Offered
7.4.6.4 Strategic Alliances between Business Partners
7.4.7 Furrer + Frey AG
7.4.7.1 Business Description & Financial Analysis
7.4.7.2 SWOT Analysis
7.4.7.3 Products & Services Offered
7.4.7.4 Strategic Alliances between Business Partners
7.4.8 Alstom SA
7.4.8.1 Business Description & Financial Analysis
7.4.8.2 SWOT Analysis
7.4.8.3 Products & Services Offered
7.4.8.4 Strategic Alliances between Business Partners
7.4.9 ChargePoint Inc.
7.4.9.1 Business Description & Financial Analysis
7.4.9.2 SWOT Analysis
7.4.9.3 Products & Services Offered
7.4.9.4 Strategic Alliances between Business Partners
7.4.10 BYD Auto Co. Ltd
7.4.10.1 Business Description & Financial Analysis
7.4.10.2 SWOT Analysis
7.4.10.3 Products & Services Offered
7.4.10.4 Strategic Alliances between Business Partners
7.4.11 Other Companies
7.4.11.1 Business Description & Financial Analysis
7.4.11.2 SWOT Analysis
7.4.11.3 Products & Services Offered
7.4.11.4 Strategic Alliances between Business Partners
8 RESEARCH METHODOLOGY
8.1 Market Introduction
8.1.1 Market Definition
8.1.2 Market Scope & Segmentation
8.2 Information Procurement
8.2.1 Secondary Research
8.2.1.1 Purchased Databases
8.2.1.2 GMEs Internal Data Repository
8.2.1.3 Secondary Resources & Third Party Perspectives
8.2.1.4 Company Information Sources
8.2.2 Primary Research
8.2.2.1 Various Types of Respondents for Primary Interviews
8.2.2.2 Number of Interviews Conducted throughout the Research Process
8.2.2.3 Primary Stakeholders
8.2.2.4 Discussion Guide for Primary Participants
8.2.3 Expert Panels
8.2.3.1 Expert Panels Across 30+ Industry
8.2.4 Paid Local Experts
8.2.4.1 Paid Local Experts Across 30+ Industry Across each Region
8.3 Market Estimation
8.3.1 Top-Down Approach
8.3.1.1 Macro-Economic Indicators Considered
8.3.1.2 Micro-Economic Indicators Considered
8.3.2 Bottom Up Approach
8.3.2.1 Company Share Analysis Approach
8.3.2.2 Estimation of Potential Product Sales
8.4 Data Triangulation
8.4.1 Data Collection
8.4.2 Time Series, Cross Sectional & Panel Data Analysis
8.4.3 Cluster Analysis
8.5 Analysis and Output
8.5.1 Inhouse AI Based Real Time Analytics Tool
8.5.2 Output From Desk & Primary Research
8.6 Research Assumptions & Limitations
8.6.1 Research Assumptions
8.6.2 Research Limitations
LIST OF TABLES
1 Global Electric Bus Charging Infrastructure Market, By Platform, 2020-2028 (USD Mllion)
2 Depot Market, By Region, 2020-2028 (USD Mllion)
3 On-the-Go Market, By Region, 2020-2028 (USD Mllion)
4 Global Electric Bus Charging Infrastructure Market, By Charging Type, 2020-2028 (USD Mllion)
5 On-Board Market, By Region, 2020-2028 (USD Mllion)
6 Off-Board Market, By Region, 2020-2028 (USD Mllion)
7 Regional Analysis, 2020-2028 (USD Mllion)
8 North America Electric Bus Charging Infrastructure Market, By Platform, 2020-2028 (USD Mllion)
9 North America Electric Bus Charging Infrastructure Market, By Charging Type, 2020-2028 (USD Mllion)
10 North America Electric Bus Charging Infrastructure Market, By Country, 2020-2028 (USD Mllion)
11 U.S. Electric Bus Charging Infrastructure Market, By Platform, 2020-2028 (USD Mllion)
12 U.S. Electric Bus Charging Infrastructure Market, By Charging Type, 2020-2028 (USD Mllion)
13 Canada Electric Bus Charging Infrastructure Market, By Platform, 2020-2028 (USD Mllion)
14 Canada Electric Bus Charging Infrastructure Market, By Charging Type, 2020-2028 (USD Mllion)
15 Mexico Electric Bus Charging Infrastructure Market, By Platform, 2020-2028 (USD Mllion)
16 Mexico Electric Bus Charging Infrastructure Market, By Charging Type, 2020-2028 (USD Mllion)
17 Europe Electric Bus Charging Infrastructure Market, By Platform, 2020-2028 (USD Mllion)
18 Europe Electric Bus Charging Infrastructure Market, By Charging Type, 2020-2028 (USD Mllion)
19 Europe Electric Bus Charging Infrastructure Market, By Country, 2020-2028 (USD Mllion)
20 Germany Electric Bus Charging Infrastructure Market, By Platform, 2020-2028 (USD Mllion)
21 Germany Electric Bus Charging Infrastructure Market, By Charging Type, 2020-2028 (USD Mllion)
22 U.K. Electric Bus Charging Infrastructure Market, By Platform, 2020-2028 (USD Mllion)
23 U.K. Electric Bus Charging Infrastructure Market, By Charging Type, 2020-2028 (USD Mllion)
24 France Electric Bus Charging Infrastructure Market, By Platform, 2020-2028 (USD Mllion)
25 France Electric Bus Charging Infrastructure Market, By Charging Type, 2020-2028 (USD Mllion)
26 Italy Electric Bus Charging Infrastructure Market, By Platform, 2020-2028 (USD Mllion)
27 Italy Electric Bus Charging Infrastructure Market, By Charging Type, 2020-2028 (USD Mllion)
28 Spain Electric Bus Charging Infrastructure Market, By Platform, 2020-2028 (USD Mllion)
29 Spain Electric Bus Charging Infrastructure Market, By Charging Type, 2020-2028 (USD Mllion)
30 Netherlands Electric Bus Charging Infrastructure Market, By Platform, 2020-2028 (USD Mllion)
31 Netherlands Electric Bus Charging Infrastructure Market, By Charging Type, 2020-2028 (USD Mllion)
32 Rest Of Europe Electric Bus Charging Infrastructure Market, By Platform, 2020-2028 (USD Mllion)
33 Rest Of Europe Electric Bus Charging Infrastructure Market, By Charging Type, 2020-2028 (USD Mllion)
34 Asia Pacific Electric Bus Charging Infrastructure Market, By Platform, 2020-2028 (USD Mllion)
35 Asia Pacific Electric Bus Charging Infrastructure Market, By Charging Type, 2020-2028 (USD Mllion)
36 Asia Pacific Electric Bus Charging Infrastructure Market, By Country, 2020-2028 (USD Mllion)
37 China Electric Bus Charging Infrastructure Market, By Platform, 2020-2028 (USD Mllion)
38 China Electric Bus Charging Infrastructure Market, By Charging Type, 2020-2028 (USD Mllion)
39 Japan Electric Bus Charging Infrastructure Market, By Platform, 2020-2028 (USD Mllion)
40 Japan Electric Bus Charging Infrastructure Market, By Charging Type, 2020-2028 (USD Mllion)
41 India Electric Bus Charging Infrastructure Market, By Platform, 2020-2028 (USD Mllion)
42 India Electric Bus Charging Infrastructure Market, By Charging Type, 2020-2028 (USD Mllion)
43 South Korea Electric Bus Charging Infrastructure Market, By Platform, 2020-2028 (USD Mllion)
44 South Korea Electric Bus Charging Infrastructure Market, By Charging Type, 2020-2028 (USD Mllion)
45 Singapore Electric Bus Charging Infrastructure Market, By Platform, 2020-2028 (USD Mllion)
46 Singapore Electric Bus Charging Infrastructure Market, By Charging Type, 2020-2028 (USD Mllion)
47 Thailand Electric Bus Charging Infrastructure Market, By Platform, 2020-2028 (USD Mllion)
48 Thailand Electric Bus Charging Infrastructure Market, By Charging Type, 2020-2028 (USD Mllion)
49 Malaysia Electric Bus Charging Infrastructure Market, By Platform, 2020-2028 (USD Mllion)
50 Malaysia Electric Bus Charging Infrastructure Market, By Charging Type, 2020-2028 (USD Mllion)
51 Indonesia Electric Bus Charging Infrastructure Market, By Platform, 2020-2028 (USD Mllion)
52 Indonesia Electric Bus Charging Infrastructure Market, By Charging Type, 2020-2028 (USD Mllion)
53 Vietnam Electric Bus Charging Infrastructure Market, By Platform, 2020-2028 (USD Mllion)
54 Vietnam Electric Bus Charging Infrastructure Market, By Charging Type, 2020-2028 (USD Mllion)
55 Taiwan Electric Bus Charging Infrastructure Market, By Platform, 2020-2028 (USD Mllion)
56 Taiwan Electric Bus Charging Infrastructure Market, By Charging Type, 2020-2028 (USD Mllion)
57 Rest of APAC Electric Bus Charging Infrastructure Market, By Platform, 2020-2028 (USD Mllion)
58 Rest of APAC Electric Bus Charging Infrastructure Market, By Charging Type, 2020-2028 (USD Mllion)
59 Middle East & Africa Electric Bus Charging Infrastructure Market, By Platform, 2020-2028 (USD Mllion)
60 Middle East & Africa Electric Bus Charging Infrastructure Market, By Charging Type, 2020-2028 (USD Mllion)
61 Middle East & Africa Electric Bus Charging Infrastructure Market, By Country, 2020-2028 (USD Mllion)
62 Saudi Arabia Electric Bus Charging Infrastructure Market, By Platform, 2020-2028 (USD Mllion)
63 Saudi Arabia Electric Bus Charging Infrastructure Market, By Charging Type, 2020-2028 (USD Mllion)
64 UAE Electric Bus Charging Infrastructure Market, By Platform, 2020-2028 (USD Mllion)
65 UAE Electric Bus Charging Infrastructure Market, By Charging Type, 2020-2028 (USD Mllion)
66 Israel Electric Bus Charging Infrastructure Market, By Platform, 2020-2028 (USD Mllion)
67 Israel Electric Bus Charging Infrastructure Market, By Charging Type, 2020-2028 (USD Mllion)
68 South Africa Electric Bus Charging Infrastructure Market, By Platform, 2020-2028 (USD Mllion)
69 South Africa Electric Bus Charging Infrastructure Market, By Charging Type, 2020-2028 (USD Mllion)
70 Rest Of Middle East & Africa Electric Bus Charging Infrastructure Market, By Platform, 2020-2028 (USD Mllion)
71 Rest Of Middle East & Africa Electric Bus Charging Infrastructure Market, By Charging Type, 2020-2028 (USD Mllion)
72 Central & South America Electric Bus Charging Infrastructure Market, By Platform, 2020-2028 (USD Mllion)
73 Central & South America Electric Bus Charging Infrastructure Market, By Charging Type, 2020-2028 (USD Mllion)
74 Central & South America Electric Bus Charging Infrastructure Market, By Country, 2020-2028 (USD Mllion)
75 Brazil Electric Bus Charging Infrastructure Market, By Platform, 2020-2028 (USD Mllion)
76 Brazil Electric Bus Charging Infrastructure Market, By Charging Type, 2020-2028 (USD Mllion)
77 Chile Electric Bus Charging Infrastructure Market, By Platform, 2020-2028 (USD Mllion)
78 Chile Electric Bus Charging Infrastructure Market, By Charging Type, 2020-2028 (USD Mllion)
79 Argentina Electric Bus Charging Infrastructure Market, By Platform, 2020-2028 (USD Mllion)
80 Argentina Electric Bus Charging Infrastructure Market, By Charging Type, 2020-2028 (USD Mllion)
81 Rest Of Central & South America Electric Bus Charging Infrastructure Market, By Platform, 2020-2028 (USD Mllion)
82 Rest Of Central & South America Electric Bus Charging Infrastructure Market, By Charging Type, 2020-2028 (USD Mllion)
83 Proterra Inc: Products & Services Offering
84 Nuvve Corporation: Products & Services Offering
85 Liikennevirta Oy: Products & Services Offering
86 ABB Ltd: Products & Services Offering
87 Heliox Group: Products & Services Offering
88 EFACEC: Products & Services Offering
89 Furrer + Frey AG : Products & Services Offering
90 Alstom SA: Products & Services Offering
91 ChargePoint Inc.: Products & Services Offering
92 BYD Auto Co. Ltd: Products & Services Offering
93 Other Companies: Products & Services Offering
LIST OF FIGURES
1 Global Electric Bus Charging Infrastructure Market Overview
2 Global Electric Bus Charging Infrastructure Market Value From 2020-2028 (USD Mllion)
3 Global Electric Bus Charging Infrastructure Market Share, By Platform (2022)
4 Global Electric Bus Charging Infrastructure Market Share, By Charging Type (2022)
5 Global Electric Bus Charging Infrastructure Market, By Region (Asia Pacific Market)
6 Technological Trends In Global Electric Bus Charging Infrastructure Market
7 Four Quadrant Competitor Positioning Matrix
8 Impact Of Macro & Micro Indicators On The Market
9 Impact Of Key Drivers On The Global Electric Bus Charging Infrastructure Market
10 Impact Of Challenges On The Global Electric Bus Charging Infrastructure Market
11 Porter’s Five Forces Analysis
12 Global Electric Bus Charging Infrastructure Market: By Platform Scope Key Takeaways
13 Global Electric Bus Charging Infrastructure Market, By Platform Segment: Revenue Growth Analysis
14 Depot Market, By Region, 2020-2028 (USD Mllion)
15 On-the-Go Market, By Region, 2020-2028 (USD Mllion)
16 Global Electric Bus Charging Infrastructure Market: By Charging Type Scope Key Takeaways
17 Global Electric Bus Charging Infrastructure Market, By Charging Type Segment: Revenue Growth Analysis
18 On-Board Market, By Region, 2020-2028 (USD Mllion)
19 Off-Board Market, By Region, 2020-2028 (USD Mllion)
20 Regional Segment: Revenue Growth Analysis
21 Global Electric Bus Charging Infrastructure Market: Regional Analysis
22 North America Electric Bus Charging Infrastructure Market Overview
23 North America Electric Bus Charging Infrastructure Market, By Platform
24 North America Electric Bus Charging Infrastructure Market, By Charging Type
25 North America Electric Bus Charging Infrastructure Market, By Country
26 U.S. Electric Bus Charging Infrastructure Market, By Platform
27 U.S. Electric Bus Charging Infrastructure Market, By Charging Type
28 Canada Electric Bus Charging Infrastructure Market, By Platform
29 Canada Electric Bus Charging Infrastructure Market, By Charging Type
30 Mexico Electric Bus Charging Infrastructure Market, By Platform
31 Mexico Electric Bus Charging Infrastructure Market, By Charging Type
32 Four Quadrant Positioning Matrix
33 Company Market Share Analysis
34 Proterra Inc: Company Snapshot
35 Proterra Inc: SWOT Analysis
36 Proterra Inc: Geographic Presence
37 Nuvve Corporation: Company Snapshot
38 Nuvve Corporation: SWOT Analysis
39 Nuvve Corporation: Geographic Presence
40 Liikennevirta Oy: Company Snapshot
41 Liikennevirta Oy: SWOT Analysis
42 Liikennevirta Oy: Geographic Presence
43 ABB Ltd: Company Snapshot
44 ABB Ltd: Swot Analysis
45 ABB Ltd: Geographic Presence
46 Heliox Group: Company Snapshot
47 Heliox Group: SWOT Analysis
48 Heliox Group: Geographic Presence
49 EFACEC: Company Snapshot
50 EFACEC: SWOT Analysis
51 EFACEC: Geographic Presence
52 Furrer + Frey AG : Company Snapshot
53 Furrer + Frey AG : SWOT Analysis
54 Furrer + Frey AG : Geographic Presence
55 Alstom SA: Company Snapshot
56 Alstom SA: SWOT Analysis
57 Alstom SA: Geographic Presence
58 ChargePoint Inc..: Company Snapshot
59 ChargePoint Inc..: SWOT Analysis
60 ChargePoint Inc..: Geographic Presence
61 BYD Auto Co. Ltd: Company Snapshot
62 BYD Auto Co. Ltd: SWOT Analysis
63 BYD Auto Co. Ltd: Geographic Presence
64 Other Companies: Company Snapshot
65 Other Companies: SWOT Analysis
66 Other Companies: Geographic Presence
The Global Electric Bus Charging Infrastructure Market has been studied from the year 2019 till 2028. However, the CAGR provided in the report is from the year 2023 to 2028. The research methodology involved three stages: Desk research, Primary research, and Analysis & Output from the entire research process.

The desk research involved a robust background study which meant referring to paid and unpaid databases to understand the market dynamics; mapping contracts from press releases; identifying the key players in the market, studying their product portfolio, competition level, annual reports/SEC filings & investor presentations; and learning the demand and supply-side analysis for the Electric Bus Charging Infrastructure Market.

The primary research activity included telephonic conversations with more than 50 tier 1 industry consultants, distributors, and end-use product manufacturers.

Finally, based on the above thorough research process, an in-depth analysis was carried out considering the following aspects: market attractiveness, current & future market trends, market share analysis, SWOT analysis of the company and customer analytics.

Frequently Asked Questions

This FREE sample includes market data points, ranging from trend analyses to market estimates & forecasts. See for yourself.
Or view our licence options:
Tailor made solutions just for you
80% of our clients seek made-to-order reports. How do you want us to tailor yours?
OUR CLIENTS


