This report was recently updated on August 24 2025 with the latest and most recent
market numbers
Global Electric Ship Market Size, Trends & Analysis - Forecasts to 2026 By Type (Fully Electric, Hybrid), By System (Energy Storage Systems, Power Generation, Power Conversion and Power Distribution Systems), By Ship Type (Commercial, Defence), By Operation (Manned, Remotely Operated, Autonomous), By Power Output (<75 kW, 75 - 745 kW), By Region (By Region (North America, Asia Pacific, Central & South America, Europe, and the Middle East and Africa), Competitive Landscape, Company Market Share Analysis, and Competitor Analysis
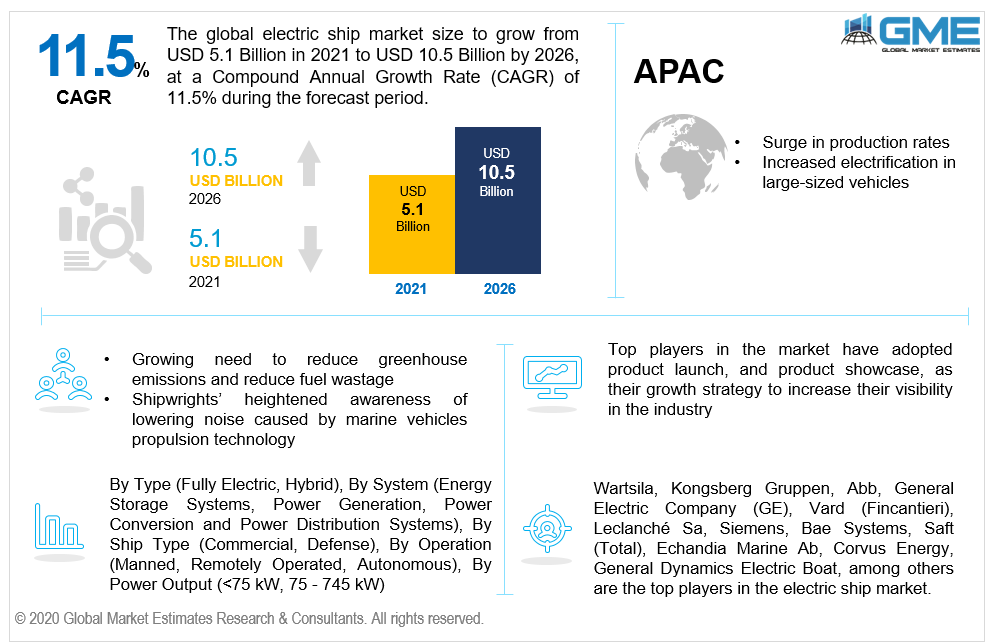
The global electric ship market is projected to grow from USD 5.1 billion in 2021 and is expected to reach USD 10.5 billion by 2026 at a CAGR of 11.5% from 2021 to 2026.
As per the U.N. International Trade and Development (UNCTAD), around 80% of the volume of international trade in goods is carried by sea, and the percentage is even higher for most developing countries. As per this research, one large ship releases the same amount of pollutants like 70,000 automobiles release CO2, 2 million cars' release nitrogen oxide, and 2.5 million cars' release fine dust and hazardous particles. Shipping is responsible for 18 to 30% of total oxides of nitrogen emission to the atmosphere. As a result, ships are the most substantial sources of pollution at shipping ports.
The majority of container and cruise ships, as well as oil tankers and cargo ships, run on heavyweight diesel fuel. They also require a lot of resources: Annually, the 90,000 ships in the globe, consume 370 million gallons of gasoline and emit million metric tonnes of sulfur oxide. Hence, alternative energy sources, like liquefied natural gas (LNG), hydrogen, or electric energy, are more economical and greener. One of the benefits of battery operation is that energy is substantially more affordable than oil and, in particular, maritime diesel.
The need for an electric-powered maritime ship has grown in response to the growing need to reduce greenhouse emissions and reduce fuel wastage. Additionally, the market's growth is being aided by shipwrights’ heightened awareness of reducing noise pollution caused by marine vehicles propulsion technology. Furthermore, the growing interest among electric vehicle (EV) producers to access the burgeoning market by enhancing electric ship manufacturing is boosting the market’s growth during the forecast period.
The International Maritime Organization's regulation on decreasing sulfur dioxide emissions, as well as the widespread deployment of fully electric cargo vehicles, are driving the market forward. Electric ships are an ecologically sustainable alternative to the conventional furl deployed in urban shipping and massive cargo ships. In comparison to heavy crude, they are better and more efficient, and electrical charging is far less expensive. Over the forecast period, these factors are projected to drive the adoption of hybrid and all-electric ships.
Due to the global shutdown of production facilities and protectionist measures implemented as a result of the Covid-19 outbreak, the expansion of the electric boat and ship business has been impeded. Nonetheless, with governmental regulatory changes to improve economic circumstances, the market is expected to recover over the forecast period. Short-range anxiety and increased buying costs, on the other hand, will function as market restrictions.
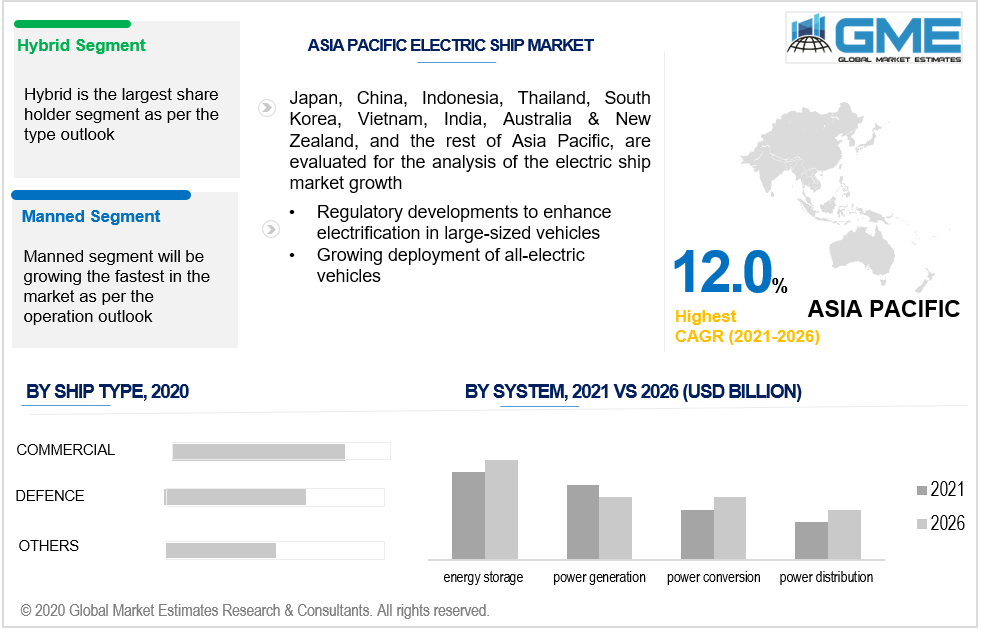
Based on type, the market is segmented into fully electric, and hybrid. The hybrid segment is estimated to have the largest share in the market during the forecast period owing to the increasing adoption of supplemental propulsion technology and rising adoption of hybrid electric ships across the globe. Moreover, shipping companies and transport and logistics organizations all over the world favour hybrid electric ships as they use less gasoline and have lower production and maintenance costs.
Based on the system, the market is segmented into energy storage systems, power generation, power conversion, and power distribution systems. The market for the energy storage system is predicted to have the largest share in the market during the forecast period. The energy storage system offer power backup during outages and moderate the distribution of fluctuating or inconsistent resources like wind and solar by storing additional energy when the wind blows and the sun shines and transferring it when the reverse occurs.
Based on ship type, the market is segmented into commercial, and defense. Commercial electric ships accounted for the largest market share during the forecast period. This is mainly due to rising competitive pressure among shipping companies and the rising product launch strategies in the market for this segment. Furthermore, an increase in logistics services is contributing to the market's growth.
Based on operation, the market is segmented into manned, remotely operated, and autonomous. The growth of the manned segment can be attributed to having the largest share in the market during the forecast period as they help in reduce human inaccuracy, lower crewing costs, improve life safety, and allow for even more economical use of capacity in vehicles design and fuel efficiency. During the forecast period, speedier operations with lower operational expenses are expected to take the market forward.
Based on the power output, the market is segmented into <75 kW, 75 - 745 kW, owing to the growing awareness of environmental conservation, which has resulted in the development of propulsion systems that create little emissions, has given the medium-sized marine vehicles a new lease on life, supporting the growth of the 75-745 KW power output category.
As per the geographical analysis, the market can be classified into North America (the US, Canada, and Mexico), Asia Pacific (India, China, Japan, Malaysia, Singapore, and Rest of Asia Pacific), Europe (Germany, United Kingdom, Italy, France, Spain, Netherlands, and Rest of Europe), Middle East & Africa and Central South & America.
The North American region is expected to hold the lion’s share of the market. This is mainly because of rising social concern about climate change, as well as governments’ efforts to promote electrically driven types of transportation. Additionally, the increasing popularity of electric leisure and recreational ships in the region's tourism industry, underwater adventures, and fishing are some other drivers expected to fuel regional market expansion. The COVID-19 epidemic, which has lately spread across Europe, particularly in Italy, the United Kingdom, Spain, and Germany, is projected to have a detrimental impact on regional market growth.
During the forecast period, the Asia Pacific region is expected to grow rapidly. Increased production rates are expected to help the region grow fastest.
Wartsila, Kongsberg Gruppen, Abb, General Electric Company (GE), Vard (Fincantieri), Leclanché Sa, Siemens, Bae Systems, Saft (Total), Echandia Marine Ab, Corvus Energy, General Dynamics Electric Boat, among others are the top players in the electric ship market.
Please note: This is not an exhaustive list of companies profiled in the report.
Chapter 1 Methodology
1.1 Market Scope & Definitions
1.2 Estimates & Forecast Calculation
1.3 Historical Data Overview and Validation
1.4 Data Sources
1.4.1 Secondary
1.4.2 Primary
Chapter 2 Report Outlook
2.1 Electric Ship Industry Overview, 2016-2026
2.1.1 Industry Overview
2.1.2 Type Overview
2.1.3 Ship Type Overview
2.1.4 Operation Overview
2.1.5 Power Output Overview
2.1.6 System Overview
2.1.7 Regional Overview
Chapter 3 Electric Ship Market Trends
3.1 Market Segmentation
3.2 Industry Background, 2016-2026
3.3 Market Key Trends
3.3.1 Positive Trends
3.3.1.1 Growing need to reduce greenhouse emissions and reduce fuel wastage
3.3.2 Industry Challenges
3.3.2.1 Failure to maintain ship vessels, which leads to operational defects
3.4 Prospective Growth Scenario
3.4.1 Type Growth Scenario
3.4.2 Ship Type Growth Scenario
3.4.3 Operation Growth Scenario
3.4.4 Power Output Growth Scenario
3.4.5 System Scenario
3.5 COVID-19 Influence over Industry Growth
3.6 Porter’s Analysis
3.7 PESTEL Analysis
3.8 Value Chain & Supply Chain Analysis
3.9 Regulatory Framework
3.9.1 North America
3.9.2 Europe
3.9.3 APAC
3.9.4 LATAM
3.9.5 MEA
3.10 Power Output Overview
3.11 Market Share Analysis, 2020
3.11.1 Company Positioning Overview, 2020
Chapter 4 Electric Ship Market, By Type
4.1 Type Outlook
4.2 Fully Electric
4.2.1 Market Size, By Region, 2016-2026 (USD Million)
4.3 Hybrid
4.3.1 Market Size, By Region, 2016-2026 (USD Million)
Chapter 5 Electric Ship Market, By Ship Type
5.1 Ship Type Outlook
5.2 Commercial
5.2.1 Market Size, By Region, 2016-2026 (USD Million)
5.3 Defence
5.3.1 Market Size, By Region, 2016-2026 (USD Million)
Chapter 6 Electric Ship Market, By Operation
6.1 Manned
6.1.1 Market Size, By Region, 2016-2026 (USD Million)
6.2 Remotely Operated
6.2.1 Market Size, By Region, 2016-2026 (USD Million)
6.3 Autonomous
6.3.1 Market Size, By Region, 2016-2026 (USD Million)
Chapter 7 Electric Ship Market, By Power Output
7.1 <75 kW
7.1.1 Market Size, By Region, 2016-2026 (USD Million)
7.2 75 - 745 kW
7.2.1 Market Size, By Region, 2016-2026 (USD Million)
Chapter 8 Electric Ship Market, By System
8.1 Energy Storage Systems
8.1.1 Market Size, By Region, 2016-2026 (USD Million)
8.2 Power Generation
8.2.1 Market Size, By Region, 2016-2026 (USD Million)
8.3 Power Conversion
8.3.1 Market Size, By Region, 2016-2026 (USD Million)
8.4 Power Distribution Systems
8.4.1 Market Size, By Region, 2016-2026 (USD Million)
Chapter 9 Electric Ship Market, By Region
9.1 Regional outlook
9.2 North America
9.2.1 Market Size, By Country 2016-2026 (USD Million)
9.2.2 Market Size, By Type, 2016-2026 (USD Million)
9.2.3 Market Size, By Ship Type, 2016-2026 (USD Million)
9.2.4 Market Size, By Operation, 2016-2026 (USD Million)
9.2.5 Market Size, By Power Output, 2016-2026 (USD Million)
9.2.6 Market Size, By System, 2016-2026 (USD Million)
9.2.7 U.S.
9.2.7.1 Market Size, By Type, 2016-2026 (USD Million)
9.2.7.2 Market Size, By Ship Type, 2016-2026 (USD Million)
9.2.7.3 Market Size, By Operation, 2016-2026 (USD Million)
9.2.7.4 Market Size, By Power Output, 2016-2026 (USD Million)
9.2.7.5 Market Size, By System, 2016-2026 (USD Million)
9.2.8 Canada
9.2.8.1 Market Size, By Type, 2016-2026 (USD Million)
9.2.8.2 Market Size, By Ship Type, 2016-2026 (USD Million)
9.2.8.3 Market Size, By Operation, 2016-2026 (USD Million)
9.2.8.4 Market Size, By Power Output, 2016-2026 (USD Million)
9.2.8.5 Market Size, By System, 2016-2026 (USD Million)
9.2.9 Mexico
9.2.9.1 Market Size, By Type, 2016-2026 (USD Million)
9.2.9.2 Market Size, By Ship Type, 2016-2026 (USD Million)
9.2.9.3 Market Size, By Operation, 2016-2026 (USD Million)
9.2.9.4 Market Size, By Power Output, 2016-2026 (USD Million)
9.2.9.5 Market Size, By System, 2016-2026 (USD Million)
9.3 Europe
9.3.1 Market Size, By Country 2016-2026 (USD Million)
9.3.2 Market Size, By Type, 2016-2026 (USD Million)
9.3.3 Market Size, By Ship Type, 2016-2026 (USD Million)
9.3.4 Market Size, By Operation, 2016-2026 (USD Million)
9.3.5 Market Size, By Power Output, 2016-2026 (USD Million)
9.3.6 Market Size, By System, 2016-2026 (USD Million)
9.3.7 Germany
9.3.7.1 Market Size, By Type, 2016-2026 (USD Million)
9.3.7.2 Market Size, By Ship Type, 2016-2026 (USD Million)
9.3.7.3 Market Size, By Operation, 2016-2026 (USD Million)
9.3.7.4 Market Size, By Power Output, 2016-2026 (USD Million)
9.3.7.5 Market Size, By System, 2016-2026 (USD Million)
9.3.8 UK
9.3.8.1 Market Size, By Type, 2016-2026 (USD Million)
9.3.8.2 Market Size, By Ship Type, 2016-2026 (USD Million)
9.3.8.3 Market Size, By Operation, 2016-2026 (USD Million)
9.3.8.4 Market Size, By Power Output, 2016-2026 (USD Million)
9.3.8.5 Market Size, By System, 2016-2026 (USD Million)
9.3.9 France
9.3.9.1 Market Size, By Type, 2016-2026 (USD Million)
9.3.9.2 Market Size, By Ship Type, 2016-2026 (USD Million)
9.3.9.3 Market Size, By Operation, 2016-2026 (USD Million)
9.3.9.4 Market Size, By Power Output, 2016-2026 (USD Million)
9.3.9.5 Market Size, By System, 2016-2026 (USD Million)
9.3.10 Italy
9.3.10.1 Market Size, By Type, 2016-2026 (USD Million)
9.3.10.2 Market Size, By Ship Type, 2016-2026 (USD Million)
9.3.10.3 Market Size, By Operation, 2016-2026 (USD Million)
9.3.10.4 Market Size, By Power Output, 2016-2026 (USD Million)
9.3.10.5 Market Size, By System, 2016-2026 (USD Million)
9.4 Asia Pacific
9.4.1 Market Size, By Country 2016-2026 (USD Million)
9.4.2 Market Size, By Type, 2016-2026 (USD Million)
9.4.3 Market Size, By Ship Type, 2016-2026 (USD Million)
9.4.4 Market Size, By Operation, 2016-2026 (USD Million)
9.4.5 Market Size, By Power Output, 2016-2026 (USD Million)
9.4.6 Market Size, By System, 2016-2026 (USD Million)
9.4.7 China
9.4.7.1 Market Size, By Type, 2016-2026 (USD Million)
9.4.7.2 Market Size, By Ship Type, 2016-2026 (USD Million)
9.4.7.3 Market Size, By Operation, 2016-2026 (USD Million)
9.4.7.4 Market Size, By Power Output, 2016-2026 (USD Million)
9.4.7.5 Market Size, By System, 2016-2026 (USD Million)
9.4.8 India
9.4.8.1 Market Size, By Type, 2016-2026 (USD Million)
9.4.8.2 Market Size, By Ship Type, 2016-2026 (USD Million)
9.4.8.3 Market Size, By Operation, 2016-2026 (USD Million)
9.4.8.4 Market Size, By Power Output, 2016-2026 (USD Million)
9.4.8.5 Market Size, By System, 2016-2026 (USD Million)
9.4.9 Japan
9.4.9.1 Market Size, By Type, 2016-2026 (USD Million)
9.4.9.2 Market Size, By Ship Type, 2016-2026 (USD Million)
9.4.9.3 Market Size, By Operation, 2016-2026 (USD Million)
9.4.9.4 Market Size, By Power Output, 2016-2026 (USD Million)
9.4.9.5 Market Size, By System, 2016-2026 (USD Million)
9.5 MEA
9.5.1 Market Size, By Country 2016-2026 (USD Million)
9.5.2 Market Size, By Type, 2016-2026 (USD Million)
9.5.3 Market Size, By Ship Type, 2016-2026 (USD Million)
9.5.4 Market Size, By Operation, 2016-2026 (USD Million)
9.5.5 Market Size, By Power Output, 2016-2026 (USD Million)
9.5.6 Market Size, By System, 2016-2026 (USD Million)
9.5.7 Saudi Arabia
9.5.7.1 Market Size, By Type, 2016-2026 (USD Million)
9.5.7.2 Market Size, By Ship Type, 2016-2026 (USD Million)
9.5.7.3 Market Size, By Operation, 2016-2026 (USD Million)
9.5.7.4 Market Size, By Power Output, 2016-2026 (USD Million)
9.5.7.5 Market Size, By System, 2016-2026 (USD Million)
9.5.8 UAE
9.5.8.1 Market Size, By Type, 2016-2026 (USD Million)
9.5.8.2 Market Size, By Ship Type, 2016-2026 (USD Million)
9.5.8.3 Market Size, By Operation, 2016-2026 (USD Million)
9.5.8.4 Market Size, By Power Output, 2016-2026 (USD Million)
9.5.8.5 Market Size, By System, 2016-2026 (USD Million)
9.5.9 South Africa
9.5.9.1 Market Size, By Type, 2016-2026 (USD Million)
9.5.9.2 Market Size, By Ship Type, 2016-2026 (USD Million)
9.5.9.3 Market Size, By Operation, 2016-2026 (USD Million)
9.5.9.4 Market Size, By Power Output, 2016-2026 (USD Million)
9.5.9.5 Market Size, By System, 2016-2026 (USD Million)
Chapter 10 Company Landscape
10.1 Competitive Analysis, 2020
10.2 Wartsila
10.2.1 Company Overview
10.2.2 Financial Analysis
10.2.3 Strategic Positioning
10.2.4 Info Graphic Analysis
10.3 Kongsberg Gruppen
10.3.1 Company Overview
10.3.2 Financial Analysis
10.3.3 Strategic Positioning
10.3.4 Info Graphic Analysis
10.4 Abb
10.4.1 Company Overview
10.4.2 Financial Analysis
10.4.3 Strategic Positioning
10.4.4 Info Graphic Analysis
10.5 General Electric Company (GE)
10.5.1 Company Overview
10.5.2 Financial Analysis
10.5.3 Strategic Positioning
10.5.4 Info Graphic Analysis
10.6 Vard (Fincantieri)
10.6.1 Company Overview
10.6.2 Financial Analysis
10.6.3 Strategic Positioning
10.6.4 Info Graphic Analysis
10.7 Leclanché Sa
10.7.1 Company Overview
10.7.2 Financial Analysis
10.7.3 Strategic Positioning
10.7.4 Info Graphic Analysis
10.8 Siemens
10.10.1 Company Overview
10.10.2 Financial Analysis
10.10.3 Strategic Positioning
10.10.4 Info Graphic Analysis
10.11 BAE Systems
10.10.1 Company Overview
10.10.2 Financial Analysis
10.10.3 Strategic Positioning
10.10.4 Info Graphic Analysis
10.10 Others
10.10.1 Company Overview
10.10.2 Financial Analysis
10.10.3 Strategic Positioning
10.10.4 Info Graphic Analysis
The Global Electric Ship Market has been studied from the year 2019 till 2026. However, the CAGR provided in the report is from the year 2021 to 2026. The research methodology involved three stages: Desk research, Primary research, and Analysis & Output from the entire research process.

The desk research involved a robust background study which meant referring to paid and unpaid databases to understand the market dynamics; mapping contracts from press releases; identifying the key players in the market, studying their product portfolio, competition level, annual reports/SEC filings & investor presentations; and learning the demand and supply-side analysis for the Electric Ship Market.

The primary research activity included telephonic conversations with more than 50 tier 1 industry consultants, distributors, and end-use product manufacturers.

Finally, based on the above thorough research process, an in-depth analysis was carried out considering the following aspects: market attractiveness, current & future market trends, market share analysis, SWOT analysis of the company and customer analytics.

Frequently Asked Questions

This FREE sample includes market data points, ranging from trend analyses to market estimates & forecasts. See for yourself.
Or view our licence options:
Tailor made solutions just for you
80% of our clients seek made-to-order reports. How do you want us to tailor yours?
OUR CLIENTS


