This report was recently updated on August 14 2025 with the latest and most recent
market numbers
Global Electronic Bill of Lading Market Size, Trends & Analysis - Forecasts to 2029 By Functionality (Document Management, Electronic Signature, Integration Capabilities, and Compliance and Security Features), By End-use Industries (Manufacturing, Logistics and Transportation, Retail, Healthcare, and Others), By Deployment Type (Cloud-based eBL Software and On-premise eBL Software), and By Region (North America, Asia Pacific, Central and South America, Europe, and Middle East and Africa), Competitive Landscape, Company Market Share Analysis, and End User Analysis
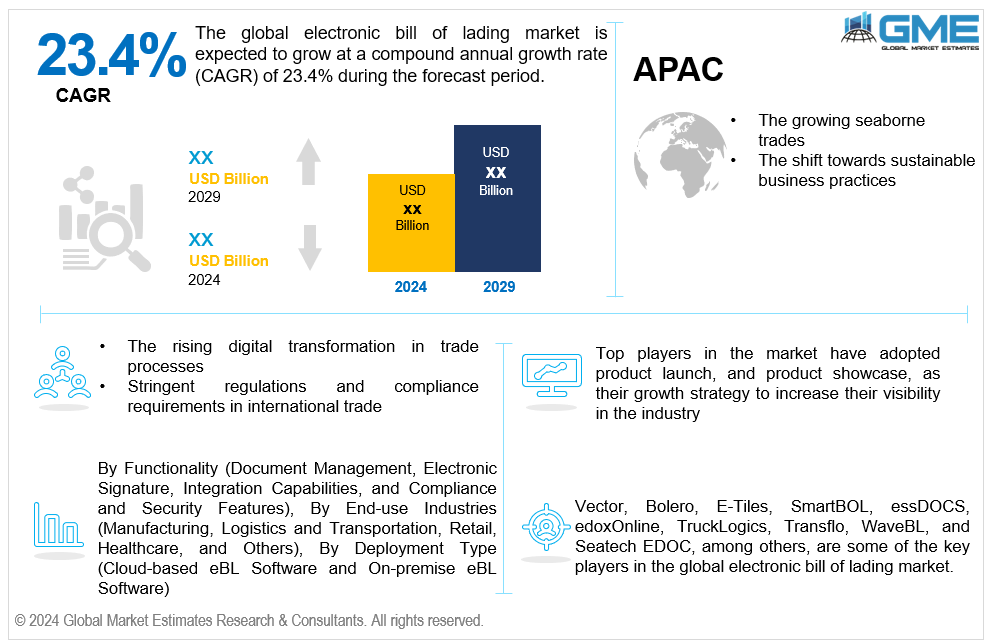
The global electronic bill of lading market is estimated to exhibit a CAGR of 23.4% from 2024 to 2029.
The primary factors propelling the market growth are the growing seaborne trades and the shift towards sustainable business practices. Millions of containers are transported annually as part of seaborne trade, which makes up a sizable amount of world trade volume. Due to economic growth and globalization, trade volumes are increasing, which means that more bills of lading are being produced for every shipment. Compared to conventional paper-based techniques, electronic bills of lading (eBL) provide a more effective and scalable way to manage the increasing volume of transactions. Additionally, users can track and view real-time information on the progress of shipments from the point of origin to the destination through electronic bills of lading. This visibility lowers transit times, increases supply chain efficiency, and lessens the chance of delays or disruptions. For instance, in 2021, the United Nations Conference on Trade and Development (UNCTAD) reported that the export of goods hit 11.0 billion tons, marking a 3.2% increase from 2020.
The rising digital transformation in trade processes and stringent regulations and compliance requirements in international trade are expected to support market growth. The objective of trade process digital transformation projects is to remove manual, paper-based duties and streamline operations. eBL systems minimize the time and effort needed to accomplish these operations by automating the development, transmission, and processing of bills of lading. For companies engaged in international trade, this greater efficiency translates into quicker shipment turnaround times and enhanced overall production. For instance, according to UNCTAD, the Netherlands and New Zealand rank first among individual nations in terms of overall trade digitization rates at 96%, followed by Australia, Belgium, the Republic of Korea, and Singapore at 93%.
Technological advancements, including blockchain, cloud computing, the Internet of Things (IoT), and artificial intelligence (AI), coupled with the growing complexity of supply chains, propel market growth. Blockchain makes it easier to create digital records of ownership transfers, shipment details, and contracts that cannot be altered. Additionally, cloud computing makes it possible to store, process, and share data and documents electronically in a scalable and readily available way. AI-powered eBL systems can analyze large volumes of structured and unstructured data to extract pertinent information, confirm the legitimacy of documents, and find abnormalities or discrepancies.
There is a rising need for effective trade documentation procedures due to the volume of international trade, especially in e-commerce and cross-border transactions. Global trade development is facilitated by eBL solutions, which enable speedier customs clearance, better supply chain visibility, and more seamless transactions. Additionally, the integration of eBL solutions with trade finance platforms and services presents opportunities for streamlining financing processes, reducing financing costs, and mitigating risks for banks and financial institutions involved in trade finance.
However, a lack of standardization and interoperability among eBL platforms and security concerns hinder market growth.
The document management segment is expected to hold the largest share of the market over the forecast period. The document management segment encompasses solutions and platforms that facilitate the digitization, storage, management, and exchange of trade documents, including bills of lading. As businesses increasingly digitize their operations and move towards paperless workflows, there is a growing demand for electronic document management solutions.
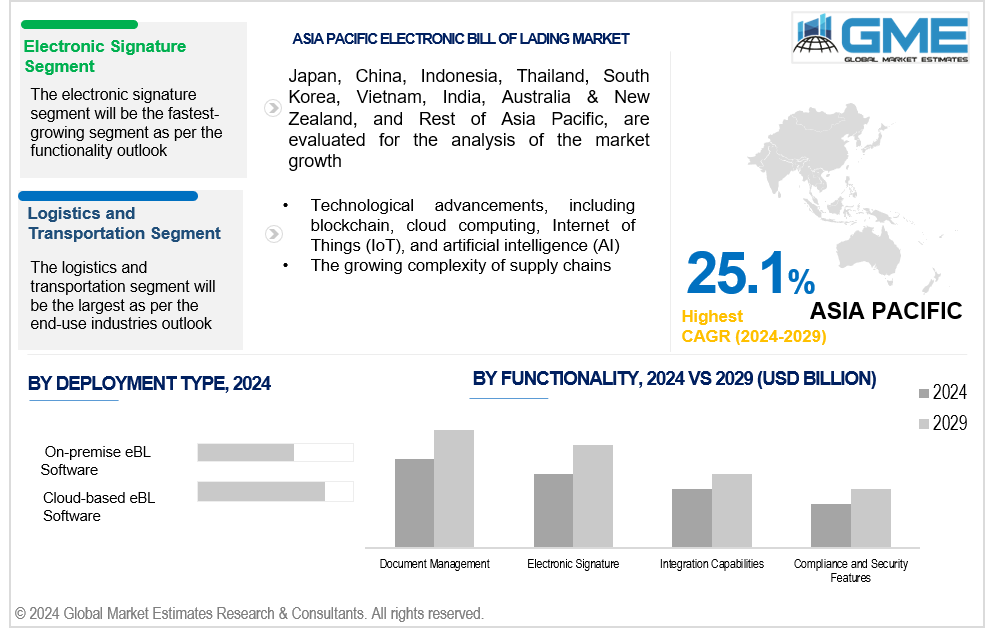
The electronic signature segment is expected to be the fastest-growing segment in the market from 2024-2029. Companies are utilizing electronic signatures for bill of lading (BL) operations more frequently due to technological developments in electronic signatures and the growing legal recognition of electronic signatures in trade documentation. Encouraging trust in electronic signatures is fostered by regulatory frameworks like the UNCITRAL Model Law on Electronic Signatures, which offer criteria for their legal validity and enforceability.
The logistics and transportation segment is expected to hold the largest share of the market over the forecast period. The logistics and transportation sector uses a lot of bill of lading (BL) documents as it deals with many shipments and transactions daily. Electronic solutions to handle BLs more effectively are growing increasingly in demand as the sector looks to modernize and optimize its operations.
The retail segment is anticipated to be the fastest-growing segment in the market from 2024-2029. The rapid growth of e-commerce has revolutionized retail supply chains, resulting in a surge in the requirement for streamlined and digitalized documentation procedures. Retailers are looking for electronic solutions to manage their shipments and expedite logistical processes, such as bill of lading (BL) issuing and management, as online retail grows globally.
The cloud-based eBL software segment is expected to hold the largest share of the market over the forecast period. Cloud cloud-based eBL software provides scalability and flexibility, enabling companies to scale up quickly or down operations in response to demand without having to make large infrastructure investments. Companies that experience seasonal swings in trade activity or volatility in cargo numbers can find this scalability very beneficial.
The on-premise eBL software segment is anticipated to be the fastest-growing segment in the market from 2024-2029. Greater flexibility for customization and design to match the unique demands and requirements of particular firms is available with on-premise eBL software solutions. Companies can alter the software to suit their workflows, procedures, and legal requirements, guaranteeing a smoother connection with current operations and systems.
North America is expected to be the largest region in the global market. North American electronic bill of lading market is being driven by the government's regulatory supports. For instance, the use of electronic paperwork, including electronic bills of lading, is encouraged by regulatory frameworks and initiatives like the Automated Commercial Environment (ACE) in the United States and the eManifest program in Canada to improve trade facilitation and speed up customs clearing procedures.
Asia Pacific is anticipated to witness rapid growth during the forecast period. The increasing exports from Asian countries drive the Asia Pacific region's electronic bill of lading market. The conventional paper-based bill of lading procedure grows laborious and time-consuming as export quantities from Asian nations rise. Electronic bill of lading solutions can streamline the documentation process and eliminate paperwork, manual errors, and processing times. This effectiveness is essential for efficiently managing the increasing export volumes. For instance, about 7.1 billion tons, or 64% of all products exported globally, were received by Asian ports in 2021, according to UNCTAD.
Vector, Bolero, E-Tiles, SmartBOL, essDOCS, edoxOnline, TruckLogics, Transflo, WaveBL and Seatech EDOC, among others, are some of the key players operating in the global electronic bill of lading market.
Please note: This is not an exhaustive list of companies profiled in the report.
In August 2023, the Argentine Chamber of Commerce (CAC) and edoxOnline entered into a collaboration to enable Argentine exporters to issue eCOs (Electronic Certificates of Origin—COD-Mercosur/ALADI and Non-Preferential/Extra-Zone).
In April 2022, Bolero and HMM Co., LTD (HMM), one of the top container shipping companies in the world and the national flag carrier of South Korea, announced their partnership to implement the electronic bill of lading.
1 STRATEGIC INSIGHTS ON NEW REVENUE POCKETS
1.1 Strategic Opportunity & Attractiveness Analysis
1.1.1 Hot Revenue Pockets
1.1.2 Market Attractiveness Score
1.1.3 Revenue Impacting Opportunity
1.1.4 High Growing Region/Country
1.1.5 Competitor Analysis
1.1.6 Consumer Analysis
1.2 Global Market Estimates' View
1.3 Strategic Insights across Business Functions
1.3.1 For Chief Executive Officers
1.3.2 For Chief Marketing Officers
1.3.3 For Chief Strategy Officers
1.4 Evaluate the Potential of your Existing Business Lines vs. New Lines to Enter Into
2 TECHNOLOGICAL TRENDS
2.1 Technological Adoption Rate
2.2 Current Trend Impact Analysis
2.3 Future Trend Impact Analysis
3 GLOBAL ELECTRONIC BILL OF LADING MARKET OUTLOOK
3.1 Market Pyramid Analysis
3.1.1 Introduction
3.1.2 Adjacent Market Opportunities
3.1.3 Ancillary Market Opportunities
3.2 Demand Side Analysis
3.2.1 Market Drivers: Impact Analysis
3.2.2 Market Restraints: Impact Analysis
3.2.3 Market Opportunities: Impact Analysis
3.2.4 Market Challenges: Impact Analysis
3.3 Supply Side Analysis
3.3.1 Porter’s Five Forces Analysis
3.3.1.1 Threat of New Entrants
3.3.1.2 Threat of New Substitutes
3.3.1.3 Bargaining Power of Suppliers
3.3.1.4 Bargaining Power of Buyers
3.3.1.5 Intensity of Competitive Rivalry
3.3.2 SWOT Analysis; By Factor (Political & Legal, Economic, and Technological)
3.3.2.1 Political Landscape
3.3.2.2 Economic Landscape
3.3.2.3 Social Landscape
3.3.2.4 Technology Landscape
3.3.3 Value Chain Analysis
3.3.4 Trend Analysis
3.3.5 Gap Analysis
3.3.6 Cost Analysis
4 GLOBAL ELECTRONIC BILL OF LADING MARKET, BY FUNCTIONALITY
4.1 Introduction
4.2 Electronic Bill of Lading Market: Functionality Scope Key Takeaways
4.3 Revenue Growth Analysis, 2023 & 2029
4.4 Document Management
4.4.1 Document Management Market Estimates and Forecast, 2021-2029 (USD Million)
4.5 Electronic Signature
4.5.1 Electronic Signature Market Estimates and Forecast, 2021-2029 (USD Million)
4.6 Integration Capabilities
4.6.1 Integration Capabilities Market Estimates and Forecast, 2021-2029 (USD Million)
4.7 Compliance and Security Features
4.7.1 Compliance and Security Features Market Estimates and Forecast, 2021-2029 (USD Million)
5 GLOBAL ELECTRONIC BILL OF LADING MARKET, BY END-USE INDUSTRIES
5.1 Introduction
5.2 Electronic Bill of Lading Market: End-use Industries Scope Key Takeaways
5.3 Revenue Growth Analysis, 2023 & 2029
5.4 Manufacturing
5.4.1 Manufacturing Market Estimates and Forecast, 2021-2029 (USD Million)
5.5 Logistics and Transportation
5.5.1 Logistics and Transportation Market Estimates and Forecast, 2021-2029 (USD Million)
5.6 Retail
5.6.1 Retail Market Estimates and Forecast, 2021-2029 (USD Million)
5.7 Healthcare
5.7.1 Healthcare Market Estimates and Forecast, 2021-2029 (USD Million)
5.8 Others
5.8.1 Others Market Estimates and Forecast, 2021-2029 (USD Million)
6 GLOBAL ELECTRONIC BILL OF LADING MARKET, BY DEPLOYMENT TYPE
6.1 Introduction
6.2 Electronic Bill of Lading Market: Deployment Type Scope Key Takeaways
6.3 Revenue Growth Analysis, 2023 & 2029
6.4 Cloud-based eBL Software
6.4.1 Cloud-based eBL Software Market Estimates and Forecast, 2021-2029 (USD Million)
6.5 On-premise eBL Software
6.5.1 On-premise eBL Software Market Estimates and Forecast, 2021-2029 (USD Million)
7 GLOBAL ELECTRONIC BILL OF LADING MARKET, BY REGION
7.1 Introduction
7.2 North America Electronic Bill of Lading Market Estimates and Forecast, 2021-2029 (USD Million)
7.2.1 By Functionality
7.2.2 By End-use Industries
7.2.3 By Deployment Type
7.2.4 By Country
7.2.4.1 U.S. Electronic Bill of Lading Market Estimates and Forecast, 2021-2029 (USD Million)
7.2.4.1.1 By Functionality
7.2.4.1.2 By End-use Industries
7.2.4.1.3 By Deployment Type
7.2.4.2 Canada Electronic Bill of Lading Market Estimates and Forecast, 2021-2029 (USD Million)
7.2.4.2.1 By Functionality
7.2.4.2.2 By End-use Industries
7.2.4.2.3 By Deployment Type
7.2.4.3 Mexico Electronic Bill of Lading Market Estimates and Forecast, 2021-2029 (USD Million)
7.2.4.3.1 By Functionality
7.2.4.3.2 By End-use Industries
7.2.4.3.3 By Deployment Type
7.3 Europe Electronic Bill of Lading Market Estimates and Forecast, 2021-2029 (USD Million)
7.3.1 By Functionality
7.3.2 By End-use Industries
7.3.3 By Deployment Type
7.3.4 By Country
7.3.4.1 Germany Electronic Bill of Lading Market Estimates and Forecast, 2021-2029 (USD Million)
7.3.4.1.1 By Functionality
7.3.4.1.2 By End-use Industries
7.3.4.1.3 By Deployment Type
7.3.4.2 U.K. Electronic Bill of Lading Market Estimates and Forecast, 2021-2029 (USD Million)
7.3.4.2.1 By Functionality
7.3.4.2.2 By End-use Industries
7.3.4.2.3 By Deployment Type
7.3.4.3 France Electronic Bill of Lading Market Estimates and Forecast, 2021-2029 (USD Million)
7.3.4.3.1 By Functionality
7.3.4.3.2 By End-use Industries
7.3.4.3.3 By Deployment Type
7.3.4.4 Italy Electronic Bill of Lading Market Estimates and Forecast, 2021-2029 (USD Million)
7.3.4.4.1 By Functionality
7.3.4.4.2 By End-use Industries
7.2.4.4.3 By Deployment Type
7.3.4.5 Spain Electronic Bill of Lading Market Estimates and Forecast, 2021-2029 (USD Million)
7.3.4.5.1 By Functionality
7.3.4.5.2 By End-use Industries
7.2.4.5.3 By Deployment Type
7.3.4.6 Netherlands Electronic Bill of Lading Market Estimates and Forecast, 2021-2029 (USD Million)
7.3.4.6.1 By Functionality
7.3.4.6.2 By End-use Industries
7.2.4.6.3 By Deployment Type
7.3.4.7 Rest of Europe Electronic Bill of Lading Market Estimates and Forecast, 2021-2029 (USD Million)
7.3.4.7.1 By Functionality
7.3.4.7.2 By End-use Industries
7.2.4.7.3 By Deployment Type
7.4 Asia Pacific Electronic Bill of Lading Market Estimates and Forecast, 2021-2029 (USD Million)
7.4.1 By Functionality
7.4.2 By End-use Industries
7.4.3 By Deployment Type
7.4.4 By Country
7.4.4.1 China Electronic Bill of Lading Market Estimates and Forecast, 2021-2029 (USD Million)
7.4.4.1.1 By Functionality
7.4.4.1.2 By End-use Industries
7.4.4.1.3 By Deployment Type
7.4.4.2 Japan Electronic Bill of Lading Market Estimates and Forecast, 2021-2029 (USD Million)
7.4.4.2.1 By Functionality
7.4.4.2.2 By End-use Industries
7.4.4.2.3 By Deployment Type
7.4.4.3 India Electronic Bill of Lading Market Estimates and Forecast, 2021-2029 (USD Million)
7.4.4.3.1 By Functionality
7.4.4.3.2 By End-use Industries
7.4.4.3.3 By Deployment Type
7.4.4.4 South Korea Electronic Bill of Lading Market Estimates and Forecast, 2021-2029 (USD Million)
7.4.4.4.1 By Functionality
7.4.4.4.2 By End-use Industries
7.4.4.4.3 By Deployment Type
7.4.4.5 Singapore Electronic Bill of Lading Market Estimates and Forecast, 2021-2029 (USD Million)
7.4.4.5.1 By Functionality
7.4.4.5.2 By End-use Industries
7.4.4.5.3 By Deployment Type
7.4.4.6 Malaysia Electronic Bill of Lading Market Estimates and Forecast, 2021-2029 (USD Million)
7.4.4.6.1 By Functionality
7.4.4.6.2 By End-use Industries
7.4.4.6.3 By Deployment Type
7.4.4.7 Thailand Electronic Bill of Lading Market Estimates and Forecast, 2021-2029 (USD Million)
7.4.4.7.1 By Functionality
7.4.4.7.2 By End-use Industries
7.4.4.7.3 By Deployment Type
7.4.4.8 Indonesia Electronic Bill of Lading Market Estimates and Forecast, 2021-2029 (USD Million)
7.4.4.8.1 By Functionality
7.4.4.8.2 By End-use Industries
7.4.4.8.3 By Deployment Type
7.4.4.9 Vietnam Electronic Bill of Lading Market Estimates and Forecast, 2021-2029 (USD Million)
7.4.4.9.1 By Functionality
7.4.4.9.2 By End-use Industries
7.4.4.9.3 By Deployment Type
7.4.4.10 Taiwan Electronic Bill of Lading Market Estimates and Forecast, 2021-2029 (USD Million)
7.4.4.10.1 By Functionality
7.4.4.10.2 By End-use Industries
7.4.4.10.3 By Deployment Type
7.4.4.11 Rest of Asia Pacific Electronic Bill of Lading Market Estimates and Forecast, 2021-2029 (USD Million)
7.4.4.11.1 By Functionality
7.4.4.11.2 By End-use Industries
7.4.4.11.3 By Deployment Type
7.5 Middle East and Africa Electronic Bill of Lading Market Estimates and Forecast, 2021-2029 (USD Million)
7.5.1 By Functionality
7.5.2 By End-use Industries
7.5.3 By Deployment Type
7.5.4 By Country
7.5.4.1 Saudi Arabia Electronic Bill of Lading Market Estimates and Forecast, 2021-2029 (USD Million)
7.5.4.1.1 By Functionality
7.5.4.1.2 By End-use Industries
7.5.4.1.3 By Deployment Type
7.5.4.2 U.A.E. Electronic Bill of Lading Market Estimates and Forecast, 2021-2029 (USD Million)
7.5.4.2.1 By Functionality
7.5.4.2.2 By End-use Industries
7.5.4.2.3 By Deployment Type
7.5.4.3 Israel Electronic Bill of Lading Market Estimates and Forecast, 2021-2029 (USD Million)
7.5.4.3.1 By Functionality
7.5.4.3.2 By End-use Industries
7.5.4.3.3 By Deployment Type
7.5.4.4 South Africa Electronic Bill of Lading Market Estimates and Forecast, 2021-2029 (USD Million)
7.5.4.4.1 By Functionality
7.5.4.4.2 By End-use Industries
7.5.4.4.3 By Deployment Type
7.5.4.5 Rest of Middle East and Africa Electronic Bill of Lading Market Estimates and Forecast, 2021-2029 (USD Million)
7.5.4.5.1 By Functionality
7.5.4.5.2 By End-use Industries
7.5.4.5.2 By Deployment Type
7.6 Central and South America Electronic Bill of Lading Market Estimates and Forecast, 2021-2029 (USD Million)
7.6.1 By Functionality
7.6.2 By End-use Industries
7.6.3 By Deployment Type
7.6.4 By Country
7.6.4.1 Brazil Electronic Bill of Lading Market Estimates and Forecast, 2021-2029 (USD Million)
7.6.4.1.1 By Functionality
7.6.4.1.2 By End-use Industries
7.6.4.1.3 By Deployment Type
7.6.4.2 Argentina Electronic Bill of Lading Market Estimates and Forecast, 2021-2029 (USD Million)
7.6.4.2.1 By Functionality
7.6.4.2.2 By End-use Industries
7.6.4.2.3 By Deployment Type
7.6.4.3 Chile Electronic Bill of Lading Market Estimates and Forecast, 2021-2029 (USD Million)
7.6.4.3.1 By Functionality
7.6.4.3.2 By End-use Industries
7.6.4.3.3 By Deployment Type
7.6.4.4 Rest of Central and South America Electronic Bill of Lading Market Estimates and Forecast, 2021-2029 (USD Million)
7.6.4.4.1 By Functionality
7.6.4.4.2 By End-use Industries
7.6.4.4.3 By Deployment Type
8 COMPETITIVE LANDCAPE
8.1 Company Market Share Analysis
8.2 Four Quadrant Positioning Matrix
8.2.1 Market Leaders
8.2.2 Market Visionaries
8.2.3 Market Challengers
8.2.4 Niche Market Players
8.3 Vendor Landscape
8.3.1 North America
8.3.2 Europe
8.3.3 Asia Pacific
8.3.4 Rest of the World
8.4 Company Profiles
8.4.1 Vector
8.4.1.1 Business Description & Financial Analysis
8.4.1.2 SWOT Analysis
8.4.1.3 Products & Services Offered
8.4.1.4 Strategic Alliances between Business Partners
8.4.2 Bolero
8.4.2.1 Business Description & Financial Analysis
8.4.2.2 SWOT Analysis
8.4.2.3 Products & Services Offered
8.4.2.4 Strategic Alliances between Business Partners
8.4.3 E-Tiles
8.4.3.1 Business Description & Financial Analysis
8.4.3.2 SWOT Analysis
8.4.3.3 Products & Services Offered
8.4.3.4 Strategic Alliances between Business Partners
8.4.4 SmartBOL
8.4.4.1 Business Description & Financial Analysis
8.4.4.2 SWOT Analysis
8.4.4.3 Products & Services Offered
8.4.4.4 Strategic Alliances between Business Partners
8.4.5 EssDOCS
8.4.5.1 Business Description & Financial Analysis
8.4.5.2 SWOT Analysis
8.4.5.3 Products & Services Offered
8.4.5.4 Strategic Alliances between Business Partners
8.4.6 EDOXONLINE
8.4.6.1 Business Description & Financial Analysis
8.4.6.2 SWOT Analysis
8.4.6.3 Products & Services Offered
8.4.6.4 Strategic Alliances between Business Partners
8.4.7 TruckLogics
8.4.7.1 Business Description & Financial Analysis
8.4.7.2 SWOT Analysis
8.4.7.3 Products & Services Offered
8.4.8.4 Strategic Alliances between Business Partners
8.4.8 Transflo
8.4.8.1 Business Description & Financial Analysis
8.4.8.2 SWOT Analysis
8.4.8.3 Products & Services Offered
8.4.8.4 Strategic Alliances between Business Partners
8.4.9 WaveBL
8.4.9.1 Business Description & Financial Analysis
8.4.9.2 SWOT Analysis
8.4.9.3 Products & Services Offered
8.4.9.4 Strategic Alliances between Business Partners
8.4.10 Seatech EDOC
8.4.10.1 Business Description & Financial Analysis
8.4.10.2 SWOT Analysis
8.4.10.3 Products & Services Offered
8.4.10.4 Strategic Alliances between Business Partners
8.4.11 Other Companies
8.4.11.1 Business Description & Financial Analysis
8.4.11.2 SWOT Analysis
8.4.11.3 Products & Services Offered
8.4.11.4 Strategic Alliances between Business Partners
9 RESEARCH METHODOLOGY
9.1 Market Introduction
9.1.1 Market Definition
9.1.2 Market Scope & Segmentation
9.2 Information Procurement
9.2.1 Secondary Research
9.2.1.1 Purchased Databases
9.2.1.2 GMEs Internal Data Repository
9.2.1.3 Secondary Resources & Third Party Perspectives
9.2.1.4 Company Information Sources
9.2.2 Primary Research
9.2.2.1 Various Types of Respondents for Primary Interviews
9.2.2.2 Number of Interviews Conducted throughout the Research Process
9.2.2.3 Primary Stakeholders
9.2.2.4 Discussion Guide for Primary Participants
9.2.3 Expert Panels
9.2.3.1 Expert Panels Across 30+ Industry
9.2.4 Paid Local Experts
9.2.4.1 Paid Local Experts Across 30+ Industry Across each Region
9.3 Market Estimation
9.3.1 Top-Down Approach
9.3.1.1 Macro-Economic Indicators Considered
9.3.1.2 Micro-Economic Indicators Considered
9.3.2 Bottom Up Approach
9.3.2.1 Company Share Analysis Approach
9.3.2.2 Estimation of Potential Functionality Sales
9.4 Data Triangulation
9.4.1 Data Collection
9.4.2 Time Series, Cross Sectional & Panel Data Analysis
9.4.3 Cluster Analysis
9.5 Analysis and Output
9.5.1 Inhouse AI Based Real Time Analytics Tool
9.5.2 Output From Desk & Primary Research
9.6 Research Assumptions & Limitations
9.7.1 Research Assumptions
9.7.2 Research Limitations
LIST OF TABLES
1 Global Electronic Bill of Lading Market, By Functionality, 2021-2029 (USD Mllion)
2 Document Management Market, By Region, 2021-2029 (USD Mllion)
3 Electronic Signature Market, By Region, 2021-2029 (USD Mllion)
4 Integration Capabilities Market, By Region, 2021-2029 (USD Mllion)
5 Compliance and Security Features Market, By Region, 2021-2029 (USD Mllion)
6 Global Electronic Bill of Lading Market, By End-use Industries, 2021-2029 (USD Mllion)
7 Manufacturing Market, By Region, 2021-2029 (USD Mllion)
8 Logistics and Transportation Market, By Region, 2021-2029 (USD Mllion)
9 Retail Market, By Region, 2021-2029 (USD Mllion)
10 Healthcare Market, By Region, 2021-2029 (USD Mllion)
11 Others Market, By Region, 2021-2029 (USD Mllion)
12 Global Electronic Bill of Lading Market, By Deployment Type, 2021-2029 (USD Mllion)
13 Cloud-based eBL Software Market, By Region, 2021-2029 (USD Mllion)
14 On-premise eBL Software Market, By Region, 2021-2029 (USD Mllion)
15 Regional Analysis, 2021-2029 (USD Mllion)
16 North America Electronic Bill of Lading Market, By Functionality, 2021-2029 (USD Million)
17 North America Electronic Bill of Lading Market, By End-use Industries, 2021-2029 (USD Million)
18 North America Electronic Bill of Lading Market, By Deployment Type, 2021-2029 (USD Million)
19 North America Electronic Bill of Lading Market, By Country, 2021-2029 (USD Million)
20 U.S Electronic Bill of Lading Market, By Functionality, 2021-2029 (USD Million)
21 U.S Electronic Bill of Lading Market, By End-use Industries, 2021-2029 (USD Million)
22 U.S Electronic Bill of Lading Market, By Deployment Type, 2021-2029 (USD Million)
23 Canada Electronic Bill of Lading Market, By Functionality, 2021-2029 (USD Million)
24 Canada Electronic Bill of Lading Market, By End-use Industries, 2021-2029 (USD Million)
25 Canada Electronic Bill of Lading Market, By Deployment Type, 2021-2029 (USD Million)
26 Mexico Electronic Bill of Lading Market, By Functionality, 2021-2029 (USD Million)
27 Mexico Electronic Bill of Lading Market, By End-use Industries, 2021-2029 (USD Million)
28 Mexico Electronic Bill of Lading Market, By Deployment Type, 2021-2029 (USD Million)
29 Europe Electronic Bill of Lading Market, By Functionality, 2021-2029 (USD Million)
30 Europe Electronic Bill of Lading Market, By End-use Industries, 2021-2029 (USD Million)
31 Europe Electronic Bill of Lading Market, By Deployment Type, 2021-2029 (USD Million)
32 Europe Electronic Bill of Lading Market, By Country 2021-2029 (USD Million)
33 Germany Electronic Bill of Lading Market, By Functionality, 2021-2029 (USD Million)
34 Germany Electronic Bill of Lading Market, By End-use Industries, 2021-2029 (USD Million)
35 Germany Electronic Bill of Lading Market, By Deployment Type, 2021-2029 (USD Million)
36 U.K Electronic Bill of Lading Market, By Functionality, 2021-2029 (USD Million)
37 U.K Electronic Bill of Lading Market, By End-use Industries, 2021-2029 (USD Million)
38 U.K Electronic Bill of Lading Market, By Deployment Type, 2021-2029 (USD Million)
39 France Electronic Bill of Lading Market, By Functionality, 2021-2029 (USD Million)
40 France Electronic Bill of Lading Market, By End-use Industries, 2021-2029 (USD Million)
41 France Electronic Bill of Lading Market, By Deployment Type, 2021-2029 (USD Million)
42 Italy Electronic Bill of Lading Market, By Functionality, 2021-2029 (USD Million)
43 Italy Electronic Bill of Lading Market, By End-use Industries, 2021-2029 (USD Million)
44 Italy Electronic Bill of Lading Market, By Deployment Type, 2021-2029 (USD Million)
45 Spain Electronic Bill of Lading Market, By Functionality, 2021-2029 (USD Million)
46 Spain Electronic Bill of Lading Market, By End-use Industries, 2021-2029 (USD Million)
47 Spain Electronic Bill of Lading Market, By Deployment Type, 2021-2029 (USD Million)
48 Netherlands Electronic Bill of Lading Market, By Functionality, 2021-2029 (USD Million)
49 Netherlands Electronic Bill of Lading Market, By End-use Industries, 2021-2029 (USD Million)
50 Netherlands Electronic Bill of Lading Market, By Deployment Type, 2021-2029 (USD Million)
51 Rest Of Europe Electronic Bill of Lading Market, By Functionality, 2021-2029 (USD Million)
52 Rest Of Europe Electronic Bill of Lading Market, By End-use Industries, 2021-2029 (USD Million)
53 Rest of Europe Electronic Bill of Lading Market, By Deployment Type, 2021-2029 (USD Million)
54 Asia Pacific Electronic Bill of Lading Market, By Functionality, 2021-2029 (USD Million)
55 Asia Pacific Electronic Bill of Lading Market, By End-use Industries, 2021-2029 (USD Million)
56 Asia Pacific Electronic Bill of Lading Market, By Deployment Type, 2021-2029 (USD Million)
57 Asia Pacific Electronic Bill of Lading Market, By Country, 2021-2029 (USD Million)
58 China Electronic Bill of Lading Market, By Functionality, 2021-2029 (USD Million)
59 China Electronic Bill of Lading Market, By End-use Industries, 2021-2029 (USD Million)
60 China Electronic Bill of Lading Market, By Deployment Type, 2021-2029 (USD Million)
61 India Electronic Bill of Lading Market, By Functionality, 2021-2029 (USD Million)
62 India Electronic Bill of Lading Market, By End-use Industries, 2021-2029 (USD Million)
63 India Electronic Bill of Lading Market, By Deployment Type, 2021-2029 (USD Million)
64 Japan Electronic Bill of Lading Market, By Functionality, 2021-2029 (USD Million)
65 Japan Electronic Bill of Lading Market, By End-use Industries, 2021-2029 (USD Million)
66 Japan Electronic Bill of Lading Market, By Deployment Type, 2021-2029 (USD Million)
67 South Korea Electronic Bill of Lading Market, By Functionality, 2021-2029 (USD Million)
68 South Korea Electronic Bill of Lading Market, By End-use Industries, 2021-2029 (USD Million)
69 South Korea Electronic Bill of Lading Market, By Deployment Type, 2021-2029 (USD Million)
70 malaysia Electronic Bill of Lading Market, By Functionality, 2021-2029 (USD Million)
71 malaysia Electronic Bill of Lading Market, By End-use Industries, 2021-2029 (USD Million)
72 malaysia Electronic Bill of Lading Market, By Deployment Type, 2021-2029 (USD Million)
73 Thailand Electronic Bill of Lading Market, By Functionality, 2021-2029 (USD Million)
74 Thailand Electronic Bill of Lading Market, By End-use Industries, 2021-2029 (USD Million)
75 Thailand Electronic Bill of Lading Market, By Deployment Type, 2021-2029 (USD Million)
76 Indonesia Electronic Bill of Lading Market, By Functionality, 2021-2029 (USD Million)
77 Indonesia Electronic Bill of Lading Market, By End-use Industries, 2021-2029 (USD Million)
78 Indonesia Electronic Bill of Lading Market, By Deployment Type, 2021-2029 (USD Million)
79 Vietnam Electronic Bill of Lading Market, By Functionality, 2021-2029 (USD Million)
80 Vietnam Electronic Bill of Lading Market, By End-use Industries, 2021-2029 (USD Million)
81 Vietnam Electronic Bill of Lading Market, By Deployment Type, 2021-2029 (USD Million)
82 Taiwan Electronic Bill of Lading Market, By Functionality, 2021-2029 (USD Million)
83 Taiwan Electronic Bill of Lading Market, By End-use Industries, 2021-2029 (USD Million)
84 Taiwan Electronic Bill of Lading Market, By Deployment Type, 2021-2029 (USD Million)
85 Rest of Asia Pacific Electronic Bill of Lading Market, By Functionality, 2021-2029 (USD Million)
86 Rest of Asia Pacific Electronic Bill of Lading Market, By End-use Industries, 2021-2029 (USD Million)
87 Rest of Asia Pacific Electronic Bill of Lading Market, By Deployment Type, 2021-2029 (USD Million)
88 Middle East and Africa Electronic Bill of Lading Market, By Functionality, 2021-2029 (USD Million)
89 Middle East and Africa Electronic Bill of Lading Market, By End-use Industries, 2021-2029 (USD Million)
90 Middle East and Africa Electronic Bill of Lading Market, By Deployment Type, 2021-2029 (USD Million)
91 Middle East and Africa Electronic Bill of Lading Market, By Country, 2021-2029 (USD Million)
92 Saudi Arabia Electronic Bill of Lading Market, By Functionality, 2021-2029 (USD Million)
93 Saudi Arabia Electronic Bill of Lading Market, By End-use Industries, 2021-2029 (USD Million)
94 Saudi Arabia Electronic Bill of Lading Market, By Deployment Type, 2021-2029 (USD Million)
95 UAE Electronic Bill of Lading Market, By Functionality, 2021-2029 (USD Million)
96 UAE Electronic Bill of Lading Market, By End-use Industries, 2021-2029 (USD Million)
97 UAE Electronic Bill of Lading Market, By Deployment Type, 2021-2029 (USD Million)
98 Israel Electronic Bill of Lading Market, By Functionality, 2021-2029 (USD Million)
99 Israel Electronic Bill of Lading Market, By End-use Industries, 2021-2029 (USD Million)
100 Israel Electronic Bill of Lading Market, By Deployment Type, 2021-2029 (USD Million)
101 South Africa Electronic Bill of Lading Market, By Functionality, 2021-2029 (USD Million)
102 South Africa Electronic Bill of Lading Market, By End-use Industries, 2021-2029 (USD Million)
103 South Africa Electronic Bill of Lading Market, By Deployment Type, 2021-2029 (USD Million)
104 Rest of Middle East and Africa Electronic Bill of Lading Market, By Functionality, 2021-2029 (USD Million)
105 Rest of Middle East and Africa Electronic Bill of Lading Market, By End-use Industries, 2021-2029 (USD Million)
106 Rest of Middle East and Africa Electronic Bill of Lading Market, By Deployment Type, 2021-2029 (USD Million)
107 Central and South America Electronic Bill of Lading Market, By Functionality, 2021-2029 (USD Million)
108 Central and South America Electronic Bill of Lading Market, By End-use Industries, 2021-2029 (USD Million)
109 Central and South America Electronic Bill of Lading Market, By Deployment Type, 2021-2029 (USD Million)
110 Central and South America Electronic Bill of Lading Market, By Country, 2021-2029 (USD Million)
111 Brazil Electronic Bill of Lading Market, By Functionality, 2021-2029 (USD Million)
112 Brazil Electronic Bill of Lading Market, By End-use Industries, 2021-2029 (USD Million)
113 Brazil Electronic Bill of Lading Market, By Deployment Type, 2021-2029 (USD Million)
114 Argentina Electronic Bill of Lading Market, By Functionality, 2021-2029 (USD Million)
115 Argentina Electronic Bill of Lading Market, By End-use Industries, 2021-2029 (USD Million)
116 Argentina Electronic Bill of Lading Market, By Deployment Type, 2021-2029 (USD Million)
117 Chile Electronic Bill of Lading Market, By Functionality, 2021-2029 (USD Million)
118 Chile Electronic Bill of Lading Market, By End-use Industries, 2021-2029 (USD Million)
119 Chile Electronic Bill of Lading Market, By Deployment Type, 2021-2029 (USD Million)
120 Rest of Central and South America Electronic Bill of Lading Market, By Functionality, 2021-2029 (USD Million)
121 Rest of Central and South America Electronic Bill of Lading Market, By End-use Industries, 2021-2029 (USD Million)
122 Rest of Central and South America Electronic Bill of Lading Market, By Deployment Type, 2021-2029 (USD Million)
123 Vector: Products & Services Offering
124 Bolero: Products & Services Offering
125 E-Tiles: Products & Services Offering
126 SmartBOL: Products & Services Offering
127 EssDOCS: Products & Services Offering
128 EDOXONLINE: Products & Services Offering
129 TruckLogics : Products & Services Offering
130 Transflo: Products & Services Offering
131 WaveBL, Inc: Products & Services Offering
132 Seatech EDOC: Products & Services Offering
133 Other Companies: Products & Services Offering
LIST OF FIGURES
1 Global Electronic Bill of Lading Market Overview
2 Global Electronic Bill of Lading Market Value From 2021-2029 (USD Mllion)
3 Global Electronic Bill of Lading Market Share, By Functionality (2023)
4 Global Electronic Bill of Lading Market Share, By End-use Industries (2023)
5 Global Electronic Bill of Lading Market Share, By Deployment Type (2023)
6 Global Electronic Bill of Lading Market, By Region (Asia Pacific Market)
7 Technological Trends In Global Electronic Bill of Lading Market
8 Four Quadrant Competitor Positioning Matrix
9 Impact Of Macro & Micro Indicators On The Market
10 Impact Of Key Drivers On The Global Electronic Bill of Lading Market
11 Impact Of Challenges On The Global Electronic Bill of Lading Market
12 Porter’s Five Forces Analysis
13 Global Electronic Bill of Lading Market: By Functionality Scope Key Takeaways
14 Global Electronic Bill of Lading Market, By Functionality Segment: Revenue Growth Analysis
15 Document Management Market, By Region, 2021-2029 (USD Mllion)
16 Electronic Signature Market, By Region, 2021-2029 (USD Mllion)
17 Integration Capabilities Market, By Region, 2021-2029 (USD Mllion)
18 Compliance and Security Features Market, By Region, 2021-2029 (USD Mllion)
19 Global Electronic Bill of Lading Market: By End-use Industries Scope Key Takeaways
20 Global Electronic Bill of Lading Market, By End-use Industries Segment: Revenue Growth Analysis
21 Manufacturing Market, By Region, 2021-2029 (USD Mllion)
22 Logistics and Transportation Market, By Region, 2021-2029 (USD Mllion)
23 Retail Market, By Region, 2021-2029 (USD Mllion)
24 Healthcare Market, By Region, 2021-2029 (USD Mllion)
25 Others Market, By Region, 2021-2029 (USD Mllion)
26 Global Electronic Bill of Lading Market: By Deployment Type Scope Key Takeaways
27 Global Electronic Bill of Lading Market, By Deployment Type Segment: Revenue Growth Analysis
28 Cloud-based eBL Software Market, By Region, 2021-2029 (USD Mllion)
29 On-premise eBL Software Market, By Region, 2021-2029 (USD Mllion)
30 Regional Segment: Revenue Growth Analysis
31 Global Electronic Bill of Lading Market: Regional Analysis
32 North America Electronic Bill of Lading Market Overview
33 North America Electronic Bill of Lading Market, By Functionality
34 North America Electronic Bill of Lading Market, By End-use Industries
35 North America Electronic Bill of Lading Market, By Deployment Type
36 North America Electronic Bill of Lading Market, By Country
37 U.S. Electronic Bill of Lading Market, By Functionality
38 U.S. Electronic Bill of Lading Market, By End-use Industries
39 U.S. Electronic Bill of Lading Market, By Deployment Type
40 Canada Electronic Bill of Lading Market, By Functionality
41 Canada Electronic Bill of Lading Market, By End-use Industries
42 Canada Electronic Bill of Lading Market, By Deployment Type
43 Mexico Electronic Bill of Lading Market, By Functionality
44 Mexico Electronic Bill of Lading Market, By End-use Industries
45 Mexico Electronic Bill of Lading Market, By Deployment Type
46 Four Quadrant Positioning Matrix
47 Company Market Share Analysis
48 Vector: Company Snapshot
49 Vector: SWOT Analysis
50 Vector: Geographic Presence
51 Bolero: Company Snapshot
52 Bolero: SWOT Analysis
53 Bolero: Geographic Presence
54 E-Tiles: Company Snapshot
55 E-Tiles: SWOT Analysis
56 E-Tiles: Geographic Presence
57 SmartBOL: Company Snapshot
58 SmartBOL: Swot Analysis
59 SmartBOL: Geographic Presence
60 EssDOCS: Company Snapshot
61 EssDOCS: SWOT Analysis
62 EssDOCS: Geographic Presence
63 EDOXONLINE: Company Snapshot
64 EDOXONLINE: SWOT Analysis
65 EDOXONLINE: Geographic Presence
66 TruckLogics : Company Snapshot
67 TruckLogics : SWOT Analysis
68 TruckLogics : Geographic Presence
69 Transflo: Company Snapshot
70 Transflo: SWOT Analysis
71 Transflo: Geographic Presence
72 WaveBL, Inc.: Company Snapshot
73 WaveBL, Inc.: SWOT Analysis
74 WaveBL, Inc.: Geographic Presence
75 Seatech EDOC: Company Snapshot
76 Seatech EDOC: SWOT Analysis
77 Seatech EDOC: Geographic Presence
78 Other Companies: Company Snapshot
79 Other Companies: SWOT Analysis
80 Other Companies: Geographic Presence
The Global Electronic Bill of Lading Market has been studied from the year 2019 till 2029. However, the CAGR provided in the report is from the year 2024 to 2029. The research methodology involved three stages: Desk research, Primary research, and Analysis & Output from the entire research process.

The desk research involved a robust background study which meant referring to paid and unpaid databases to understand the market dynamics; mapping contracts from press releases; identifying the key players in the market, studying their product portfolio, competition level, annual reports/SEC filings & investor presentations; and learning the demand and supply-side analysis for the Electronic Bill of Lading Market.

The primary research activity included telephonic conversations with more than 50 tier 1 industry consultants, distributors, and end-use product manufacturers.

Finally, based on the above thorough research process, an in-depth analysis was carried out considering the following aspects: market attractiveness, current & future market trends, market share analysis, SWOT analysis of the company and customer analytics.

Frequently Asked Questions

This FREE sample includes market data points, ranging from trend analyses to market estimates & forecasts. See for yourself.
Or view our licence options:
Tailor made solutions just for you
80% of our clients seek made-to-order reports. How do you want us to tailor yours?
OUR CLIENTS


