This report was recently updated on August 27 2025 with the latest and most recent
market numbers
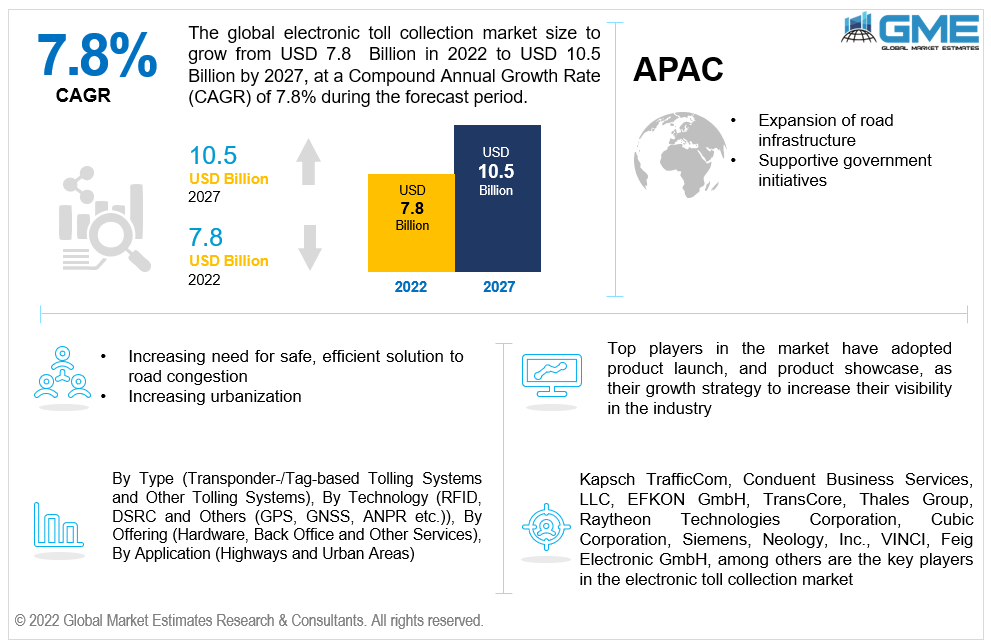
Global Electronic Toll Collection Market Size, Trends & Analysis - Forecasts to 2027 By Type (Transponder/Tag-Based Tolling Systems and Other Tolling Systems), By Technology (Radio Frequency Identification (RFID), Dedicated Short-Range Communication (DSRC) and Others (GPS, GNSS, ANPR)), By Offering (Hardware, Back Office and Other Services), By Application (Highways and Urban Areas), By Region (North America, Asia Pacific, CSA, Europe, and the Middle East and Africa), Competitive Landscape Company Market Share Analysis, and Competitor Analysis
The global electronic toll collection market is projected to grow from USD 7.8 billion in 2022 to USD 10.5 billion in 2027 at a CAGR value of 7.8% from 2022 to 2027.
The increased use of sophisticated technology in transportation systems, as well as a rise in the number of policy measures to expedite automatic toll collection, reduce congestion, collisions, and environmental damage, and convenience of cashless transactions, are some of the forces influencing the ETC market demand during the forecast period. ETC appears to be one of the options for reducing air pollution in many non-attainment locations, according to the Environmental Protection Agency (EPA).
ETC has developed to accommodate the digital era with technology that protects toll revenues. The capacity of this technology to improve consumer experiences through mobility, security, accessibility, and even assistance for a "greener" world through pollution reduction is propelling market expansion. Furthermore, the ability of ETC lanes to enhance traffic flow speed and performance while saving drivers time and the ability to charge a toll to an existing customer account digitally are accelerating market expansion.
ETC's better cash handling ability as it aids in enhanced audit control by centralizing user accounts and helps in payment adaptability, which allows consumers to pay their toll bills with cash, cheque, or even credit cards, is driving the market growth. Furthermore, increased data gathering such as vehicle count throughout the time of day, date, and time can be collected as a result of the deployment of this technology, which aids in toll providers to make pricing strategy decisions; is expected to fuel market expansion during the forecast period. However, the absence of proper road infrastructure and advanced technology in emerging economies could restrain the market growth of the electronic toll collection market.
The COVID-19 pandemic has negatively impacted the electronic toll collection market through its various lockdowns and restrictions. The global supply chain will disrupt as manufacturers of such involved transportation, automotive, and other industries face reduced supply of labor and other factors of production.
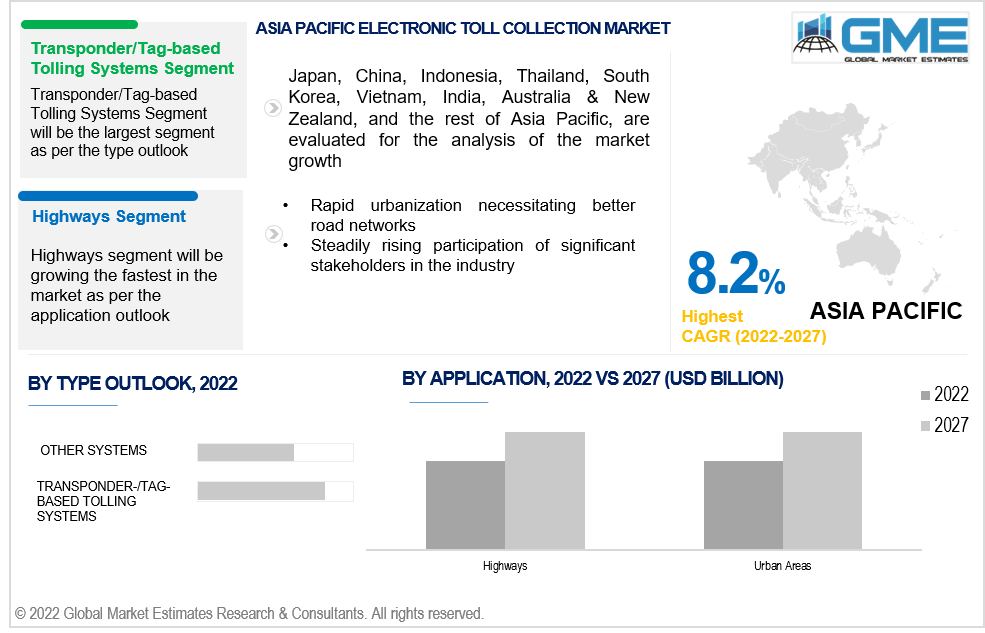
Based on the type, the electronic toll collection market is divided into transponder/tag-based tolling systems and other tolling systems. The transponder/tag-based tolling systems segment is expected to be the largest segment in the market from 2022 to 2027.
ETC, which uses a tag-based tolling system, provides a more precise solution for high-risk situations like traffic congestion, air pollution, and fuel usage. It also contributes to a healthier and more environmentally friendly atmosphere and a longer vehicle lifespan. ETC's tag-based tolling technology eliminates bottlenecks and ensures smooth traffic flow, resulting in segment growth.
Based on the technology, the electronic toll collection market is divided into radio frequency identification (RFID), dedicated short-range communication (DSRC), and others (GPS, GNSS, ANPR). The radio frequency identification (RFID) segment is expected to be the fastest-growing segment in the forecast period of 2022-2027. Radiofrequency identification (RFID) technology is extensively useful for ETC systems. RFID systems can deliver error-free, battery-free, and maintenance-free wireless data exchanges. Even under challenging conditions with a lot of pollution, dust, dampness, and severe temperatures, RFID systems can typically work. RFID tags are digitally programmed with unique data that fuels segment expansion.
Based on the offering segmentation, the electronic toll collection market is divided into hardware, back-office, and other services. The hardware segment is expected to be the fastest-growing segment in the forecast period of 2022-2027. The advancement in technology will boost the adoption of hardware-based electronic toll collection. Many electronic devices and computerized systems are being adopted to smooth functioning, such as an automated toll payment system.
Based on the application segmentation, the electronic toll collection market is divided into highways and urban areas. The highway segment is expected to be the fastest-growing segment in the forecast period of 2022-2027. Strong government measures project to add electronic toll collection options to existing toll plazas on highways, resulting in massive growth prospects for the ETC market for highway implementations. Also, governments worldwide are focusing on deploying electronic toll collecting systems on streets to assure stability and preserve the smooth flow of traffic.
As per the geographical analysis, the Electronic Toll Collection Market can be classified into North America (the United States, Canada, and Mexico), Asia Pacific (India, China, Japan, Malaysia, Singapore, and the Rest of Asia Pacific), Europe (Germany, United Kingdom, Italy, France, Spain, Netherlands, and Rest of Europe), Middle East & Africa (Saudi Arabia, United Arab Emirates, and Rest of the Middle East & Africa) and Central & South America (Brazil, Argentina, and Rest of Central and South America).
North America (the United States, Canada, and Mexico) will have a dominant share in the electronic toll collection market from 2022 to 2027. The major factor driving the growth of the market in the North American region is the presence of a high number of vehicles per household leading to a higher possibility of road congestion and environmental pollution. The region also has a large network of interstate and state highways that demand the use of such electronic toll collection. Several key players and manufacturers are also based out of this region boosting the market growth.
Moreover, the Asia Pacific (India, China, Japan, Malaysia, Singapore, and the Rest of Asia Pacific) region is expected to be the fastest-growing segment in the electronic toll collection market during the forecast period. The rapid expansion of road infrastructure and the presence of highly populated countries with high road congestion will boost the market growth. Several government initiatives supporting the adoption of such an electronic toll collection system and rapid urbanization necessitating better road networks are boosting the electronic toll collection system market in this region.
Kapsch TrafficCom, Conduent Business Services, LLC, EFKON GmbH, TransCore, Thales Group, Raytheon Technologies Corporation, Cubic Corporation, Siemens, Neology, Inc., VINCI, Feig Electronic GmbH, among others are the key players in the electronic toll collection market.
Please note: This is not an exhaustive list of companies profiled in the report.
Chapter 1 Methodology
1.1 Market Scope & Definitions
1.2 Estimates & Forecast Calculation
1.3 Historical Data Overview and Validation
1.4 Data Sources
1.4.1 Secondary
1.4.2 Primary
Chapter 2 Report Outlook
2.1 Global Electronic Toll Collection Market Industry Overview, 2022-2027
2.1.1 Industry Overview
2.1.2 Type Overview
2.1.3 Technology Overview
2.1.4 Offering Overview
2.1.5 Application Overview
2.1.6 Regional Overview
Chapter 3 Global Electronic Toll Collection Market Trends
3.1 Market Segmentation
3.2 Industry Background, 2022-2027
3.3 Market Key Trends
3.3.1 Positive Trends
3.3.1.1 Advancements in cashless payment technology
3.3.2 Industry Challenges
3.3.2.1 Lack of proper road infrastructure in emerging economies
3.4 Prospective Growth Scenario
3.4.1 Type Growth Scenario
3.4.2 Technology Growth Scenario
3.4.3 Offering Growth Scenario
3.4.4 Applications Growth Scenario
3.5 COVID-19 Influence over Industry Growth
3.6 Porter’s Analysis
3.7 PESTEL Analysis
3.8 Value Chain & Supply Chain Analysis
3.9 Regulatory Framework
3.9.1 North America
3.9.2 Europe
3.9.3 APAC
3.9.4 Central & South America
3.9.5 MEA
3.10 Materials Overview
3.11 Market Share Analysis, 2021
3.11.1 Company Positioning Overview, 2021
Chapter 4 Global Electronic Toll Collection Market, By Type
4.1 Type Outlook
4.2 Transponder-/Tag-based Tolling Systems
4.2.1 Market Size, By Region, 2022-2027 (USD Billion)
4.3 Other Tolling Systems
4.3.1 Market Size, By Region, 2022-2027 (USD Billion)
Chapter 5 Global Electronic Toll Collection Market, By Technology
5.1 Technology Outlook
5.2 RFID
5.2.1 Market Size, By Region, 2022-2027 (USD Billion)
5.3 DSRC
5.3.1 Market Size, By Region, 2022-2027 (USD Billion)
5.4 Others (GPS, GNSS, ANPR etc.)
5.4.1 Market Size, By Region, 2022-2027 (USD Billion)
Chapter 6 Global Electronic Toll Collection Market, By Offering
6.1 Hardware
6.1.1 Market Size, By Region, 2022-2027 (USD Billion)
6.2 Back Office
6.2.1 Market Size, By Region, 2022-2027 (USD Billion)
6.3 Other Services
6.3.1 Market Size, By Region, 2022-2027 (USD Billion)
Chapter 7 Global Electronic Toll Collection Market, By Application
7.1 Highways
7.1.1 Market Size, By Region, 2022-2027 (USD Billion)
7.2 Urban Areas
7.2.1 Market Size, By Region, 2022-2027 (USD Billion)
Chapter 8 Global Electronic Toll Collection Market, By Region
8.1 Regional outlook
8.2 North America
8.2.1 Market Size, By Country 2022-2027 (USD Billion)
8.2.2 Market Size, By Type, 2022-2027 (USD Billion)
8.2.3 Market Size, By Offering, 2022-2027 (USD Billion)
8.2.4 Market Size, By Technology, 2022-2027 (USD Billion)
8.2.5 Market Size, By Application, 2022-2027 (USD Billion)
8.2.6 U.S.
8.2.6.1 Market Size, By Type, 2022-2027 (USD Billion)
8.2.4.2 Market Size, By Offering, 2022-2027 (USD Billion)
8.2.4.3 Market Size, By Technology, 2022-2027 (USD Billion)
Market Size, By Application, 2022-2027 (USD Billion)
8.2.7 Canada
8.2.7.1 Market Size, By Type, 2022-2027 (USD Billion)
8.2.7.2 Market Size, By Offering, 2022-2027 (USD Billion)
8.2.7.3 Market Size, By Technology, 2022-2027 (USD Billion)
8.2.7.4 Market Size, By Application, 2022-2027 (USD Billion)
8.3 Europe
8.3.1 Market Size, By Country 2022-2027 (USD Billion)
8.3.2 Market Size, By Type, 2022-2027 (USD Billion)
8.3.3 Market Size, By Offering, 2022-2027 (USD Billion)
8.3.4 Market Size, By Technology, 2022-2027 (USD Billion)
8.3.5 Market Size, By Application, 2022-2027 (USD Billion)
8.3.6 Germany
8.3.6.1 Market Size, By Type, 2022-2027 (USD Billion)
8.3.6.2 Market Size, By Offering, 2022-2027 (USD Billion)
8.3.6.3 Market Size, By Technology, 2022-2027 (USD Billion)
8.3.6.4 Market Size, By Application, 2022-2027 (USD Billion)
8.3.7 UK
8.3.7.1 Market Size, By Type, 2022-2027 (USD Billion)
8.3.7.2 Market Size, By Offering, 2022-2027 (USD Billion)
8.3.7.3 Market Size, By Technology, 2022-2027 (USD Billion)
8.3.7.4 Market Size, By Application, 2022-2027 (USD Billion)
8.3.8 France
8.3.8.1 Market Size, By Type, 2022-2027 (USD Billion)
8.3.8.2 Market Size, By Offering, 2022-2027 (USD Billion)
8.3.8.3 Market Size, By Technology, 2022-2027 (USD Billion)
8.3.8.4 Market Size, By Application, 2022-2027 (USD Billion)
8.3.9 Italy
8.3.9.1 Market Size, By Type, 2022-2027 (USD Billion)
8.3.9.2 Market Size, By Offering, 2022-2027 (USD Billion)
8.3.9.3 Market Size, By Technology, 2022-2027 (USD Billion)
8.3.9.4 Market Size, By Application, 2022-2027 (USD Billion)
8.3.10 Spain
8.3.10.1 Market Size, By Type, 2022-2027 (USD Billion)
8.3.10.2 Market Size, By Offering, 2022-2027 (USD Billion)
8.3.10.3 Market Size, By Technology, 2022-2027 (USD Billion)
8.3.10.4 Market Size, By Application, 2022-2027 (USD Billion)
8.3.11 Russia
8.3.11.1 Market Size, By Type, 2022-2027 (USD Billion)
8.3.11.2 Market Size, By Offering, 2022-2027 (USD Billion)
8.3.11.3 Market Size, By Technology, 2022-2027 (USD Billion)
8.3.11.4 Market Size, By Application, 2022-2027 (USD Billion)
8.4 Asia Pacific
8.4.1 Market Size, By Country 2022-2027 (USD Billion)
8.4.2 Market Size, By Type, 2022-2027 (USD Billion)
8.4.3 Market Size, By Offering, 2022-2027 (USD Billion)
8.4.4 Market Size, By Technology, 2022-2027 (USD Billion)
8.4.5 Market Size, By Application, 2022-2027 (USD Billion)
8.4.6 China
8.4.6.1 Market Size, By Type, 2022-2027 (USD Billion)
8.4.6.2 Market Size, By Offering, 2022-2027 (USD Billion)
8.4.6.3 Market Size, By Technology, 2022-2027 (USD Billion)
8.4.6.4 Market Size, By Application, 2022-2027 (USD Billion)
8.4.7 India
8.4.7.1 Market Size, By Type, 2022-2027 (USD Billion)
8.4.7.2 Market Size, By Offering, 2022-2027 (USD Billion)
8.4.7.3 Market Size, By Technology, 2022-2027 (USD Billion)
8.4.7.4 Market Size, By Application, 2022-2027 (USD Billion)
8.4.8 Japan
8.4.8.1 Market Size, By Type, 2022-2027 (USD Billion)
8.4.8.2 Market Size, By Offering, 2022-2027 (USD Billion)
8.4.8.3 Market Size, By Technology, 2022-2027 (USD Billion)
8.4.8.4 Market Size, By Application, 2022-2027 (USD Billion)
8.4.9 Australia
8.4.9.1 Market Size, By Type, 2022-2027 (USD Billion)
8.4.9.2 Market size, By Offering, 2022-2027 (USD Billion)
8.4.9.3 Market Size, By Technology, 2022-2027 (USD Billion)
8.4.9.4 Market Size, By Application, 2022-2027 (USD Billion)
8.4.10 South Korea
8.4.10.1 Market Size, By Type, 2022-2027 (USD Billion)
8.4.10.2 Market Size, By Offering, 2022-2027 (USD Billion)
8.4.10.3 Market Size, By Technology, 2022-2027 (USD Billion)
8.4.10.4 Market Size, By Application, 2022-2027 (USD Billion)
8.5 Central & South America
8.5.1 Market Size, By Country 2022-2027 (USD Billion)
8.5.2 Market Size, By Type, 2022-2027 (USD Billion)
8.5.3 Market Size, By Offering, 2022-2027 (USD Billion)
8.5.4 Market Size, By Technology, 2022-2027 (USD Billion)
8.5.5 Market Size, By Application, 2022-2027 (USD Billion)
8.5.6 Brazil
8.5.6.1 Market Size, By Type, 2022-2027 (USD Billion)
8.5.6.2 Market Size, By Offering, 2022-2027 (USD Billion)
8.5.6.3 Market Size, By Technology, 2022-2027 (USD Billion)
8.5.6.4 Market Size, By Application, 2022-2027 (USD Billion)
8.5.7 Mexico
8.5.7.1 Market Size, By Type, 2022-2027 (USD Billion)
8.5.7.2 Market Size, By Offering, 2022-2027 (USD Billion)
8.5.7.3 Market Size, By Technology, 2022-2027 (USD Billion)
8.5.7.4 Market Size, By Application, 2022-2027 (USD Billion)
8.5.8 Argentina
8.5.8.1 Market Size, By Type, 2022-2027 (USD Billion)
8.5.8.2 Market Size, By Offering, 2022-2027 (USD Billion)
8.5.8.3 Market Size, By Technology, 2022-2027 (USD Billion)
8.5.8.4 Market Size, By Application, 2022-2027 (USD Billion)
8.6 MEA
8.6.1 Market Size, By Country 2022-2027 (USD Billion)
8.6.2 Market Size, By Type, 2022-2027 (USD Billion)
8.6.3 Market Size, By Offering, 2022-2027 (USD Billion)
8.6.4 Market Size, By Technology, 2022-2027 (USD Billion)
8.6.5 Market Size, By Application, 2022-2027 (USD Billion)
8.6.6 Saudi Arabia
8.6.6.1 Market Size, By Type, 2022-2027 (USD Billion)
8.6.6.2 Market Size, By Offering, 2022-2027 (USD Billion)
8.6.6.3 Market Size, By Technology, 2022-2027 (USD Billion)
8.6.6.4 Market Size, By Application, 2022-2027 (USD Billion)
8.6.7 UAE
8.6.7.1 Market Size, By Type, 2022-2027 (USD Billion)
8.6.7.2 Market Size, By Offering, 2022-2027 (USD Billion)
8.6.7.3 Market Size, By Technology, 2022-2027 (USD Billion)
8.6.7.4 Market Size, By Application, 2022-2027 (USD Billion)
8.6.8 South Africa
8.6.8.1 Market Size, By Type, 2022-2027 (USD Billion)
8.6.8.2 Market Size, By Offering, 2022-2027 (USD Billion)
8.6.8.3 Market Size, By Technology, 2022-2027 (USD Billion)
8.6.8.4 Market Size, By Application, 2022-2027 (USD Billion)
Chapter 9 Company Landscape
9.1 Competitive Analysis, 2022
9.2 Kapsch TrafficCom
9.2.1 Company Overview
9.2.2 Financial Analysis
9.2.3 Strategic Positioning
9.2.4 Info Graphic Analysis
9.3 Conduent Business Services, LLC
9.3.1 Company Overview
9.3.2 Financial Analysis
9.3.3 Strategic Positioning
9.3.4 Info Graphic Analysis
9.4 EFKON GmbH
9.4.1 Company Overview
9.4.2 Financial Analysis
9.4.3 Strategic Positioning
9.4.4 Info Graphic Analysis
9.5 TransCore
9.5.1 Company Overview
9.5.2 Financial Analysis
9.5.3 Strategic Positioning
9.5.4 Info Graphic Analysis
9.6 Thales Group
9.6.1 Company Overview
9.6.2 Financial Analysis
9.6.3 Strategic Positioning
9.6.4 Info Graphic Analysis
9.7 Raytheon Technologies Corporation
9.7.1 Company Overview
9.7.2 Financial Analysis
9.7.3 Strategic Positioning
9.7.4 Info Graphic Analysis
9.8 Cubic Corporation
9.8.1 Company Overview
9.8.2 Financial Analysis
9.8.3 Strategic Positioning
9.8.4 Info Graphic Analysis
9.9 Siemens
9.9.1 Company Overview
9.9.2 Financial Analysis
9.9.3 Strategic Positioning
9.9.4 Info Graphic Analysis
9.10 Neology, Inc.
9.10.1 Company Overview
9.10.2 Financial Analysis
9.10.3 Strategic Positioning
9.10.4 Info Graphic Analysis
9.11 VINCI
9.11.1 Company Overview
9.11.2 Financial Analysis
9.11.3 Strategic Positioning
9.11.4 Info Graphic Analysis
9.12 Feig Electronic GmbH
9.12.1 Company Overview
9.12.2 Financial Analysis
9.12.3 Strategic Positioning
9.12.4 Info Graphic Analysis
9.13 Other Companies
9.13.1 Company Overview
9.13.2 Financial Analysis
9.13.3 Strategic Positioning
9.13.4 Info Graphic Analysis
The Global Electronic Toll Collection Market has been studied from the year 2019 till 2027. However, the CAGR provided in the report is from the year 2022 to 2027. The research methodology involved three stages: Desk research, Primary research, and Analysis & Output from the entire research process.

The desk research involved a robust background study which meant referring to paid and unpaid databases to understand the market dynamics; mapping contracts from press releases; identifying the key players in the market, studying their product portfolio, competition level, annual reports/SEC filings & investor presentations; and learning the demand and supply-side analysis for the Electronic Toll Collection Market.

The primary research activity included telephonic conversations with more than 50 tier 1 industry consultants, distributors, and end-use product manufacturers.

Finally, based on the above thorough research process, an in-depth analysis was carried out considering the following aspects: market attractiveness, current & future market trends, market share analysis, SWOT analysis of the company and customer analytics.

Frequently Asked Questions

This FREE sample includes market data points, ranging from trend analyses to market estimates & forecasts. See for yourself.
Or view our licence options:
Tailor made solutions just for you
80% of our clients seek made-to-order reports. How do you want us to tailor yours?
OUR CLIENTS


