This report was recently updated on August 20 2025 with the latest and most recent
market numbers
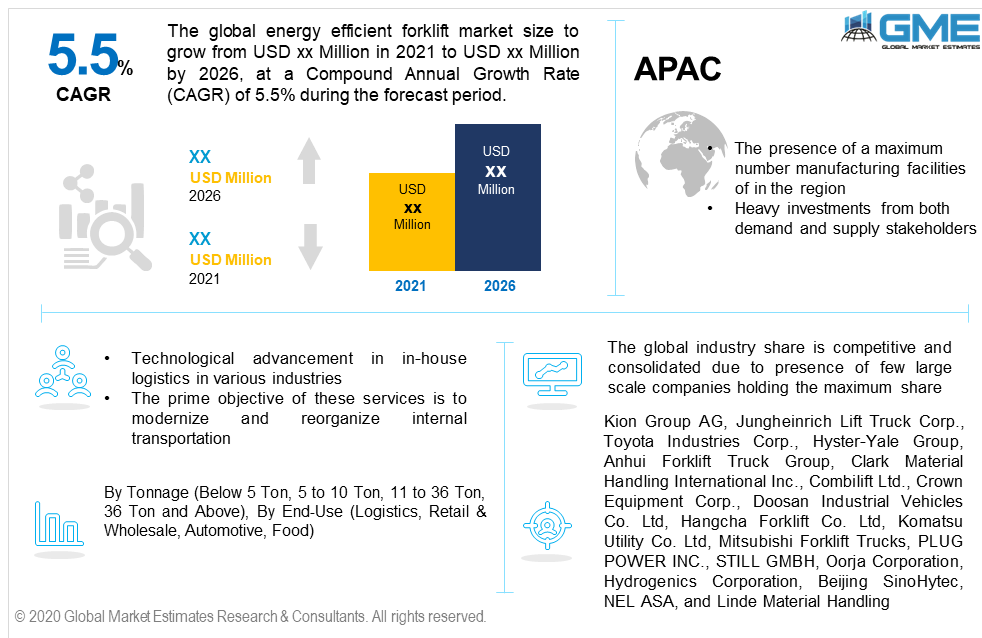
Global Energy Efficient Forklift Market Size, Trends & Analysis - Forecasts to 2026 By Tonnage (Below 5 Ton, 5 to 10 Ton, 11 to 36 Ton, 36 Ton and Above), By End-Use (Logistics, Retail & Wholesale, Automotive, Food), By Region (North America, Asia Pacific, Europe, Latin America, Middle East & Africa); End-User Landscape, Company Market Share Analysis, and Competitor Analysis
Technical advancement in the in-house transportation services among several industries has resulted in high demand for Energy Efficient Forklift. The Global Energy Efficient Forklift Market will observe over 5.5% CAGR from 2021 to 2026, with the Asia Pacific holding the maximum revenue share in 2019. Offering services such as automated transport, pre-defined routes, and quick transit inside the industrial vicinity are major success factors to induce product penetration. The industry offers several enhancements in the respective end-use industries related to material handling, transportation, and goods management. These facilities not only elevate the site's processes but also provides a modernized transportation system.
The prime objective of various industries is to reform and reorganize their material handling process. These electric vehicles help the factories and industries in detecting the source and consequence of interruptions and mishandling. Long-term competence and refining transit area are the key causes to deploy the electric movers in the industry.
Logistic and e-commerce industry expansion accompanied by the requirement to streamline the internal transportation of goods will proliferate the industry growth. At present various industries are already replacing conventional transporters with electric ones, and the industry is highly competitive owing to limited providers in the industry. The idea is not exclusive, but the deployment percentage is increasing rapidly owing to its high efficiency and low operating cost
Shifting industry situations due to the covid-19 pandemic along with increasing preference towards more automated material handling vehicles will open new avenues in the industry. Government involvement to promote the cost-effective transporters accompanied by the necessity to upgrade the operational activity will proliferate the product penetration.
Faster service, cost efficiency, and the ability to transport heavy material and parts are major technicalities to spend in these transportation systems. Though, heavy initial capital requirement accompanied by replacing the existing systems is a long-term procedure that hinders the adoption in some industries.
The tonnage segment is segregated into below 5 Ton, 5 to 10 Ton, 11 to 36 Ton, and more than 36 Ton. Different capacities are offered in the industry to ensure suitability in diversified industries. A large deployment is witnessed for 5 to 10 Ton capacity transporters. Higher suitability, safety, compatibility across various industries such as food, retail, airports are major factors to drive demand in this segment.
Logistics, retail & wholesale, automotive, and food major industries deploying these goods mover. The logistic industry is the prime consumer of these vehicles due to heavy operational activities and increasing e-commerce business. Improved time management, pre-defined routes transit, and safety are the major success factors to drive demand in this segment.
The food segment will witness significant gains in the coming years. Expansion in cold chains along with high requirements from the industry will result in wide penetration during the forecast period. The other lucrative industry is the retail & wholesale business. This segment will witness over 9% growth up to 2026.
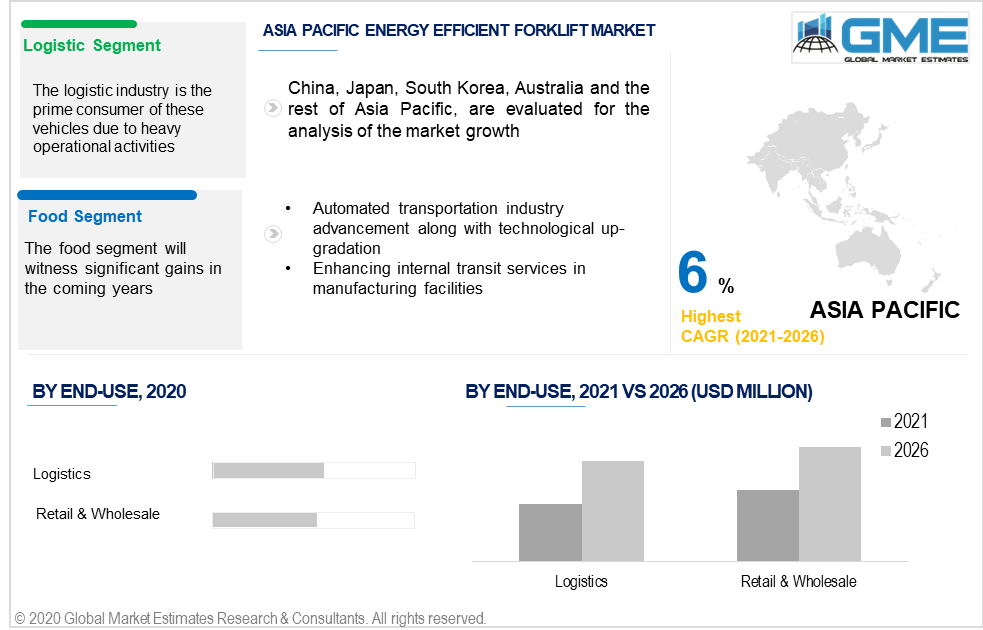
The Asia Pacific dominated the overall demand and consumption of these sustainable transportation solutions. The region accounted for more than 38% of the overall revenue generation in 2019. Sustainable vehicle penetration along with expansion in industrial facilities in China, India, Japan, and South Korea will support the regional industry growth. Emerging trends to upgrade the internal logistic solutions is another key success factor to drive regional demand.
North America is projected to witness more than a 5% CAGR up to 2026. The U.S. and Canada will be the major contributing countries. Retail & wholesale industry expansion for consumer goods along with increasing investment in electric vehicles will induce regional growth.
The European industry is greatly influenced by the increasing adoption of competent in-house logistic services. The region will hold more than 20% of the revenue share by 2026. The respective progress and demand are highly influenced by the emerging trend for electric goods mover. The logistic companies are becoming more aggressive towards premise operation development and implement ecological practices.
Kion Group AG, Toyota Industries Corp., NEL ASA, Jungheinrich Lift Truck Corp., Hyster-Yale Group, Clark Material Handling International Inc., Anhui Forklift Truck Group Co. Ltd, Combilift Ltd., Crown Equipment Corp., Doosan Industrial Vehicles Co. Ltd, Godrej & Boyce Mfg. Co. Ltd, Hangcha Forklift Co. Ltd, Mitsubishi Forklift Trucks, Komatsu Utility Co. Ltd, PLUG POWER INC., STILL GMBH, Hydrogenics Corporation, Oorja Corporation, Beijing SinoHytec Co., Ltd., and Linde Material Handling are key companies involved in the Energy Efficient Forklift Market.
Please note: This is not an exhaustive list of companies profiled in the report.
The global industry share is competitive and consolidated due to the presence of few large-scale companies holding the maximum share. Technological innovation and improved services regarding quickness, safety, and protection will be the key concern among the industry participants.
Chapter 1 Methodology
1.1 Market scope & definitions
1.2 Estimates & forecast calculation
1.3 Historical data overview and validation
1.4 Data sources
1.4.1 Secondary
1.4.2 Primary
Chapter 2 Report Outlook
2.1 Energy efficient forklift industry overview, 2019-2026
2.1.1 Industry overview
2.1.2 Tonnage overview
2.1.3 End-use overview
2.1.4 Regional overview
Chapter 3 Energy Efficient Forklift Market Trends
3.1 Market segmentation
3.2 Industry background, 2019-2026
3.3 Market key trends
3.3.1 Positive trends
3.3.2 Industry challenges
3.4 Prospective growth scenario
3.4.1 Product growth scenario
3.5 Industry influence over product growth
3.6 Porter’s analysis
3.7 PESTEL analysis
3.8 Value chain & supply chain analysis
3.9 Regulatory framework
3.9.1 North America
3.9.2 Europe
3.9.3 APAC
3.9.4 LATAM
3.9.5 MEA
3.10 Technology overview
3.11 Market share analysis, 2020
3.11.1 Company positioning overview, 2020
Chapter 4 Energy Efficient Forklift Market, By Tonnage
4.1 Tonnage Outlook
4.2 Below 5 Ton
4.2.1 Market size, by region, 2019-2026 (USD Million)
4.3 5 to 10 Ton
4.3.1 Market size, by region, 2019-2026 (USD Million)
4.4 11 to 36 Ton
4.4.1 Market size, by region, 2019-2026 (USD Million)
4.5 36 Ton and Above
4.5.1 Market size, by region, 2019-2026 (USD Million)
Chapter 5 Energy Efficient Forklift Market, By End-Use
5.1 End-Use Outlook
5.2 Logistics
5.2.1 Market size, by region, 2019-2026 (USD Million)
5.3 Retail & wholesale
5.3.1 Market size, by region, 2019-2026 (USD Million)
5.4 Automotive
5.4.1 Market size, by region, 2019-2026 (USD Million)
5.5 Food
5.5.1 Market size, by region, 2019-2026 (USD Million)
5.6 Others
5.6.1 Market size, by region, 2019-2026 (USD Million)
Chapter 6 Energy Efficient Forklift Market, By Region
6.1 Regional outlook
6.2 North America
6.2.1 Market size, by country 2019-2026 (USD Million)
6.2.2 Market size, by tonnage type, 2019-2026 (USD Million)
6.2.3 Market size, by end-use, 2019-2026 (USD Million)
6.2.4 U.S.
6.2.4.1 Market size, by tonnage type, 2019-2026 (USD Million)
6.2.4.2 Market size, by end-use, 2019-2026 (USD Million)
6.2.5 Canada
6.2.5.1 Market size, by tonnage type, 2019-2026 (USD Million)
6.2.5.2 Market size, by end-use, 2019-2026 (USD Million)
6.3 Europe
6.3.1 Market size, by country 2019-2026 (USD Million)
6.3.2 Market size, by tonnage type, 2019-2026 (USD Million)
6.3.3 Market size, by end-use, 2019-2026 (USD Million)
6.3.4 Germany
6.2.4.1 Market size, by tonnage type, 2019-2026 (USD Million)
6.2.4.2 Market size, by end-use, 2019-2026 (USD Million)
6.3.5 UK
6.3.5.1 Market size, by tonnage type, 2019-2026 (USD Million)
6.3.5.2 Market size, by end-use, 2019-2026 (USD Million)
6.3.6 France
6.3.6.1 Market size, by tonnage type, 2019-2026 (USD Million)
6.3.6.2 Market size, by end-use, 2019-2026 (USD Million)
6.3.7 Italy
6.3.7.1 Market size, by tonnage type, 2019-2026 (USD Million)
6.3.7.2 Market size, by end-use, 2019-2026 (USD Million)
6.3.8 Spain
6.3.8.1 Market size, by tonnage type, 2019-2026 (USD Million)
6.3.8.2 Market size, by end-use, 2019-2026 (USD Million)
6.3.9 Russia
6.3.9.1 Market size, by tonnage type, 2019-2026 (USD Million)
6.3.9.2 Market size, by end-use, 2019-2026 (USD Million)
6.4 Asia Pacific
6.4.1 Market size, by country 2019-2026 (USD Million)
6.4.2 Market size, by tonnage type, 2019-2026 (USD Million)
6.4.3 Market size, by end-use, 2019-2026 (USD Million)
6.4.4 China
6.4.4.1 Market size, by tonnage type, 2019-2026 (USD Million)
6.4.4.2 Market size, by end-use, 2019-2026 (USD Million)
6.4.5 Japan
6.4.5.1 Market size, by tonnage type, 2019-2026 (USD Million)
6.4.5.2 Market size, by end-use, 2019-2026 (USD Million)
6.4.6 Australia
6.4.6.1 Market size, by tonnage type, 2019-2026 (USD Million)
6.4.6.2 Market size, by end-use, 2019-2026 (USD Million)
6.4.7 India
6.4.7.1 Market size, by tonnage type, 2019-2026 (USD Million)
6.4.7.2 Market size, by end-use, 2019-2026 (USD Million)
6.4.8 South Korea
6.4.8.1 Market size, by tonnage type, 2019-2026 (USD Million)
6.4.8.2 Market size, by end-use, 2019-2026 (USD Million)
6.5 Latin America
6.5.1 Market size, by country 2019-2026 (USD Million)
6.5.2 Market size, by tonnage type, 2019-2026 (USD Million)
6.5.3 Market size, by end-use, 2019-2026 (USD Million)
6.5.4 Brazil
6.5.4.1 Market size, by tonnage type, 2019-2026 (USD Million)
6.5.4.2 Market size, by end-use, 2019-2026 (USD Million)
6.5.5 Mexico
6.5.5.1 Market size, by tonnage type, 2019-2026 (USD Million)
6.5.5.2 Market size, by end-use, 2019-2026 (USD Million)
6.6 MEA
6.6.1 Market size, by country 2019-2026 (USD Million)
6.6.2 Market size, by tonnage type, 2019-2026 (USD Million)
6.6.3 Market size, by end-use, 2019-2026 (USD Million)
6.6.4 Saudi Arabia
6.6.4.1 Market size, by tonnage type, 2019-2026 (USD Million)
6.6.4.2 Market size, by end-use, 2019-2026 (USD Million)
6.6.5 UAE
6.6.5.1 Market size, by tonnage type, 2019-2026 (USD Million)
6.6.5.2 Market size, by end-use, 2019-2026 (USD Million)
Chapter 7 Company Landscape
7.1 Competitive analysis, 2020
7.2 Kion Group AG
7.2.1 Company overview
7.2.2 Financial analysis
7.2.3 Strategic positioning
7.2.4 Info graphic analysis
7.3 Jungheinrich Lift Truck Corp.
7.3.1 Company overview
7.3.2 Financial analysis
7.3.3 Strategic positioning
7.3.4 Info graphic analysis
7.4 Toyota Industries Corp.
7.4.1 Company overview
7.4.2 Financial analysis
7.4.3 Strategic positioning
7.4.4 Info graphic analysis
7.5 Hyster-Yale Group
7.5.1 Company overview
7.5.2 Financial analysis
7.5.3 Strategic positioning
7.5.4 Info graphic analysis
7.6 Anhui Forklift Truck Group Co. Ltd
7.6.1 Company overview
7.6.2 Financial analysis
7.6.3 Strategic positioning
7.6.4 Info graphic analysis
7.7 Clark Material Handling International Inc.
7.7.1 Company overview
7.7.2 Financial analysis
7.7.3 Strategic positioning
7.7.4 Info graphic analysis
7.8 Combilift Ltd.
7.8.1 Company overview
7.8.2 Financial analysis
7.8.3 Strategic positioning
7.8.4 Info graphic analysis
7.9 Crown Equipment Corp.
7.9.1 Company overview
7.9.2 Financial analysis
7.9.3 Strategic positioning
7.9.4 Info graphic analysis
7.10 Doosan Industrial Vehicles Co. Ltd
7.10.1 Company overview
7.10.2 Financial analysis
7.10.3 Strategic positioning
7.10.4 Info graphic analysis
7.11 Godrej & Boyce Mfg. Co. Ltd
7.11.1 Company overview
7.11.2 Financial analysis
7.11.3 Strategic positioning
7.11.4 Info graphic analysis
7.12 Hangcha Forklift Co. Ltd
7.12.1 Company overview
7.12.2 Financial analysis
7.12.3 Strategic positioning
7.12.4 Info graphic analysis
7.13 Komatsu Utility Co. Ltd
7.13.1 Company overview
7.13.2 Financial analysis
7.13.3 Strategic positioning
7.13.4 Info graphic analysis
7.14 Mitsubishi Forklift Trucks
7.14.1 Company overview
7.14.2 Financial analysis
7.14.3 Strategic positioning
7.14.4 Info graphic analysis
7.15 Plug Power Inc.
7.15.1 Company overview
7.15.2 Financial analysis
7.15.3 Strategic positioning
7.15.4 Info graphic analysis
7.16 STILL GMBH
7.16.1 Company overview
7.16.2 Financial analysis
7.16.3 Strategic positioning
7.16.4 Info graphic analysis
7.17 Oorja Corporation
7.17.1 Company overview
7.17.2 Financial analysis
7.17.3 Strategic positioning
7.17.4 Info graphic analysis
7.18 Beijing SinoHytec Co., Ltd.
7.18.1 Company overview
7.18.2 Financial analysis
7.18.3 Strategic positioning
7.18.4 Info graphic analysis
7.19 NEL ASA
7.19.1 Company overview
7.19.2 Financial analysis
7.19.3 Strategic positioning
7.19.4 Info graphic analysis
7.20 Linde Material Handling
7.20.1 Company overview
7.20.2 Financial analysis
7.20.3 Strategic positioning
7.20.4 Info graphic analysis
7.21 Hydrogenics Corporation
7.21.1 Company overview
7.21.2 Financial analysis
7.21.3 Strategic positioning
7.21.4 Info graphic analysis
The Global Energy Efficient Forklift Market has been studied from the year 2019 till 2026. However, the CAGR provided in the report is from the year 2021 to 2026. The research methodology involved three stages: Desk research, Primary research, and Analysis & Output from the entire research process.

The desk research involved a robust background study which meant referring to paid and unpaid databases to understand the market dynamics; mapping contracts from press releases; identifying the key players in the market, studying their product portfolio, competition level, annual reports/SEC filings & investor presentations; and learning the demand and supply-side analysis for the Energy Efficient Forklift Market.

The primary research activity included telephonic conversations with more than 50 tier 1 industry consultants, distributors, and end-use product manufacturers.

Finally, based on the above thorough research process, an in-depth analysis was carried out considering the following aspects: market attractiveness, current & future market trends, market share analysis, SWOT analysis of the company and customer analytics.

Frequently Asked Questions

This FREE sample includes market data points, ranging from trend analyses to market estimates & forecasts. See for yourself.
Or view our licence options:
Tailor made solutions just for you
80% of our clients seek made-to-order reports. How do you want us to tailor yours?
OUR CLIENTS


