This report was recently updated on August 25 2025 with the latest and most recent
market numbers
Global Enhanced Vision Systems Market Size, Trends & Analysis - Forecasts to 2029 By Application Type (Military Aircraft, Business Jet Aircraft, and Others), By Type (Standalone EVS and Combined Vision Systems), and By Region (North America, Asia Pacific, Central and South America, Europe, and Middle East and Africa), Competitive Landscape, Company Market Share Analysis, and End User Analysis
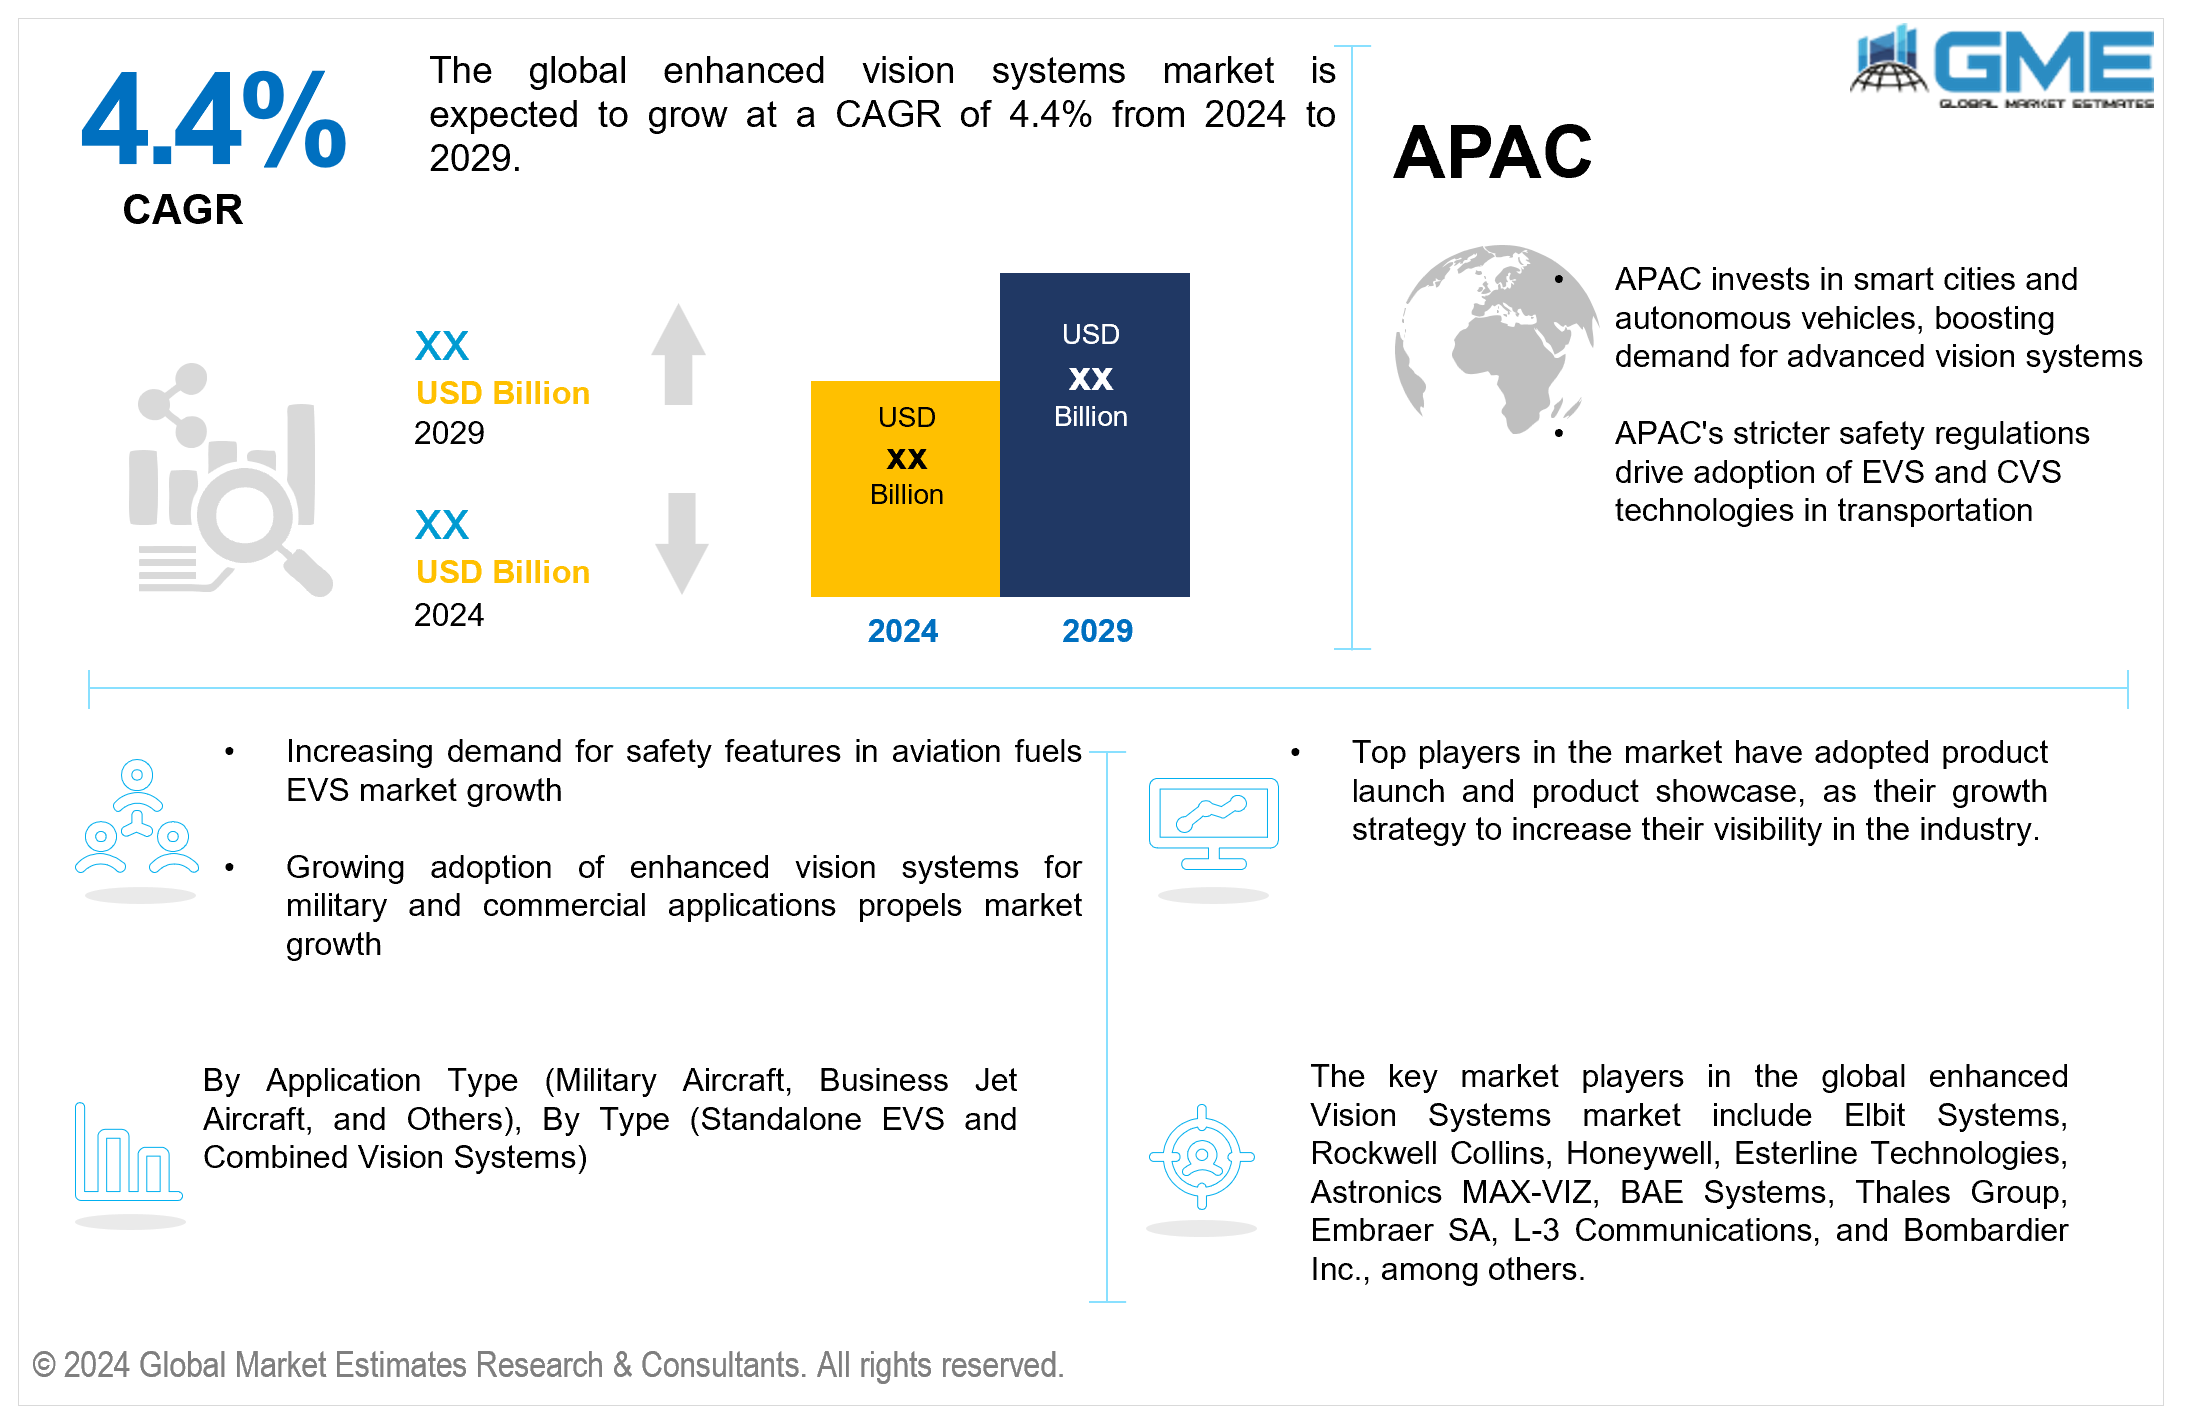
The global enhanced vision systems market is estimated to exhibit a CAGR of 4.4% from 2024 to 2029. Enhanced vision systems (EVS) are advanced technologies used in aerospace and automotive industries to enhance visibility in challenging conditions. They use infrared sensors, cameras, and image processing to provide real-time imagery, aiding pilots and drivers in aviation and automotive navigation. EVS mitigates risks associated with poor visibility, contributing to safer air and ground transportation operations.
Several factors drive the growth of the global enhanced vision systems market. Stringent safety regulations in aviation, automotive, maritime, and defense sectors drive the adoption of EVS to enhance situational awareness and reduce accidents or collisions, thereby improving overall safety standards. Advancements in sensor technologies, image processing algorithms, and display systems enhance the performance, reliability, and affordability of EVS solutions, driving market growth. EVS helps improve operational efficiency by enabling better navigation, obstacle detection, and object recognition, reducing downtime, enhanced productivity, and cost savings for businesses. The growing aviation industry presents a significant market opportunity for EVS manufacturers and suppliers due to increased demand, modernization of aircraft fleets, and safety and efficiency requirements.
Despite the various growth factors, several restraints hinder the growth of the global enhanced vision systems market. Enhanced vision systems typically involve high initial costs for installation and integration into aircraft or vehicles. This cost deters potential buyers, especially smaller operators or those with budget constraints. EVS rely on advanced sensors and data processing systems, raising concerns about data security and privacy, which acts as a significant restraint for market growth.
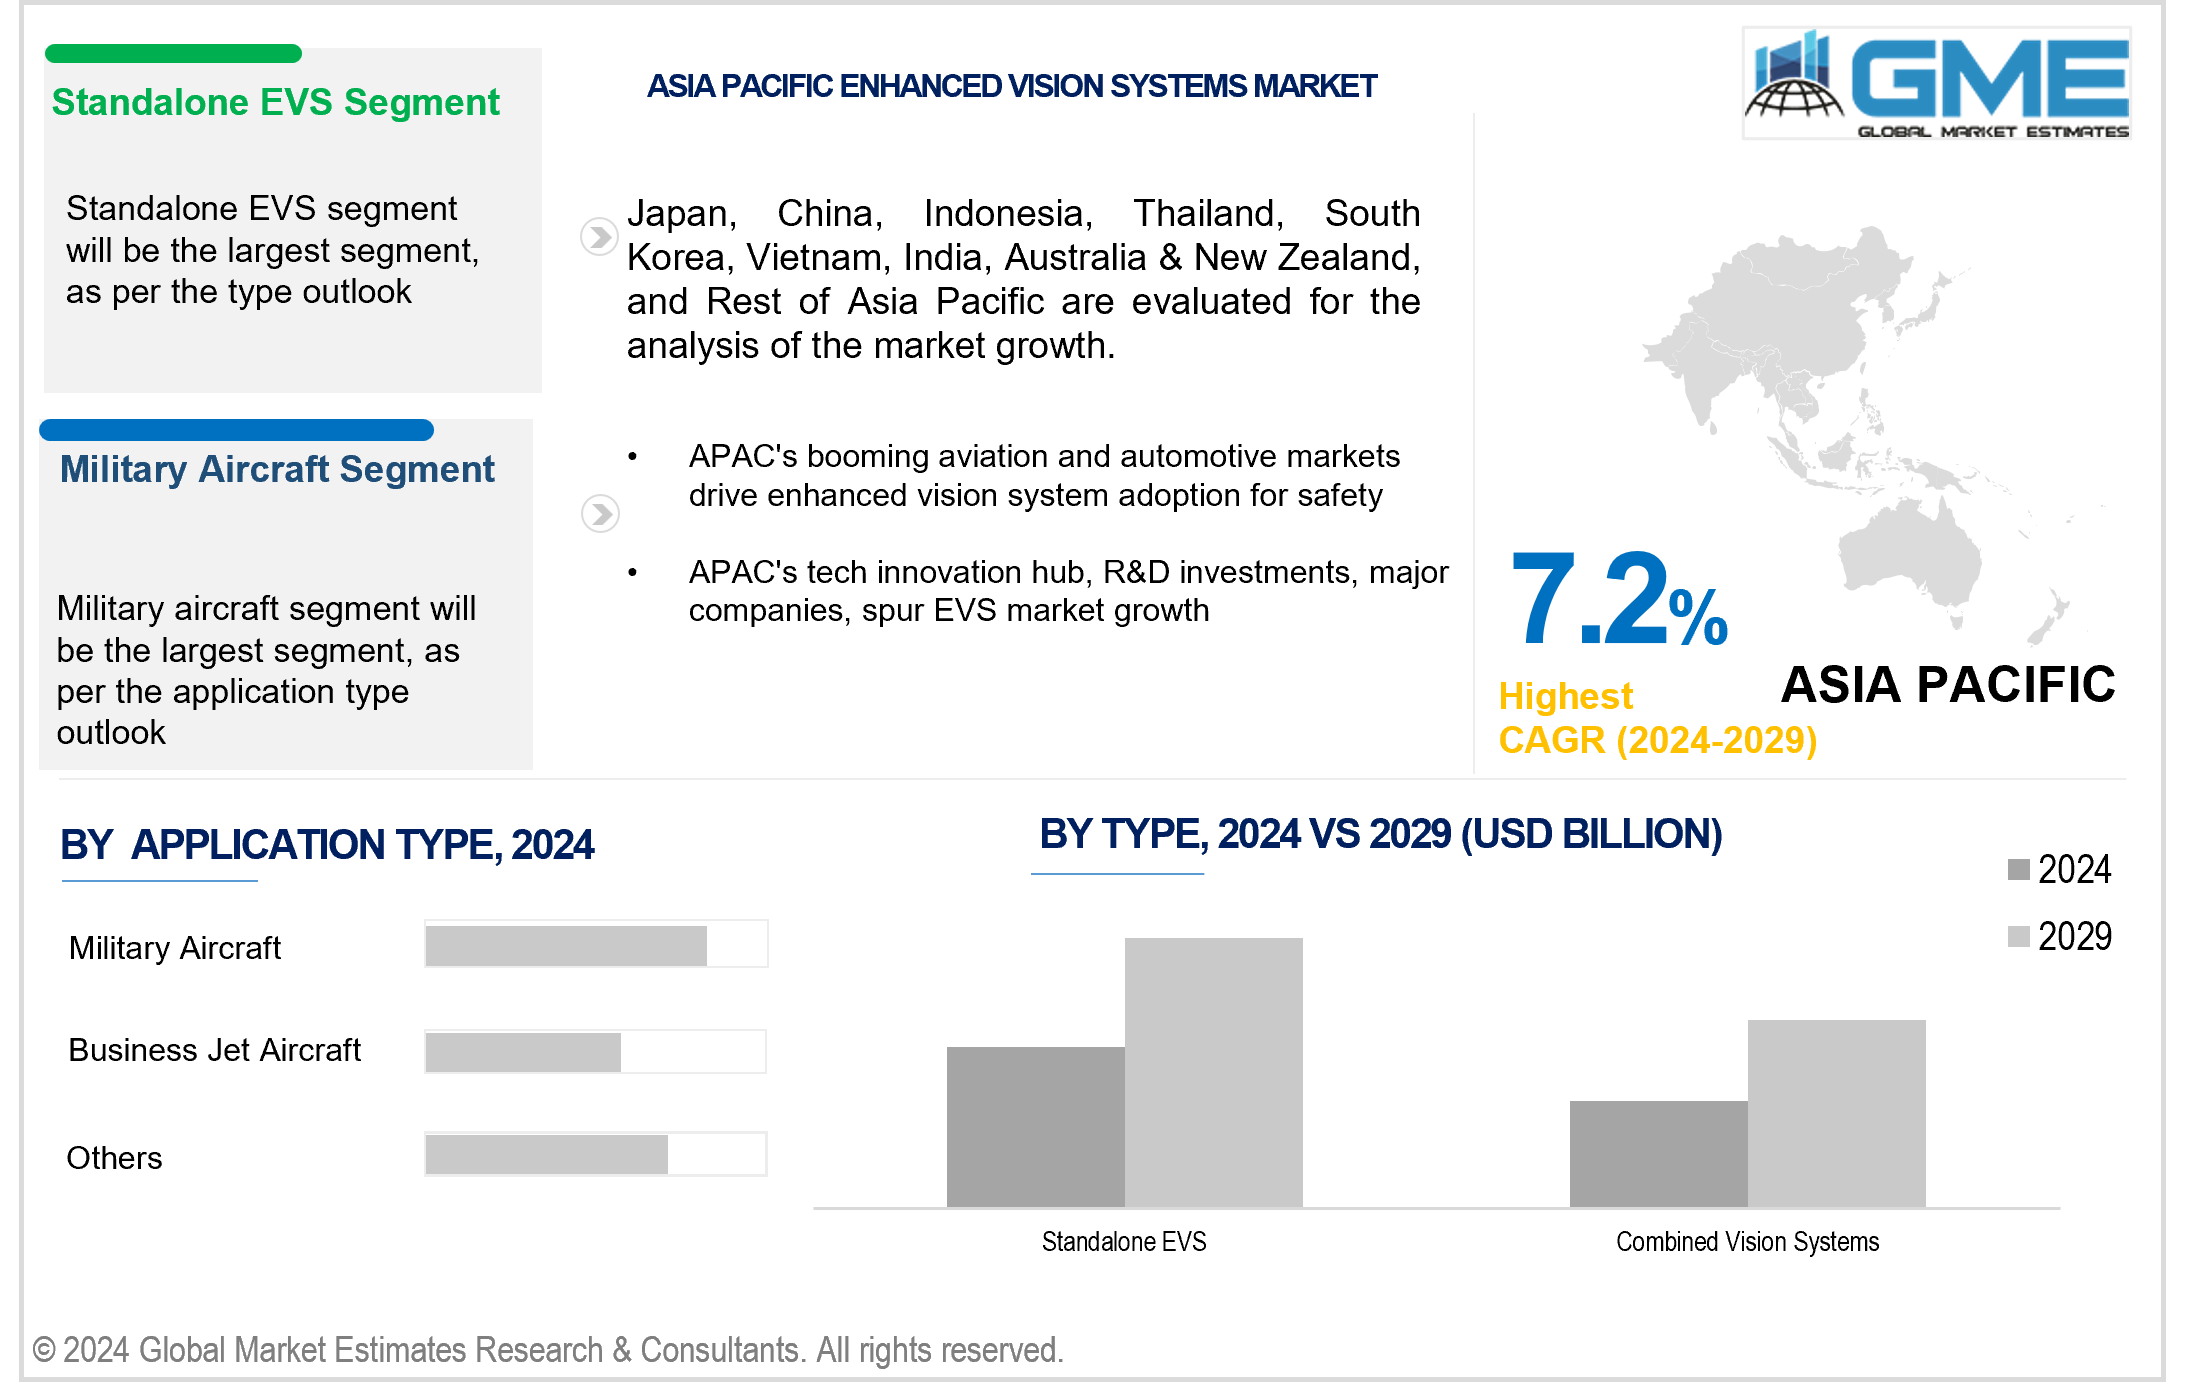
On the basis of application type, the market is segmented into military aircraft, business jet aircraft, and others. The military aircraft segment is expected to be the largest segment during the forecast period. This is due to the critical importance of enhanced vision capabilities in improving situational awareness, navigation, and safety during military operations, which often occur in challenging environments and under all weather conditions. Military budgets in many countries tend to be substantial, allowing investments in advanced technologies like EVS to maintain a strategic advantage. Thus, the military segment has established dominance within the global EVS market.
The business jet aircraft segment is expected to be the fastest-growing segment in the global enhanced vision systems market during the forecast period. This growth is driven by increasing demands for safety and luxury in the business aviation sector. Corporate and high-net-worth individuals are showing a growing interest in enhanced vision systems to ensure safer travel in varying weather conditions and to access more airports with challenging approaches. Furthermore, the recovery and expansion of business aviation, post-economic downturns, or global challenges tend to outpace other sectors, contributing to the rapid growth of EVS adoption.
On the basis of type, the market is segmented into standalone EVS and combined vision systems. The standalone EVS segment is expected to hold the largest share of the market during the forecast period. This is due to their earlier development and adoption, especially in aviation for nighttime and inclement weather operations. They have been the go-to option for enhancing visibility without requiring comprehensive system integration. However, as the demand for advanced safety features increases in both the aviation and automotive industries, the landscape is changing.
The combined vision system (CVS) segment is anticipated to be the fastest-growing in the global enhanced vision systems market during the forecast period. Improved sensor technologies and computing power enable better integration of EVS and SVS, making CVS more effective and reliable. Regulatory bodies' increasing emphasis on safety may encourage the adoption of advanced vision systems while operators seek higher safety standards and integration with autonomous systems for safe navigation.
North America is expected to be the largest region in the global enhanced vision systems market. North America's advanced aviation industry, dominated by major aircraft manufacturers, airlines, and aerospace defense contractors, significantly invests in R&D to improve aircraft safety and performance, leading to the adoption of EVS in commercial and military aviation. North America is a significant technological innovation hub, characterized by a robust ecosystem of tech companies, start-ups, and research institutions, fostering the integration of advanced technologies like EVS into various platforms.
Asia Pacific is anticipated to be the fastest-growing region in global enhanced vision systems market during the forecast period. The APAC region is a hub for technological innovation, with significant public and private sector investments facilitating rapid adoption of new technologies like EVS, attracting major companies and start-ups. The APAC region's rapidly growing aviation and automotive markets are ripe for the adoption of enhanced vision systems to enhance safety and navigation, especially in challenging weather conditions and varying terrains, driven by rising middle class demand. APAC countries are prioritizing smart city projects and autonomous vehicle technologies, requiring advanced sensing and vision technologies for navigation and safety, with the integration of EVS driving the demand for such systems. The APAC region is focusing on safety and efficiency in transportation, with stricter regulations requiring advanced technologies like EVS and CVS to comply with new standards, driving the adoption of these technologies in the region.
Elbit Systems, Rockwell Collins, Honeywell, Esterline Technologies, Astronics MAX-VIZ, BAE Systems, Thales Group, Embraer SA, L-3 Communications, and Bombardier Inc., among others, are some of the key market players operating in the global enhanced vision systems market.
Please note: This is not an exhaustive list of companies profiled in the report.
In December 2023, AerSale Corporation received a Supplemental Type Certificate from the FAA for its Enhanced Flight Vision System (EFVS) for the Boeing B737NG, marking the first commercial EFVS system with a 50% visual advantage and a complete dual-pilot solution.
In August 2023, Bombardier introduced an Advanced Avionics Upgrade powered by Collins Aerospace for select in-service Global aircraft equipped with Bombardier's Vision flight deck. The upgrade includes Bombardier's Combined Vision System (CVS), ADS-B In/Cockpit Display of Traffic Information (CDTI), airport moving map/SVS taxi mode, and a new weather radar.
1 STRATEGIC INSIGHTS ON NEW REVENUE POCKETS
1.1 Strategic Opportunity & Attractiveness Analysis
1.1.1 Hot Revenue Pockets
1.1.2 Market Attractiveness Score
1.1.3 Revenue Impacting Opportunity
1.1.4 High Growing Region/Country
1.1.5 Competitor Analysis
1.1.6 Consumer Analysis
1.2 Global Market Estimates' View
1.3 Strategic Insights across Business Functions
1.3.1 For Chief Executive Officers
1.3.2 For Chief Marketing Officers
1.3.3 For Chief Strategy Officers
1.4 Evaluate the Potential of your Existing Business Lines vs. New Lines to Enter Into
2 TECHNOLOGICAL TRENDS
2.1 Technological Adoption Rate
2.2 Current Trend Impact Analysis
2.3 Future Trend Impact Analysis
2.4 Data Metrics on Feed Stocks
3 GLOBAL MARKET OUTLOOK
3.1 Market Pyramid Analysis
3.1.1 Introduction
3.1.2 Adjacent Market Opportunities
3.1.3 Ancillary Market Opportunities
3.2 Demand Side Analysis
3.2.1 Market Drivers: Impact Analysis
3.2.2 Market Restraints: Impact Analysis
3.2.3 Market Opportunities: Impact Analysis
3.2.4 Market Challenges: Impact Analysis
3.3 Supply Side Analysis
3.3.1 Porter’s Five Forces Analysis
3.3.1.1 Threat of New Entrants
3.3.1.2 Threat of New Substitutes
3.3.1.3 Bargaining Power of Suppliers
3.3.1.4 Bargaining Power of Buyers
3.3.1.5 Intensity of Competitive Rivalry
3.3.2 SWOT Analysis; By Factor (Political & Legal, Economic, and Technological)
3.3.2.1 Political Landscape
3.3.2.2 Economic Landscape
3.3.2.3 Social Landscape
3.3.2.4 Technology Landscape
3.3.3 Value Chain Analysis
3.3.4 Trend Analysis
3.3.5 Gap Analysis
3.3.6 Cost Analysis
4 GLOBAL ENHANCED VISION SYSTEMS MARKET, BY APPLICATION TYPE
4.1 Introduction
4.2 Enhanced Vision Systems Market: Application Type Scope Key Takeaways
4.3 Revenue Growth Analysis, 2023 & 2029
4.4 Military Aircraft
4.4.1 Military Aircraft Market Estimates and Forecast, 2021-2029 (USD Million)
4.5 Business Jet Aircraft
4.5.1 Business Jet Aircraft Market Estimates and Forecast, 2021-2029 (USD Million)
4.6 Others
4.6.1 Others Market Estimates and Forecast, 2021-2029 (USD Million)
5 GLOBAL ENHANCED VISION SYSTEMS MARKET, BY TYPE
5.1 Introduction
5.2 Enhanced Vision Systems Market: Type Scope Key Takeaways
5.3 Revenue Growth Analysis, 2023 & 2029
5.4 Standalone EVS
5.4.1 Standalone EVS Market Estimates and Forecast, 2021-2029 (USD Million)
5.5 Combined Vision Systems
5.5.1 Combined Vision Systems Market Estimates and Forecast, 2021-2029 (USD Million)
6 GLOBAL ENHANCED VISION SYSTEMS MARKET, BY REGION
6.1 Introduction
6.2 North America Enhanced Vision Systems Market Estimates and Forecast, 2021-2029 (USD Million)
6.2.1 By Application Type
6.2.2 By Type
6.2.3 By Country
6.2.3.1 U.S. Enhanced Vision Systems Market Estimates and Forecast, 2021-2029 (USD Million)
6.2.3.1.1 By Application Type
6.2.3.1.2 By Type
6.2.3.2 Canada Enhanced Vision Systems Market Estimates and Forecast, 2021-2029 (USD Million)
6.2.3.2.1 By Application Type
6.2.3.2.2 By Type
6.2.3.3 Mexico Enhanced Vision Systems Market Estimates and Forecast, 2021-2029 (USD Million)
6.2.3.3.1 By Application Type
6.2.3.3.2 By Type
6.3 Europe Enhanced Vision Systems Market Estimates and Forecast, 2021-2029 (USD Million)
6.3.1 By Application Type
6.3.2 By Type
6.3.3 By Country
6.3.3.1 Germany Enhanced Vision Systems Market Estimates and Forecast, 2021-2029 (USD Million)
6.3.3.1.1 By Application Type
6.3.3.1.2 By Type
6.3.3.2 U.K. Enhanced Vision Systems Market Estimates and Forecast, 2021-2029 (USD Million)
6.3.3.2.1 By Application Type
6.3.3.2.2 By Type
6.3.3.3 France Enhanced Vision Systems Market Estimates and Forecast, 2021-2029 (USD Million)
6.3.3.3.1 By Application Type
6.3.3.3.2 By Type
6.3.3.4 Italy Enhanced Vision Systems Market Estimates and Forecast, 2021-2029 (USD Million)
6.3.3.4.1 By Application Type
6.3.3.4.2 By Type
6.3.3.5 Spain Enhanced Vision Systems Market Estimates and Forecast, 2021-2029 (USD Million)
6.3.3.5.1 By Application Type
6.3.3.5.2 By Type
6.3.3.6 Netherlands Enhanced Vision Systems Market Estimates and Forecast, 2021-2029 (USD Million)
6.3.3.6.1 By Application Type
6.3.3.6.2 By Type
6.3.3.7 Rest of Europe Enhanced Vision Systems Market Estimates and Forecast, 2021-2029 (USD Million)
6.3.3.6.1 By Application Type
6.3.3.6.2 By Type
6.4 Asia Pacific Enhanced Vision Systems Market Estimates and Forecast, 2021-2029 (USD Million)
6.4.1 By Application Type
6.4.2 By Type
6.4.3 By Country
6.4.3.1 China Enhanced Vision Systems Market Estimates and Forecast, 2021-2029 (USD Million)
6.4.3.1.1 By Application Type
6.4.3.1.2 By Type
6.4.3.2 Japan Enhanced Vision Systems Market Estimates and Forecast, 2021-2029 (USD Million)
6.4.3.2.1 By Application Type
6.4.3.2.2 By Type
6.4.3.3 India Enhanced Vision Systems Market Estimates and Forecast, 2021-2029 (USD Million)
6.4.3.3.1 By Application Type
6.4.3.3.2 By Type
6.4.3.4 South Korea Enhanced Vision Systems Market Estimates and Forecast, 2021-2029 (USD Million)
6.4.3.4.1 By Application Type
6.4.3.4.2 By Type
6.4.3.5 Singapore Enhanced Vision Systems Market Estimates and Forecast, 2021-2029 (USD Million)
6.4.3.5.1 By Application Type
6.4.3.5.2 By Type
6.4.3.6 Malaysia Enhanced Vision Systems Market Estimates and Forecast, 2021-2029 (USD Million)
6.4.3.6.1 By Application Type
6.4.3.6.2 By Type
6.4.3.7 Thailand Enhanced Vision Systems Market Estimates and Forecast, 2021-2029 (USD Million)
6.4.3.6.1 By Application Type
6.4.3.6.2 By Type
6.4.3.8 Indonesia Enhanced Vision Systems Market Estimates and Forecast, 2021-2029 (USD Million)
6.4.3.7.1 By Application Type
6.4.3.7.2 By Type
6.4.3.9 Vietnam Enhanced Vision Systems Market Estimates and Forecast, 2021-2029 (USD Million)
6.4.3.8.1 By Application Type
6.4.3.8.2 By Type
6.4.3.10 Taiwan Enhanced Vision Systems Market Estimates and Forecast, 2021-2029 (USD Million)
6.4.3.10.1 By Application Type
6.4.3.10.2 By Type
6.4.3.11 Rest of Asia Pacific Enhanced Vision Systems Market Estimates and Forecast, 2021-2029 (USD Million)
6.4.3.11.1 By Application Type
6.4.3.11.2 By Type
6.5 Middle East and Africa Enhanced Vision Systems Market Estimates and Forecast, 2021-2029 (USD Million)
6.5.1 By Application Type
6.5.2 By Type
6.5.3 By Country
6.5.3.1 Saudi Arabia Enhanced Vision Systems Market Estimates and Forecast, 2021-2029 (USD Million)
6.5.3.1.1 By Application Type
6.5.3.1.2 By Type
6.5.3.2 U.A.E. Enhanced Vision Systems Market Estimates and Forecast, 2021-2029 (USD Million)
6.5.3.2.1 By Application Type
6.5.3.2.2 By Type
6.5.3.3 Israel Enhanced Vision Systems Market Estimates and Forecast, 2021-2029 (USD Million)
6.5.3.3.1 By Application Type
6.5.3.3.2 By Type
6.5.3.4 South Africa Enhanced Vision Systems Market Estimates and Forecast, 2021-2029 (USD Million)
6.5.3.4.1 By Application Type
6.5.3.4.2 By Type
6.5.3.5 Rest of Middle East and Africa Enhanced Vision Systems Market Estimates and Forecast, 2021-2029 (USD Million)
6.5.3.5.1 By Application Type
6.5.3.5.2 By Type
6.6 Central & South America Enhanced Vision Systems Market Estimates and Forecast, 2021-2029 (USD Million)
6.6.1 By Application Type
6.6.2 By Type
6.6.3 By Country
6.6.3.1 Brazil Enhanced Vision Systems Market Estimates and Forecast, 2021-2029 (USD Million)
6.6.3.1.1 By Application Type
6.6.3.1.2 By Type
6.6.3.2 Argentina Enhanced Vision Systems Market Estimates and Forecast, 2021-2029 (USD Million)
6.6.3.2.1 By Application Type
6.6.3.2.2 By Type
6.6.3.3 Chile Enhanced Vision Systems Market Estimates and Forecast, 2021-2029 (USD Million)
6.6.3.3.1 By Application Type
6.6.3.3.2 By Type
6.6.3.3 Rest of Central & South America Enhanced Vision Systems Market Estimates and Forecast, 2021-2029 (USD Million)
6.6.3.3.1 By Application Type
6.6.3.3.2 By Type
7 COMPETITIVE LANDCAPE
7.1 Company Market Share Analysis
7.2 Four Quadrant Positioning Matrix
7.2.1 Market Leaders
7.2.2 Market Visionaries
7.2.3 Market Challengers
7.2.4 Niche Market Players
7.3 Vendor Landscape
7.3.1 North America
7.3.2 Europe
7.3.3 Asia Pacific
7.3.4 Rest of the World
7.4 Company Profiles
7.4.1 Elbit Systems
7.4.1.1 Business Description & Financial Analysis
7.4.1.2 SWOT Analysis
7.4.1.3 Products & Services Offered
7.4.1.4 Strategic Alliances between Business Partners
7.4.2 Rockwell Collins
7.4.2.1 Business Description & Financial Analysis
7.4.2.2 SWOT Analysis
7.4.2.3 Products & Services Offered
7.4.2.4 Strategic Alliances between Business Partners
7.4.3 Honeywell
7.4.3.1 Business Description & Financial Analysis
7.4.3.2 SWOT Analysis
7.4.3.3 Products & Services Offered
7.4.3.4 Strategic Alliances between Business Partners
7.4.4 Esterline Technologies
7.4.4.1 Business Description & Financial Analysis
7.4.4.2 SWOT Analysis
7.4.4.3 Products & Services Offered
7.4.4.4 Strategic Alliances between Business Partners
7.4.5 Astronics MAX-VIZ
7.4.5.1 Business Description & Financial Analysis
7.4.5.2 SWOT Analysis
7.4.5.3 Products & Services Offered
7.4.5.4 Strategic Alliances between Business Partners
7.4.6 BAE Systems
7.4.6.1 Business Description & Financial Analysis
7.4.6.2 SWOT Analysis
7.4.6.3 Products & Services Offered
7.4.6.4 Strategic Alliances between Business Partners
7.4.7 Thales Group
7.4.7.1 Business Description & Financial Analysis
7.4.7.2 SWOT Analysis
7.4.7.3 Products & Services Offered
7.4.7.4 Strategic Alliances between Business Partners
7.4.8 L-3 Communications
7.4.8.1 Business Description & Financial Analysis
7.4.8.2 SWOT Analysis
7.4.8.3 Products & Services Offered
7.4.8.4 Strategic Alliances between Business Partners
7.4.9 Bombardier Inc.
7.4.9.1 Business Description & Financial Analysis
7.4.9.2 SWOT Analysis
7.4.9.3 Products & Services Offered
7.4.9.4 Strategic Alliances between Business Partners
7.4.10 Embraer SA
7.4.10.1 Business Description & Financial Analysis
7.4.10.2 SWOT Analysis
7.4.10.3 Products & Services Offered
7.4.10.4 Strategic Alliances between Business Partners
7.4.11 Other Companies
7.4.11.1 Business Description & Financial Analysis
7.4.11.2 SWOT Analysis
7.4.11.3 Products & Services Offered
7.4.11.4 Strategic Alliances between Business Partners
8 RESEARCH METHODOLOGY
8.1 Market Introduction
8.1.1 Market Definition
8.1.2 Market Scope & Segmentation
8.2 Information Procurement
8.2.1 Secondary Research
8.2.1.1 Purchased Databases
8.2.1.2 GMEs Internal Data Repository
8.2.1.3 Secondary Resources & Third Party Perspectives
8.2.1.4 Company Information Sources
8.2.2 Primary Research
8.2.2.1 Various Types of Respondents for Primary Interviews
8.2.2.2 Number of Interviews Conducted throughout the Research Process
8.2.2.3 Primary Stakeholders
8.2.2.4 Discussion Guide for Primary Participants
8.2.3 Expert Panels
8.2.3.1 Expert Panels Across 30+ Industry
8.2.4 Paid Local Experts
8.2.4.1 Paid Local Experts Across 30+ Industry Across each Region
8.3 Market Estimation
8.3.1 Top-Down Approach
8.3.1.1 Macro-Economic Indicators Considered
8.3.1.2 Micro-Economic Indicators Considered
8.3.2 Bottom Up Approach
8.3.2.1 Company Share Analysis Approach
8.3.2.2 Estimation of Potential Product Sales
8.4 Data Triangulation
8.4.1 Data Collection
8.4.2 Time Series, Cross Sectional & Panel Data Analysis
8.4.3 Cluster Analysis
8.5 Analysis and Output
8.5.1 Inhouse AI Based Real Time Analytics Tool
8.5.2 Output From Desk & Primary Research
8.6 Research Assumptions & Limitations
8.6.1 Research Assumptions
8.6.2 Research Limitations
LIST OF TABLES
1 Global Enhanced Vision Systems Market, By Application Type, 2021-2029 (USD Million)
2 Military Aircraft Market, By Region, 2021-2029 (USD Million)
3 Business Jet Aircraft Market, By Region, 2021-2029 (USD Million)
4 Others Market, By Region, 2021-2029 (USD Million)
5 Global Enhanced Vision Systems Market, By Type, 2021-2029 (USD Million)
6 Standalone EVS Market, By Region, 2021-2029 (USD Million)
7 Combined Vision Systems Market, By Region, 2021-2029 (USD Million)
8 Regional Analysis, 2021-2029 (USD Million)
9 North America Enhanced Vision Systems Market, By Application Type, 2021-2029 (USD Million)
10 North America Enhanced Vision Systems Market, By Type, 2021-2029 (USD Million)
11 North America Enhanced Vision Systems Market, By Country, 2021-2029 (USD Million)
12 U.S. Enhanced Vision Systems Market, By Application Type, 2021-2029 (USD Million)
13 U.S. Enhanced Vision Systems Market, By Type, 2021-2029 (USD Million)
14 Canada Enhanced Vision Systems Market, By Application Type, 2021-2029 (USD Million)
15 Canada Enhanced Vision Systems Market, By Type, 2021-2029 (USD Million)
16 Mexico Enhanced Vision Systems Market, By Application Type, 2021-2029 (USD Million)
17 Mexico Enhanced Vision Systems Market, By Type, 2021-2029 (USD Million)
18 Europe Enhanced Vision Systems Market, By Application Type, 2021-2029 (USD Million)
19 Europe Enhanced Vision Systems Market, By Type, 2021-2029 (USD Million)
20 Europe Enhanced Vision Systems Market, By Country, 2021-2029 (USD Million)
21 Germany Enhanced Vision Systems Market, By Application Type, 2021-2029 (USD Million)
22 Germany Enhanced Vision Systems Market, By Type, 2021-2029 (USD Million)
23 U.K. Enhanced Vision Systems Market, By Application Type, 2021-2029 (USD Million)
24 U.K. Enhanced Vision Systems Market, By Type, 2021-2029 (USD Million)
25 France Enhanced Vision Systems Market, By Application Type, 2021-2029 (USD Million)
26 France Enhanced Vision Systems Market, By Type, 2021-2029 (USD Million)
27 Italy Enhanced Vision Systems Market, By Application Type, 2021-2029 (USD Million)
28 Italy Enhanced Vision Systems Market, By Type, 2021-2029 (USD Million)
29 Spain Enhanced Vision Systems Market, By Application Type, 2021-2029 (USD Million)
30 Spain Enhanced Vision Systems Market, By Type, 2021-2029 (USD Million)
31 Netherlands Enhanced Vision Systems Market, By Application Type, 2021-2029 (USD Million)
32 Netherlands Enhanced Vision Systems Market, By Type, 2021-2029 (USD Million)
33 Rest Of Europe Enhanced Vision Systems Market, By Application Type, 2021-2029 (USD Million)
34 Rest Of Europe Enhanced Vision Systems Market, By Type, 2021-2029 (USD Million)
35 Asia Pacific Enhanced Vision Systems Market, By Application Type, 2021-2029 (USD Million)
36 Asia Pacific Enhanced Vision Systems Market, By Type, 2021-2029 (USD Million)
37 Asia Pacific Enhanced Vision Systems Market, By Country, 2021-2029 (USD Million)
38 China Enhanced Vision Systems Market, By Application Type, 2021-2029 (USD Million)
39 China Enhanced Vision Systems Market, By Type, 2021-2029 (USD Million)
40 Japan Enhanced Vision Systems Market, By Application Type, 2021-2029 (USD Million)
41 Japan Enhanced Vision Systems Market, By Type, 2021-2029 (USD Million)
42 India Enhanced Vision Systems Market, By Application Type, 2021-2029 (USD Million)
43 India Enhanced Vision Systems Market, By Type, 2021-2029 (USD Million)
44 South Korea Enhanced Vision Systems Market, By Application Type, 2021-2029 (USD Million)
45 South Korea Enhanced Vision Systems Market, By Type, 2021-2029 (USD Million)
46 Singapore Enhanced Vision Systems Market, By Application Type, 2021-2029 (USD Million)
47 Singapore Enhanced Vision Systems Market, By Type, 2021-2029 (USD Million)
48 Thailand Enhanced Vision Systems Market, By Application Type, 2021-2029 (USD Million)
49 Thailand Enhanced Vision Systems Market, By Type, 2021-2029 (USD Million)
50 Malaysia Enhanced Vision Systems Market, By Application Type, 2021-2029 (USD Million)
51 Malaysia Enhanced Vision Systems Market, By Type, 2021-2029 (USD Million)
52 Indonesia Enhanced Vision Systems Market, By Application Type, 2021-2029 (USD Million)
53 Indonesia Enhanced Vision Systems Market, By Type, 2021-2029 (USD Million)
54 Vietnam Enhanced Vision Systems Market, By Application Type, 2021-2029 (USD Million)
55 Vietnam Enhanced Vision Systems Market, By Type, 2021-2029 (USD Million)
56 Taiwan Enhanced Vision Systems Market, By Application Type, 2021-2029 (USD Million)
57 Taiwan Enhanced Vision Systems Market, By Type, 2021-2029 (USD Million)
58 Rest of APAC Enhanced Vision Systems Market, By Application Type, 2021-2029 (USD Million)
59 Rest of APAC Enhanced Vision Systems Market, By Type, 2021-2029 (USD Million)
60 Middle East and Africa Enhanced Vision Systems Market, By Application Type, 2021-2029 (USD Million)
61 Middle East and Africa Enhanced Vision Systems Market, By Type, 2021-2029 (USD Million)
62 Middle East and Africa Enhanced Vision Systems Market, By Country, 2021-2029 (USD Million)
63 Saudi Arabia Enhanced Vision Systems Market, By Application Type, 2021-2029 (USD Million)
64 Saudi Arabia Enhanced Vision Systems Market, By Type, 2021-2029 (USD Million)
65 UAE Enhanced Vision Systems Market, By Application Type, 2021-2029 (USD Million)
66 UAE Enhanced Vision Systems Market, By Type, 2021-2029 (USD Million)
67 Israel Enhanced Vision Systems Market, By Application Type, 2021-2029 (USD Million)
68 Israel Enhanced Vision Systems Market, By Type, 2021-2029 (USD Million)
69 South Africa Enhanced Vision Systems Market, By Application Type, 2021-2029 (USD Million)
70 South Africa Enhanced Vision Systems Market, By Type, 2021-2029 (USD Million)
71 Rest Of Middle East and Africa Enhanced Vision Systems Market, By Application Type, 2021-2029 (USD Million)
72 Rest Of Middle East and Africa Enhanced Vision Systems Market, By Type, 2021-2029 (USD Million)
73 Central & South America Enhanced Vision Systems Market, By Application Type, 2021-2029 (USD Million)
74 Central & South America Enhanced Vision Systems Market, By Type, 2021-2029 (USD Million)
75 Central & South America Enhanced Vision Systems Market, By Country, 2021-2029 (USD Million)
76 Brazil Enhanced Vision Systems Market, By Application Type, 2021-2029 (USD Million)
77 Brazil Enhanced Vision Systems Market, By Type, 2021-2029 (USD Million)
78 Chile Enhanced Vision Systems Market, By Application Type, 2021-2029 (USD Million)
79 Chile Enhanced Vision Systems Market, By Type, 2021-2029 (USD Million)
80 Argentina Enhanced Vision Systems Market, By Application Type, 2021-2029 (USD Million)
81 Argentina Enhanced Vision Systems Market, By Type, 2021-2029 (USD Million)
82 Rest Of Central & South America Enhanced Vision Systems Market, By Application Type, 2021-2029 (USD Million)
83 Rest Of Central & South America Enhanced Vision Systems Market, By Type, 2021-2029 (USD Million)
84 Elbit Systems: Products & Services Offering
85 Rockwell Collins: Products & Services Offering
86 Honeywell: Products & Services Offering
87 Esterline Technologies: Products & Services Offering
88 Astronics MAX-VIZ: Products & Services Offering
89 BAE Systems: Products & Services Offering
90 Thales Group : Products & Services Offering
91 L-3 Communications: Products & Services Offering
92 Bombardier Inc., Inc: Products & Services Offering
93 Embraer SA: Products & Services Offering
94 Other Companies: Products & Services Offering
LIST OF FIGURES
1 Global Enhanced Vision Systems Market Overview
2 Global Enhanced Vision Systems Market Value From 2021-2029 (USD Million)
3 Global Enhanced Vision Systems Market Share, By Application Type (2023)
4 Global Enhanced Vision Systems Market Share, By Type (2023)
5 Global Enhanced Vision Systems Market, By Region (Global Market)
6 Technological Trends In Global Enhanced Vision Systems Market
7 Four Quadrant Competitor Positioning Matrix
8 Impact Of Macro & Micro Indicators On The Market
9 Impact Of Key Drivers On The Global Enhanced Vision Systems Market
10 Impact Of Challenges On The Global Enhanced Vision Systems Market
11 Porter’s Five Forces Analysis
12 Global Enhanced Vision Systems Market: By Application Type Scope Key Takeaways
13 Global Enhanced Vision Systems Market, By Application Type Segment: Revenue Growth Analysis
14 Military Aircraft Market, By Region, 2021-2029 (USD Million)
15 Business Jet Aircraft Market, By Region, 2021-2029 (USD Million)
16 Others Market, By Region, 2021-2029 (USD Million)
17 Global Enhanced Vision Systems Market: By Type Scope Key Takeaways
18 Global Enhanced Vision Systems Market, By Type Segment: Revenue Growth Analysis
19 Standalone EVS Market, By Region, 2021-2029 (USD Million)
20 Combined Vision Systems Market, By Region, 2021-2029 (USD Million)
21 Regional Segment: Revenue Growth Analysis
22 Global Enhanced Vision Systems Market: Regional Analysis
23 North America Enhanced Vision Systems Market Overview
24 North America Enhanced Vision Systems Market, By Application Type
25 North America Enhanced Vision Systems Market, By Type
26 North America Enhanced Vision Systems Market, By Country
27 U.S. Enhanced Vision Systems Market, By Application Type
28 U.S. Enhanced Vision Systems Market, By Type
29 Canada Enhanced Vision Systems Market, By Application Type
30 Canada Enhanced Vision Systems Market, By Type
31 Mexico Enhanced Vision Systems Market, By Application Type
32 Mexico Enhanced Vision Systems Market, By Type
33 Four Quadrant Positioning Matrix
34 Company Market Share Analysis
35 Elbit Systems: Company Snapshot
36 Elbit Systems: SWOT Analysis
37 Elbit Systems: Geographic Presence
38 Rockwell Collins: Company Snapshot
39 Rockwell Collins: SWOT Analysis
40 Rockwell Collins: Geographic Presence
41 Honeywell: Company Snapshot
42 Honeywell: SWOT Analysis
43 Honeywell: Geographic Presence
44 Esterline Technologies: Company Snapshot
45 Esterline Technologies: Swot Analysis
46 Esterline Technologies: Geographic Presence
47 Astronics MAX-VIZ: Company Snapshot
48 Astronics MAX-VIZ: SWOT Analysis
49 Astronics MAX-VIZ: Geographic Presence
50 BAE Systems: Company Snapshot
51 BAE Systems: SWOT Analysis
52 BAE Systems: Geographic Presence
53 Thales Group : Company Snapshot
54 Thales Group : SWOT Analysis
55 Thales Group : Geographic Presence
56 L-3 Communications: Company Snapshot
57 L-3 Communications: SWOT Analysis
58 L-3 Communications: Geographic Presence
59 Bombardier Inc., Inc.: Company Snapshot
60 Bombardier Inc., Inc.: SWOT Analysis
61 Bombardier Inc., Inc.: Geographic Presence
62 Embraer SA: Company Snapshot
63 Embraer SA: SWOT Analysis
64 Embraer SA: Geographic Presence
65 Other Companies: Company Snapshot
66 Other Companies: SWOT Analysis
67 Other Companies: Geographic Presence
The Global Enhanced Vision Systems Market has been studied from the year 2019 till 2029. However, the CAGR provided in the report is from the year 2024 to 2029. The research methodology involved three stages: Desk research, Primary research, and Analysis & Output from the entire research process.

The desk research involved a robust background study which meant referring to paid and unpaid databases to understand the market dynamics; mapping contracts from press releases; identifying the key players in the market, studying their product portfolio, competition level, annual reports/SEC filings & investor presentations; and learning the demand and supply-side analysis for the Enhanced Vision Systems Market.

The primary research activity included telephonic conversations with more than 50 tier 1 industry consultants, distributors, and end-use product manufacturers.

Finally, based on the above thorough research process, an in-depth analysis was carried out considering the following aspects: market attractiveness, current & future market trends, market share analysis, SWOT analysis of the company and customer analytics.

Frequently Asked Questions

This FREE sample includes market data points, ranging from trend analyses to market estimates & forecasts. See for yourself.
Or view our licence options:
Tailor made solutions just for you
80% of our clients seek made-to-order reports. How do you want us to tailor yours?
OUR CLIENTS


