This report was recently updated on August 20 2025 with the latest and most recent
market numbers
Global Enterprise Architecture Tools Market Size, Trends, and Analysis - Forecasts to 2026 By Component (Solutions [Infrastructure Architecture, Application Architecture, Data Architecture, Security Architecture, Others], Services [Managed Services, Professional]), By Deployment Type (On-Premises, Cloud), By Organization Size (Large Enterprises, SMEs), By Vertical (BFSI, Consumer Goods And Retail, Telecommunication, IT, Manufacturing, Healthcare, And Life Sciences, Others), By Region (North America, Europe, Asia Pacific, MEA, and CSA); End-User Landscape, Company Market Share Analysis, and Competitor Analysis
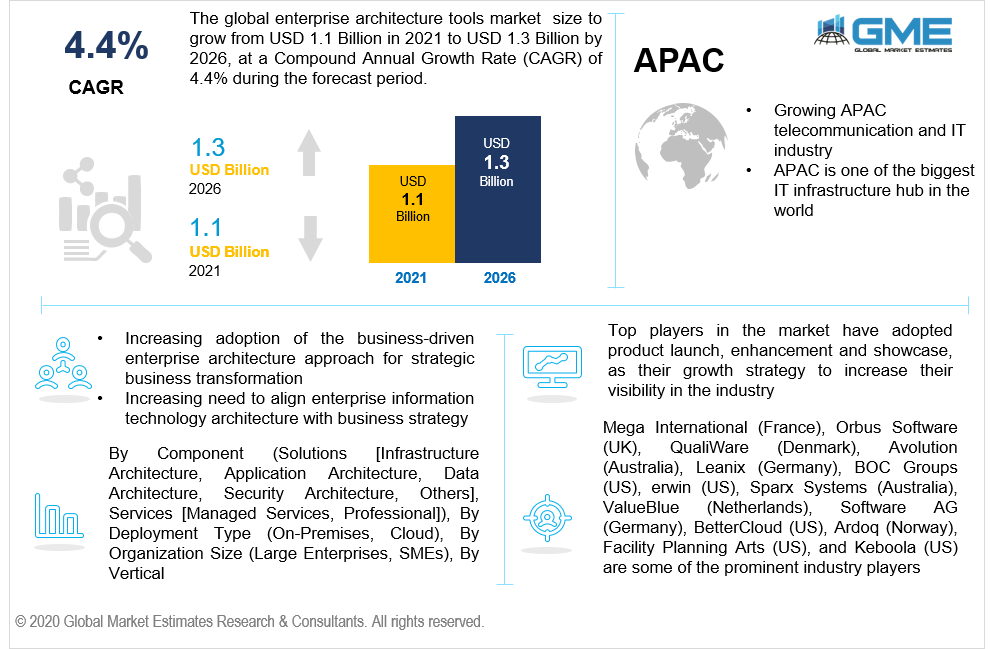
The global enterprise architecture tools market is projected to grow from USD 1.1 billion in 2021 to USD 1.3 billion by 2026 at a CAGR value of 4.4%.
Key factors that are expected to drive the growth of the market are the increasing adoption of the business-driven enterprise architecture approach for strategic business transformation and an increasing need to align enterprise information technology architecture with business strategy. Adding big data capabilities to enterprise architecture tools and an increasing need to adopt application rationalization practices are some of the opportunities for vendors in the enterprise architecture tools market.
However, increasing data thief activities and data security concerns are expected to limit the market growth.
Enterprise architecture tools are applications that are very beneficial for the architects to design, plan, analyze, and execute their ideas and strategies. The enterprise architecture (EA) tools assist various business developers and other stakeholders to associate their strategies and designs with other relevant and available information, ideas, solutions, and domains. These tools also assist the stakeholders to store, collect, and analyze the ideas and information, which can be used in the development and success of enterprises.
However, with increasing cyber crime and hacking systems, the enterprises adapting the EA tools can experience losses in the enterprises. These enterprises hold all the operational and sensitive data, which can get leaked through these EA tools and can be misused. This aspect can cause restraints on the growth and demand for the EA tools.
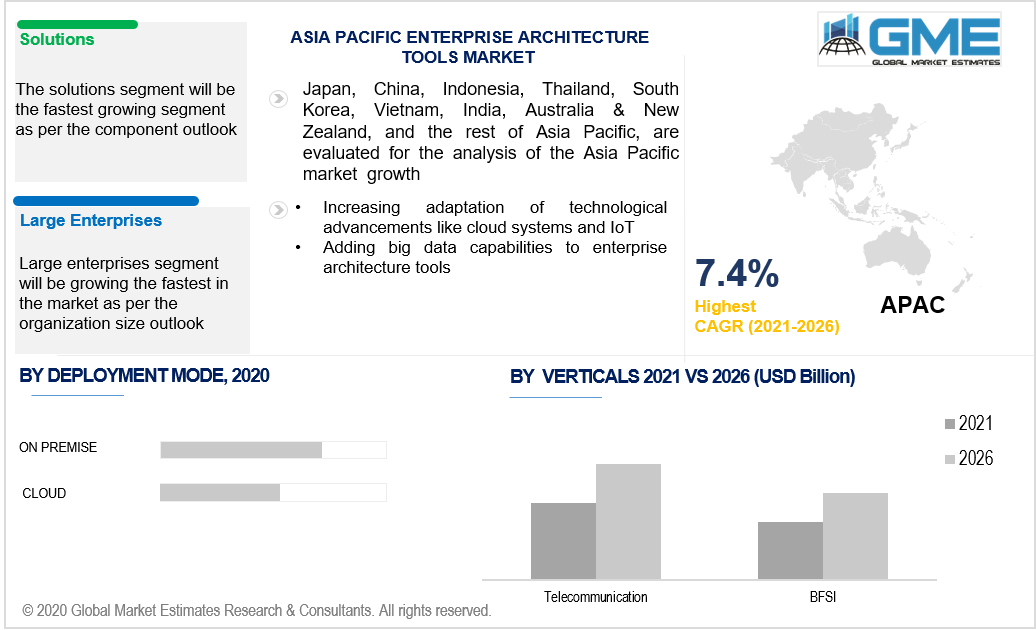
Based on component, the market is segmented into solutions [infrastructure architecture, application architecture, data architecture, security architecture, and others], and services. Solutions component in EA tools creates a platform for the enterprise architects to construct, plan, visualize, and design the business technology and thus is analyzed to be the top market segment.
Solution development also enables the end-users to bring visibility and transparency among their team members. It also gives the architect the freedom to build a well strategized map for the ideas, thus bringing standardized working. EA tools also enables the creation of different models and solutions at a much faster rate than services.
Based on the deployment mode, the market is segmented into on-premises, and cloud. On premise software or deployment models are majorly installed in the business for enterprise architecture and hence hold the largest shares in the market.
This deployment model efficiently serves the requirements of businesses in the enterprise architecture market. Contrary to the cloud based deployment models, where the stakeholders have considerably less control over the enterprise’s working and systems, the on premise deployment models give the stakeholders security, reliability, and control over the working and designing of enterprise architecture.
Based on the organization size, the market is segmented into large enterprises, SMEs. The market is experiencing a surge in the investments made for adopting enterprise architecture tools. These investments are majorly contributed by the large scale enterprises. These large enterprises are highly technology driven and invest tremendously in IT infrastructure development. Hence, the large enterprises segment will be the largest shareholder in the market.
As these tools support various specializations and standardization rules, the adoption of EATs is more in the large enterprises as compared to the small and medium enterprises.
Based on vertical, the market is segmented into BFSI, consumer goods and retail, telecommunication, it, manufacturing, healthcare, and life sciences, and others. The telecommunication industry is expanding on greater levels across the world and is also analyzed to be the largest shareholder in the market.
The adoption of EA tools is witnessed majorly in the telecommunication industry. Developing an IT infrastructure and linking it with enterprise or business ideas is very crucial in the telecommunication industry. The telecommunication industry also extensively adopts the increasing technological advancements like AI, IoT, and other innovations, which require efficient EA tools to align these objectives with their increasing IT infrastructure.
Based on region, the market can be segmented into various regions such as North America, Europe, Central and South America, Middle East and North Africa, and Asia Pacific regions.
North America holds the largest share in the enterprise architecture tools market. Countries in the North American region have their strong hold on end user sectors like the telecommunication sector, BFSI, and IT infrastructure. They are the major contributors to the EA tools market.
However, the APAC region is the fastest growing segment in the market from 2021 to 2026. Asia- Pacific region is gradually gaining demand from its end user verticals for the enterprise architecture tools. The APAC region is also witnessing high growth in its telecommunication and IT sector. Especially a country like India is one of the biggest promoters of IT infrastructure development, which requires EA tools to align their ideas with the business developers. APAC countries are also adopting themselves extensively to the technological advancements like cloud systems and IoT.
Mega International (France), Orbus Software (UK), QualiWare (Denmark), Avolution (Australia), Leanix (Germany), BOC Groups (US), erwin (US), Sparx Systems (Australia), ValueBlue (Netherlands), UNICOM Global (US), Clausmark (Germany), Enterprise Architecture Solutions (UK), Planview (US), MonoFor (US), Valispace (Portugal), FIOS Insight (US), BiZZdesign (Netherlands), Aplas (Australia), NinjaRMM (US), CodeLogic (US), Software AG (Germany), BetterCloud (US), Ardoq (Norway), Facility Planning Arts (US), and Keboola (US) are some of the key players of the market.
Please note: This is not an exhaustive list of companies profiled in the report.
In November 2020, BOC Group signed a partnership agreement with ATD Solution to expand BOC Group’s business in the APAC region.
Chapter 1 Methodology
1.1 Market Scope & Definitions
1.2 Estimates & Forecast Calculation
1.3 Historical Data Overview and Validation
1.4 Data Sources
1.4.1 Secondary
1.4.2 Primary
Chapter 2 Report Outlook
2.1 Enterprise Architecture Tools Industry Overview, 2021-2026
2.1.1 Industry Overview
2.1.2 Component Overview
2.1.3 Deployment Type Overview
2.1.4 Organization Size Overview
2.1.5 Vertical Overview
2.1.6 Regional Overview
Chapter 3 Enterprise Architecture Tools Market Trends
3.1 Market Segmentation
3.2 Industry Background, 2019-2026
3.3 Market Key Trends
3.3.1 Positive Trends
3.3.1.1 Increasing adoption of the business-driven enterprise architecture approach for strategic business transformation
3.3.1.2 Growing construction projects in APAC region
3.3.2 Industry Challenges
3.3.2.1 Lack of adequate infrastructure and automated systems for architecture and design domain in developing nations
3.4 Prospective Growth Scenario
3.4.1 Component Growth Scenario
3.4.2 Deployment Type Growth Scenario
3.4.3 Organization Size Growth Scenario
3.4.4 Vertical Growth Scenario
3.5 COVID-19 Influence over Industry Growth
3.6 Porter’s Analysis
3.7 PESTEL Analysis
3.8 Value Chain & Supply Chain Analysis
3.9 Regulatory Framework
3.9.1 North America
3.9.2 Europe
3.9.3 APAC
3.9.4 LATAM
3.9.5 MEA
3.10 Vertical Overview
3.11 Market Share Analysis, 2020
3.11.1 Company Positioning Overview, 2020
Chapter 4 Enterprise Architecture Tools Market, By Component
4.1 Component Outlook
4.2 Solutions
4.2.1 Market Size, By Region, 2019-2026 (USD Million)
4.3 Services
4.3.1 Market Size, By Region, 2019-2026 (USD Million)
Chapter 5 Enterprise Architecture Tools Market, By Vertical
5.1 Vertical Outlook
5.2 BFSI
5.2.1 Market Size, By Region, 2019-2026 (USD Million)
5.3 Consumer Goods and Retail
5.3.1 Market Size, By Region, 2019-2026 (USD Million)
5.4 Telecommunication
5.4.1 Market Size, By Region, 2019-2026 (USD Million)
5.5 IT
5.5.1 Market Size, By Region, 2019-2026 (USD Million)
5.6 Manufacturing
5.6.1 Market Size, By Region, 2019-2026 (USD Million)
5.7 Healthcare
5.7.1 Market Size, By Region, 2019-2026 (USD Million)
5.8 Life Sciences
5.8.1 Market Size, By Region, 2019-2026 (USD Million)
5.9 Other
5.9.1 Market Size, By Region, 2019-2026 (USD Million)
Chapter 6 Enterprise Architecture Tools Market, By Deployment Type
6.1 On-Premises
6.1.1 Market Size, By Region, 2019-2026 (USD Million)
6.2 Cloud
6.2.1 Market Size, By Region, 2019-2026 (USD Million)
Chapter 7 Enterprise Architecture Tools Market, By Organization Size
7.1 Large Enterprises
7.1.1 Market Size, By Region, 2019-2026 (USD Million)
7.2 SMEs
7.2.1 Market Size, By Region, 2019-2026 (USD Million)
Chapter 8 Enterprise Architecture Tools Market, By Region
8.1 Regional outlook
8.2 North America
8.2.1 Market Size, By Country 2019-2026 (USD Million)
8.2.2 Market Size, By Component, 2019-2026 (USD Million)
8.2.3 Market Size, By Deployment Type, 2019-2026 (USD Million)
8.2.4 Market Size, By Organization Size, 2019-2026 (USD Million)
8.2.5 Market Size, By Vertical, 2019-2026 (USD Million)
8.2.6 U.S.
8.2.6.1 Market Size, By Component, 2019-2026 (USD Million)
8.2.4.2 Market Size, By Deployment Type, 2019-2026 (USD Million)
8.2.4.3 Market Size, By Organization Size, 2019-2026 (USD Million)
Market Size, By Vertical, 2019-2026 (USD Million)
8.2.7 Canada
8.2.7.1 Market Size, By Component, 2019-2026 (USD Million)
8.2.7.2 Market Size, By Deployment Type, 2019-2026 (USD Million)
8.2.7.3 Market Size, By Organization Size, 2019-2026 (USD Million)
8.2.7.4 Market Size, By Vertical, 2019-2026 (USD Million)
8.3 Europe
8.3.1 Market Size, By Country 2019-2026 (USD Million)
8.3.2 Market Size, By Component, 2019-2026 (USD Million)
8.3.3 Market Size, By Deployment Type, 2019-2026 (USD Million)
8.3.4 Market Size, By Organization Size, 2019-2026 (USD Million)
8.3.5 Market Size, By Vertical, 2019-2026 (USD Million)
8.3.6 Germany
8.3.6.1 Market Size, By Component, 2019-2026 (USD Million)
8.3.6.2 Market Size, By Deployment Type, 2019-2026 (USD Million)
8.3.6.3 Market Size, By Organization Size, 2019-2026 (USD Million)
8.3.6.4 Market Size, By Vertical, 2019-2026 (USD Million)
8.3.7 UK
8.3.7.1 Market Size, By Component, 2019-2026 (USD Million)
8.3.7.2 Market Size, By Deployment Type, 2019-2026 (USD Million)
8.3.7.3 Market Size, By Organization Size, 2019-2026 (USD Million)
8.3.7.4 Market Size, By Vertical, 2019-2026 (USD Million)
8.3.8 France
8.3.8.1 Market Size, By Component, 2019-2026 (USD Million)
8.3.8.2 Market Size, By Deployment Type, 2019-2026 (USD Million)
8.3.8.3 Market Size, By Organization Size, 2019-2026 (USD Million)
8.3.8.4 Market Size, By Vertical, 2019-2026 (USD Million)
8.3.9 Italy
8.3.9.1 Market Size, By Component, 2019-2026 (USD Million)
8.3.9.2 Market Size, By Deployment Type, 2019-2026 (USD Million)
8.3.9.3 Market Size, By Organization Size, 2019-2026 (USD Million)
8.3.9.4 Market Size, By Vertical, 2019-2026 (USD Million)
8.3.10 Spain
8.3.10.1 Market Size, By Component, 2019-2026 (USD Million)
8.3.10.2 Market Size, By Deployment Type, 2019-2026 (USD Million)
8.3.10.3 Market Size, By Organization Size, 2019-2026 (USD Million)
8.3.10.4 Market Size, By Vertical, 2019-2026 (USD Million)
8.3.11 Russia
8.3.11.1 Market Size, By Component, 2019-2026 (USD Million)
8.3.11.2 Market Size, By Deployment Type, 2019-2026 (USD Million)
8.3.11.3 Market Size, By Organization Size, 2019-2026 (USD Million)
8.3.11.4 Market Size, By Vertical, 2019-2026 (USD Million)
8.4 Asia Pacific
8.4.1 Market Size, By Country 2019-2026 (USD Million)
8.4.2 Market Size, By Component, 2019-2026 (USD Million)
8.4.3 Market Size, By Deployment Type, 2019-2026 (USD Million)
8.4.4 Market Size, By Organization Size, 2019-2026 (USD Million)
8.4.5 Market Size, By Vertical, 2019-2026 (USD Million)
8.4.6 China
8.4.6.1 Market Size, By Component, 2019-2026 (USD Million)
8.4.6.2 Market Size, By Deployment Type, 2019-2026 (USD Million)
8.4.6.3 Market Size, By Organization Size, 2019-2026 (USD Million)
8.4.6.4 Market Size, By Vertical, 2019-2026 (USD Million)
8.4.7 India
8.4.7.1 Market Size, By Component, 2019-2026 (USD Million)
8.4.7.2 Market Size, By Deployment Type, 2019-2026 (USD Million)
8.4.7.3 Market Size, By Organization Size, 2019-2026 (USD Million)
8.4.7.4 Market Size, By Vertical, 2019-2026 (USD Million)
8.4.8 Japan
8.4.8.1 Market Size, By Component, 2019-2026 (USD Million)
8.4.8.2 Market Size, By Deployment Type, 2019-2026 (USD Million)
8.4.8.3 Market Size, By Organization Size, 2019-2026 (USD Million)
8.4.8.4 Market Size, By Vertical, 2019-2026 (USD Million)
8.4.9 Australia
8.4.9.1 Market Size, By Component, 2019-2026 (USD Million)
8.4.9.2 Market size, By Deployment Type, 2019-2026 (USD Million)
8.4.9.3 Market Size, By Organization Size, 2019-2026 (USD Million)
8.4.9.4 Market Size, By Vertical, 2019-2026 (USD Million)
8.4.10 South Korea
8.4.10.1 Market Size, By Component, 2019-2026 (USD Million)
8.4.10.2 Market Size, By Deployment Type, 2019-2026 (USD Million)
8.4.10.3 Market Size, By Organization Size, 2019-2026 (USD Million)
8.4.10.4 Market Size, By Vertical, 2019-2026 (USD Million)
8.5 Latin America
8.5.1 Market Size, By Country 2019-2026 (USD Million)
8.5.2 Market Size, By Component, 2019-2026 (USD Million)
8.5.3 Market Size, By Deployment Type, 2019-2026 (USD Million)
8.5.4 Market Size, By Organization Size, 2019-2026 (USD Million)
8.5.5 Market Size, By Vertical, 2019-2026 (USD Million)
8.5.6 Brazil
8.5.6.1 Market Size, By Component, 2019-2026 (USD Million)
8.5.6.2 Market Size, By Deployment Type, 2019-2026 (USD Million)
8.5.6.3 Market Size, By Organization Size, 2019-2026 (USD Million)
8.5.6.4 Market Size, By Vertical, 2019-2026 (USD Million)
8.5.7 Mexico
8.5.7.1 Market Size, By Component, 2019-2026 (USD Million)
8.5.7.2 Market Size, By Deployment Type, 2019-2026 (USD Million)
8.5.7.3 Market Size, By Organization Size, 2019-2026 (USD Million)
8.5.7.4 Market Size, By Vertical, 2019-2026 (USD Million)
8.5.8 Argentina
8.5.8.1 Market Size, By Component, 2019-2026 (USD Million)
8.5.8.2 Market Size, By Deployment Type, 2019-2026 (USD Million)
8.5.8.3 Market Size, By Organization Size, 2019-2026 (USD Million)
8.5.8.4 Market Size, By Vertical, 2019-2026 (USD Million)
8.6 MEA
8.6.1 Market Size, By Country 2019-2026 (USD Million)
8.6.2 Market Size, By Component, 2019-2026 (USD Million)
8.6.3 Market Size, By Deployment Type, 2019-2026 (USD Million)
8.6.4 Market Size, By Organization Size, 2019-2026 (USD Million)
8.6.5 Market Size, By Vertical, 2019-2026 (USD Million)
8.6.6 Saudi Arabia
8.6.6.1 Market Size, By Component, 2019-2026 (USD Million)
8.6.6.2 Market Size, By Deployment Type, 2019-2026 (USD Million)
8.6.6.3 Market Size, By Organization Size, 2019-2026 (USD Million)
8.6.6.4 Market Size, By Vertical, 2019-2026 (USD Million)
8.6.7 UAE
8.6.7.1 Market Size, By Component, 2019-2026 (USD Million)
8.6.7.2 Market Size, By Deployment Type, 2019-2026 (USD Million)
8.6.7.3 Market Size, By Organization Size, 2019-2026 (USD Million)
8.6.7.4 Market Size, By Vertical, 2019-2026 (USD Million)
8.6.8 South Africa
8.6.8.1 Market Size, By Component, 2019-2026 (USD Million)
8.6.8.2 Market Size, By Deployment Type, 2019-2026 (USD Million)
8.6.8.3 Market Size, By Organization Size, 2019-2026 (USD Million)
8.6.8.4 Market Size, By Vertical, 2019-2026 (USD Million)
Chapter 9 Company Landscape
9.1 Competitive Analysis, 2020
9.2 Mega International (France)
9.2.1 Company Overview
9.2.2 Financial Analysis
9.2.3 Strategic Positioning
9.2.4 Info Graphic Analysis
9.3 Orbus Software (UK)
9.3.1 Company Overview
9.3.2 Financial Analysis
9.3.3 Strategic Positioning
9.3.4 Info Graphic Analysis
9.4 QualiWare (Denmark)
9.4.1 Company Overview
9.4.2 Financial Analysis
9.4.3 Strategic Positioning
9.4.4 Info Graphic Analysis
9.5 Avolution (Australia)
9.5.1 Company Overview
9.5.2 Financial Analysis
9.5.3 Strategic Positioning
9.5.4 Info Graphic Analysis
9.6 Leanix (Germany)
9.6.1 Company Overview
9.6.2 Financial Analysis
9.6.3 Strategic Positioning
9.6.4 Info Graphic Analysis
9.7 BOC Groups (US)
9.7.1 Company Overview
9.7.2 Financial Analysis
9.7.3 Strategic Positioning
9.7.4 Info Graphic Analysis
9.8 erwin (US)
9.8.1 Company Overview
9.8.2 Financial Analysis
9.8.3 Strategic Positioning
9.8.4 Info Graphic Analysis
9.9 Sparx Systems (Australia)
9.9.1 Company Overview
9.9.2 Financial Analysis
9.9.3 Strategic Positioning
9.9.4 Info Graphic Analysis
9.10 ValueBlue (Netherlands)
9.10.1 Company Overview
9.10.2 Financial Analysis
9.10.3 Strategic Positioning
9.10.4 Info Graphic Analysis
9.11 Other Companies
9.11.1 Company Overview
9.11.2 Financial Analysis
9.11.3 Strategic Positioning
9.11.4 Info Graphic Analysis
The Global Enterprise Architecture Tools Market has been studied from the year 2019 till 2026. However, the CAGR provided in the report is from the year 2021 to 2026. The research methodology involved three stages: Desk research, Primary research, and Analysis & Output from the entire research process.

The desk research involved a robust background study which meant referring to paid and unpaid databases to understand the market dynamics; mapping contracts from press releases; identifying the key players in the market, studying their product portfolio, competition level, annual reports/SEC filings & investor presentations; and learning the demand and supply-side analysis for the Enterprise Architecture Tools Market.

The primary research activity included telephonic conversations with more than 50 tier 1 industry consultants, distributors, and end-use product manufacturers.

Finally, based on the above thorough research process, an in-depth analysis was carried out considering the following aspects: market attractiveness, current & future market trends, market share analysis, SWOT analysis of the company and customer analytics.

Frequently Asked Questions
![Global Enterprise Architecture Tools Market Size, Trends, and Analysis - Forecasts to 2026 By Component (Solutions [Infrastructure Architecture, Application Architecture, Data Architecture, Security Architecture, Others], Services [Managed Services, Professional]), By Deployment Type (On-Premises, Cloud), By Organization Size (Large Enterprises, SMEs), By Vertical (BFSI, Consumer Goods And Retail, Telecommunication, IT, Manufacturing, Healthcare, And Life Sciences, Others), By Region (North America, Europe, Asia Pacific, MEA, and CSA); End-User Landscape, Company Market Share Analysis, and Competitor Analysis](https://www.globalmarketestimates.com/images/cat/Electronics, Semiconductors and Information & Communication Technology.png)
This FREE sample includes market data points, ranging from trend analyses to market estimates & forecasts. See for yourself.
Or view our licence options:
Tailor made solutions just for you
80% of our clients seek made-to-order reports. How do you want us to tailor yours?
OUR CLIENTS


