This report was recently updated on August 27 2025 with the latest and most recent
market numbers
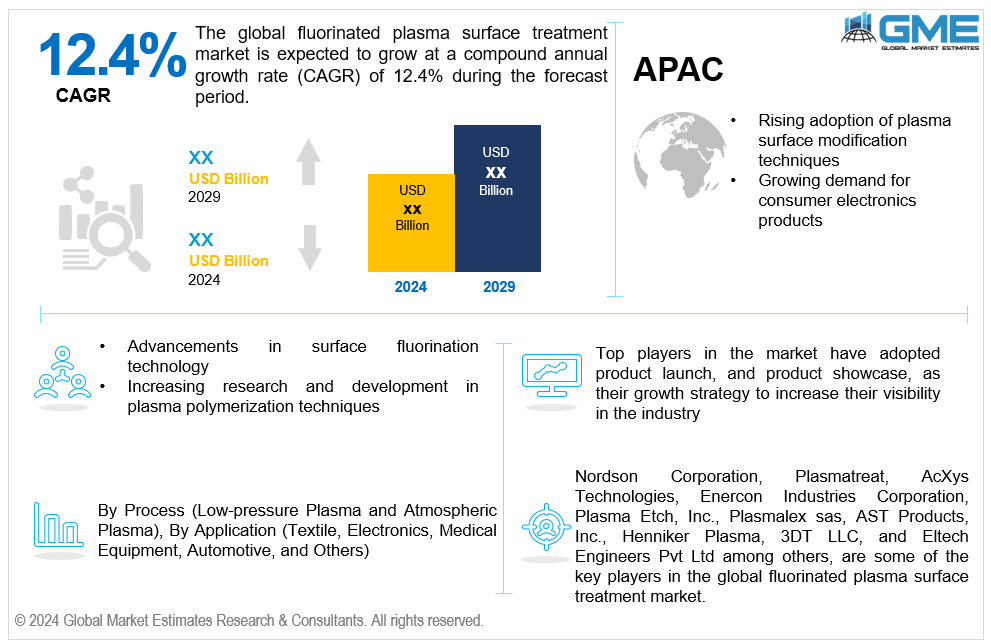
Global Fluorinated Plasma Surface Treatment Market Size, Trends & Analysis - Forecasts to 2029 By Process (Low-pressure Plasma and Atmospheric Plasma), By Application (Textile, Electronics, Medical Equipment, Automotive, and Others), and By Region (North America, Asia Pacific, Central and South America, Europe, and Middle East and Africa), Competitive Landscape,
The global fluorinated plasma surface treatment market is estimated to exhibit a CAGR of 12.4% from 2024 to 2029.
The primary factors propelling the market growth are the rising adoption of plasma surface modification techniques and growing demand for consumer electronics products. Electronic components like printed circuit boards (PCBs) and semiconductor devices can have their surface characteristics modified more easily with the help of fluorinated plasma processing. It improves adhesion and bonding between various materials used in electronic components by utilizing plasma surface engineering to increase surface energy and adhesive. Additionally, electronic components can have consistent, highly functional surfaces made possible by plasma surface engineering. This meets the strict quality requirements required by the electronics industry and improves dependability by lowering the possibility of failures caused by things like delamination, solder joint failures, or corrosion. For instance, according to the Digital Commerce 360, total online sales for the top 1000 companies in the consumer electronics grew by about USD 166 million in 2022.
Advancements in surface fluorination technology and increasing research and development in plasma polymerization techniques are expected to support the market growth. Innovations in plasma-enhanced fluorination, fluoropolymer surface treatment, and plasma-treated fluorinated surfaces coatings are among the important developments in surface fluorination methods that are driving the global market ahead. Surface modification techniques have been changed by these innovations, which offer superior qualities including improved adhesion, chemical resistance, and durability. Modern industries, from textiles to electronics, depend on these cutting-edge technologies to customize surfaces for specific applications.
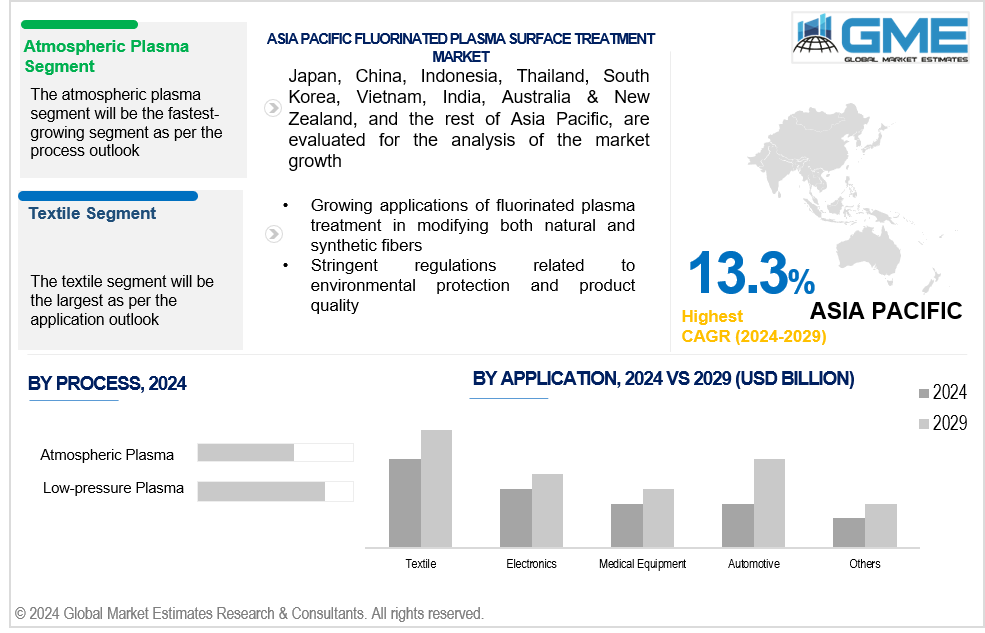
Growing applications of fluorinated plasma treatment in modifying both natural and synthetic fibers coupled with the stringent regulations related to environmental protection and product quality propel market growth. Fluorinated plasma treatment enhances the wettability surface, promotes surface bonding, and optimizes surface properties. This method finds extensive use in treating various materials, including glass fibers and elastomers. As industries seek improved performance and durability of materials, the demand for fluorinated plasma surface treatment continues to rise, spurred by its ability to enhance surface characteristics critical for bonding and functionality in diverse applications.
With the growing demand for packaged goods globally, especially in the food and beverage sector, there is a significant opportunity for the fluorinated plasma surface treatment market to cater to the needs of the packaging industry. Furthermore, by enhancing the surface properties of materials used in solar panels and wind turbines systems, fluorinated plasma surface treatment can contribute to increased efficiency and durability, thereby presenting opportunities in the renewable energy sector.
However, high initial implementation cost and limited material compatibility impede market growth.
The low-pressure plasma segment is expected to hold the largest share of the market over the forecast period. Low-pressure plasma systems typically offer better control over the treatment process, which provide consistent surface alteration across broad regions or complex shapes. This ability is critical for sectors requiring constant surface qualities for product performance and dependability, such as electronics, automotive, and medical devices.
The atmospheric plasma segment is expected to be the fastest-growing segment in the market from 2024 to 2029. The vacuum chambers and related equipment needed for low-pressure plasma systems are not necessary for atmospheric plasma systems, which typically run at atmospheric pressure. Therefore, a wider range of industries and applications can more easily access atmospheric plasma treatment due to reduced operational and capital expenses.
The textile segment is expected to hold the largest share of the market over the forecast period. Textiles with a fluorinated plasma surface treatment have better surface qualities, including stain resistance, durability, oil and water repellency, and stain resistance. These enhancements improve the functionality and performance of textiles, making them appropriate for a variety of uses in upholstery, technical textiles, outdoor gear, and clothing.
The automotive segment is anticipated to be the fastest-growing segment in the market from 2024 to 2029. Automotive parts are protected from corrosion, oxidation, and environmental deterioration by a barrier formed by the fluorinated plasma treatment. The durability and attractiveness of automobile parts exposed to external or corrosive environments are improved by treated surfaces, which show enhanced resistance to moisture, chemicals, salt spray, and severe weather.
North America is expected to be the largest region in the global market. The region's market is growing as a result of North America's strict quality standards and regulatory regulations regarding product safety, performance, and environmental effect. Fluorinated plasma surface treatment is being adopted by a variety of industries as it provides solutions for satisfying these regulatory requirements by boosting surface qualities, assuring conformity with industry standards, and improving product dependability.
Asia Pacific is anticipated to witness rapid growth during the forecast period. Asia Pacific is the main global center for the production of electronics and semiconductors, with South Korea and China among its leading manufacturers. Driven by the need for high-performance electronic components and devices, fluorinated plasma surface treatment is widely utilized in the electronics sector to improve adhesion, solderability, and surface cleanliness.
Nordson Corporation, Plasmatreat, AcXys Technologies, Enercon Industries Corporation, Plasma Etch, Inc., Plasmalex sas, AST Products, Inc., Henniker Plasma, 3DT LLC, and Eltech Engineers Pvt Ltd among others, are some of the key players in the global fluorinated plasma surface treatment market.
Please note: This is not an exhaustive list of companies profiled in the report.
In March 2024, the Nordson Corporation said that during SEMICON China 2024, it would showcase automated fluid dispensing systems and plasma treatment for the electronics manufacturing industry.
In February 2024, joining up with PlasmaBound, AcXys Technologies will showcase the surface preparation process at JEC World 2024. The premier event for the composites materials business, JEC World is held in Paris and features live equipment demonstrations and presentations of the newest innovations, including the creation of sustainable composites.
1 STRATEGIC INSIGHTS ON NEW REVENUE POCKETS
1.1 Strategic Opportunity & Attractiveness Analysis
1.1.1 Hot Revenue Pockets
1.1.2 Market Attractiveness Score
1.1.3 Revenue Impacting Opportunity
1.1.4 High Growing Region/Country
1.1.5 Competitor Analysis
1.1.6 Consumer Analysis
1.2 Global Market Estimates' View
1.3 Strategic Insights across Business Functions
1.3.1 For Chief Executive Officers
1.3.2 For Chief Marketing Officers
1.3.3 For Chief Strategy Officers
1.4 Evaluate the Potential of your Existing Business Lines vs. New Lines to Enter Into
2 TECHNOLOGICAL TRENDS
2.1 Technological Adoption Rate
2.2 Current Trend Impact Analysis
2.3 Future Trend Impact Analysis
3 GLOBAL MARKET OUTLOOK
3.1 Market Pyramid Analysis
3.1.1 Introduction
3.1.2 Adjacent Market Opportunities
3.1.3 Ancillary Market Opportunities
3.2 Demand Side Analysis
3.2.1 Market Drivers: Impact Analysis
3.2.2 Market Restraints: Impact Analysis
3.2.3 Market Opportunities: Impact Analysis
3.2.4 Market Challenges: Impact Analysis
3.3 Supply Side Analysis
3.3.1 Porter’s Five Forces Analysis
3.3.1.1 Threat of New Entrants
3.3.1.2 Threat of New Substitutes
3.3.1.3 Bargaining Power of Suppliers
3.3.1.4 Bargaining Power of Buyers
3.3.1.5 Intensity of Competitive Rivalry
3.3.2 SWOT Analysis; By Factor (Political & Legal, Economic, and Technological)
3.3.2.1 Political Landscape
3.3.2.2 Economic Landscape
3.3.2.3 Social Landscape
3.3.2.4 Technology Landscape
3.3.3 Value Chain Analysis
3.3.4 Trend Analysis
3.3.5 Gap Analysis
3.3.6 Cost Analysis
4 GLOBAL FLUORINATED PLASMA SURFACE TREATMENT MARKET, BY Process
4.1 Introduction
4.2 Fluorinated Plasma Surface Treatment Market: Process Scope Key Takeaways
4.3 Revenue Growth Analysis, 2023 & 2029
4.4 Low-pressure Plasma
4.4.1 Low-pressure Plasma Market Estimates and Forecast, 2021-2029 (USD Million)
4.5 Atmospheric Plasma
4.5.1 Atmospheric Plasma Market Estimates and Forecast, 2021-2029 (USD Million)
5 GLOBAL FLUORINATED PLASMA SURFACE TREATMENT MARKET, BY APPLICATION
5.1 Introduction
5.2 Fluorinated Plasma Surface Treatment Market: Type Scope Key Takeaways
5.3 Revenue Growth Analysis, 2023 & 2029
5.4 Textile
5.4.1 Textile Market Estimates and Forecast, 2021-2029 (USD Million)
5.5 Electronics
5.5.1 Electronics Market Estimates and Forecast, 2021-2029 (USD Million)
5.6 Medical Equipment
5.6.1 Medical Equipment Market Estimates and Forecast, 2021-2029 (USD Million)
5.7 Automotive
5.7.1 Automotive Market Estimates and Forecast, 2021-2029 (USD Million)
5.8 Others
5.8.1 Others Market Estimates and Forecast, 2021-2029 (USD Million)
6 GLOBAL FLUORINATED PLASMA SURFACE TREATMENT MARKET, BY REGION
6.1 Introduction
6.2 North America Fluorinated Plasma Surface Treatment Market Estimates and Forecast, 2021-2029 (USD Million)
6.2.1 By Process
6.2.2 By Application
6.2.3 By Country
6.2.3.1 U.S. Fluorinated Plasma Surface Treatment Market Estimates and Forecast, 2021-2029 (USD Million)
6.2.3.1.1 By Process
6.2.3.1.2 By Application
6.2.3.2 Canada Fluorinated Plasma Surface Treatment Market Estimates and Forecast, 2021-2029 (USD Million)
6.2.3.2.1 By Process
6.2.3.2.2 By Application
6.2.3.3 Mexico Fluorinated Plasma Surface Treatment Market Estimates and Forecast, 2021-2029 (USD Million)
6.2.3.3.1 By Process
6.2.3.3.2 By Application
6.3 Europe Fluorinated Plasma Surface Treatment Market Estimates and Forecast, 2021-2029 (USD Million)
6.3.1 By Process
6.3.2 By Application
6.3.3 By Country
6.3.3.1 Germany Fluorinated Plasma Surface Treatment Market Estimates and Forecast, 2021-2029 (USD Million)
6.3.3.1.1 By Process
6.3.3.1.2 By Application
6.3.3.2 U.K. Fluorinated Plasma Surface Treatment Market Estimates and Forecast, 2021-2029 (USD Million)
6.3.3.2.1 By Process
6.3.3.2.2 By Application
6.3.3.3 France Fluorinated Plasma Surface Treatment Market Estimates and Forecast, 2021-2029 (USD Million)
6.3.3.3.1 By Process
6.3.3.3.2 By Application
6.3.3.4 Italy Fluorinated Plasma Surface Treatment Market Estimates and Forecast, 2021-2029 (USD Million)
6.3.3.4.1 By Process
6.3.3.4.2 By Application
6.3.3.5 Spain Fluorinated Plasma Surface Treatment Market Estimates and Forecast, 2021-2029 (USD Million)
6.3.3.5.1 By Process
6.3.3.5.2 By Application
6.3.3.6 Netherlands Fluorinated Plasma Surface Treatment Market Estimates and Forecast, 2021-2029 (USD Million)
6.3.3.6.1 By Process
6.3.3.6.2 By Application
6.3.3.7 Rest of Europe Fluorinated Plasma Surface Treatment Market Estimates and Forecast, 2021-2029 (USD Million)
6.3.3.6.1 By Process
6.3.3.6.2 By Application
6.4 Asia Pacific Fluorinated Plasma Surface Treatment Market Estimates and Forecast, 2021-2029 (USD Million)
6.4.1 By Process
6.4.2 By Application
6.4.3 By Country
6.4.3.1 China Fluorinated Plasma Surface Treatment Market Estimates and Forecast, 2021-2029 (USD Million)
6.4.3.1.1 By Process
6.4.3.1.2 By Application
6.4.3.2 Japan Fluorinated Plasma Surface Treatment Market Estimates and Forecast, 2021-2029 (USD Million)
6.4.3.2.1 By Process
6.4.3.2.2 By Application
6.4.3.3 India Fluorinated Plasma Surface Treatment Market Estimates and Forecast, 2021-2029 (USD Million)
6.4.3.3.1 By Process
6.4.3.3.2 By Application
6.4.3.4 South Korea Fluorinated Plasma Surface Treatment Market Estimates and Forecast, 2021-2029 (USD Million)
6.4.3.4.1 By Process
6.4.3.4.2 By Application
6.4.3.5 Singapore Fluorinated Plasma Surface Treatment Market Estimates and Forecast, 2021-2029 (USD Million)
6.4.3.5.1 By Process
6.4.3.5.2 By Application
6.4.3.6 Malaysia Fluorinated Plasma Surface Treatment Market Estimates and Forecast, 2021-2029 (USD Million)
6.4.3.6.1 By Process
6.4.3.6.2 By Application
6.4.3.7 Thailand Fluorinated Plasma Surface Treatment Market Estimates and Forecast, 2021-2029 (USD Million)
6.4.3.6.1 By Process
6.4.3.6.2 By Application
6.4.3.8 Indonesia Fluorinated Plasma Surface Treatment Market Estimates and Forecast, 2021-2029 (USD Million)
6.4.3.7.1 By Process
6.4.3.7.2 By Application
6.4.3.9 Vietnam Fluorinated Plasma Surface Treatment Market Estimates and Forecast, 2021-2029 (USD Million)
6.4.3.8.1 By Process
6.4.3.8.2 By Application
6.4.3.10 Taiwan Fluorinated Plasma Surface Treatment Market Estimates and Forecast, 2021-2029 (USD Million)
6.4.3.10.1 By Process
6.4.3.10.2 By Application
6.4.3.11 Rest of Asia Pacific Fluorinated Plasma Surface Treatment Market Estimates and Forecast, 2021-2029 (USD Million)
6.4.3.11.1 By Process
6.4.3.11.2 By Application
6.5 Middle East and Africa Fluorinated Plasma Surface Treatment Market Estimates and Forecast, 2021-2029 (USD Million)
6.5.1 By Process
6.5.2 By Application
6.5.3 By Country
6.5.3.1 Saudi Arabia Fluorinated Plasma Surface Treatment Market Estimates and Forecast, 2021-2029 (USD Million)
6.5.3.1.1 By Process
6.5.3.1.2 By Application
6.5.3.2 U.A.E. Fluorinated Plasma Surface Treatment Market Estimates and Forecast, 2021-2029 (USD Million)
6.5.3.2.1 By Process
6.5.3.2.2 By Application
6.5.3.3 Israel Fluorinated Plasma Surface Treatment Market Estimates and Forecast, 2021-2029 (USD Million)
6.5.3.3.1 By Process
6.5.3.3.2 By Application
6.5.3.4 South Africa Fluorinated Plasma Surface Treatment Market Estimates and Forecast, 2021-2029 (USD Million)
6.5.3.4.1 By Process
6.5.3.4.2 By Application
6.5.3.5 Rest of Middle East and Africa Fluorinated Plasma Surface Treatment Market Estimates and Forecast, 2021-2029 (USD Million)
6.5.3.5.1 By Process
6.5.3.5.2 By Application
6.6 Central and South America Fluorinated Plasma Surface Treatment Market Estimates and Forecast, 2021-2029 (USD Million)
6.6.1 By Process
6.6.2 By Application
6.6.3 By Country
6.6.3.1 Brazil Fluorinated Plasma Surface Treatment Market Estimates and Forecast, 2021-2029 (USD Million)
6.6.3.1.1 By Process
6.6.3.1.2 By Application
6.6.3.2 Argentina Fluorinated Plasma Surface Treatment Market Estimates and Forecast, 2021-2029 (USD Million)
6.6.3.2.1 By Process
6.6.3.2.2 By Application
6.6.3.3 Chile Fluorinated Plasma Surface Treatment Market Estimates and Forecast, 2021-2029 (USD Million)
6.6.3.3.1 By Process
6.6.3.3.2 By Application
6.6.3.3 Rest of Central and South America Fluorinated Plasma Surface Treatment Market Estimates and Forecast, 2021-2029 (USD Million)
6.6.3.3.1 By Process
6.6.3.3.2 By Application
7 COMPETITIVE LANDCAPE
7.1 Company Market Share Analysis
7.2 Four Quadrant Positioning Matrix
7.2.1 Market Leaders
7.2.2 Market Visionaries
7.2.3 Market Challengers
7.2.4 Niche Market Players
7.3 Vendor Landscape
7.3.1 North America
7.3.2 Europe
7.3.3 Asia Pacific
7.3.4 Rest of the World
7.4 Company Profiles
7.4.1 Nordson Corporation
7.4.1.1 Business Description & Financial Analysis
7.4.1.2 SWOT Analysis
7.4.1.3 Products & Services Offered
7.4.1.4 Strategic Alliances between Business Partners
7.4.2 Plasmatreat
7.4.2.1 Business Description & Financial Analysis
7.4.2.2 SWOT Analysis
7.4.2.3 Products & Services Offered
7.4.2.4 Strategic Alliances between Business Partners
7.4.3 AcXys Technologies
7.4.3.1 Business Description & Financial Analysis
7.4.3.2 SWOT Analysis
7.4.3.3 Products & Services Offered
7.4.3.4 Strategic Alliances between Business Partners
7.4.4 Enercon Industries Corporation
7.4.4.1 Business Description & Financial Analysis
7.4.4.2 SWOT Analysis
7.4.4.3 Products & Services Offered
7.4.4.4 Strategic Alliances between Business Partners
7.4.5 Plasma Etch, Inc.
7.4.5.1 Business Description & Financial Analysis
7.4.5.2 SWOT Analysis
7.4.5.3 Products & Services Offered
7.4.5.4 Strategic Alliances between Business Partners
7.4.6 PLASMALEX SAS
7.4.6.1 Business Description & Financial Analysis
7.4.6.2 SWOT Analysis
7.4.6.3 Products & Services Offered
7.4.6.4 Strategic Alliances between Business Partners
7.4.7 AST Products, Inc.
7.4.7.1 Business Description & Financial Analysis
7.4.7.2 SWOT Analysis
7.4.7.3 Products & Services Offered
7.4.7.4 Strategic Alliances between Business Partners
7.4.8 Henniker Plasma
7.4.8.1 Business Description & Financial Analysis
7.4.8.2 SWOT Analysis
7.4.8.3 Products & Services Offered
7.4.8.4 Strategic Alliances between Business Partners
7.4.9 3DT LLC
7.4.9.1 Business Description & Financial Analysis
7.4.9.2 SWOT Analysis
7.4.9.3 Products & Services Offered
7.4.9.4 Strategic Alliances between Business Partners
7.4.10 Eltech Engineers Pvt Ltd
7.4.10.1 Business Description & Financial Analysis
7.4.10.2 SWOT Analysis
7.4.10.3 Products & Services Offered
7.4.10.4 Strategic Alliances between Business Partners
7.4.11 Other Companies
7.4.11.1 Business Description & Financial Analysis
7.4.11.2 SWOT Analysis
7.4.11.3 Products & Services Offered
7.4.11.4 Strategic Alliances between Business Partners
8 RESEARCH METHODOLOGY
8.1 Market Introduction
8.1.1 Market Definition
8.1.2 Market Scope & Segmentation
8.2 Information Procurement
8.2.1 Secondary Research
8.2.1.1 Purchased Databases
8.2.1.2 GMEs Internal Data Repository
8.2.1.3 Secondary Resources & Third Party Perspectives
8.2.1.4 Company Information Sources
8.2.2 Primary Research
8.2.2.1 Various Type of Respondents for Primary Interviews
8.2.2.2 Number of Interviews Conducted throughout the Research Process
8.2.2.3 Primary Stakeholders
8.2.2.4 Discussion Guide for Primary Participants
8.2.3 Expert Panels
8.2.3.1 Expert Panels Across 30+ Industry
8.2.4 Paid Local Experts
8.2.4.1 Paid Local Experts Across 30+ Industry Across each Region
8.3 Market Estimation
8.3.1 Top-Down Approach
8.3.1.1 Macro-Economic Indicators Considered
8.3.1.2 Micro-Economic Indicators Considered
8.3.2 Bottom Up Approach
8.3.2.1 Company Share Analysis Approach
8.3.2.2 Estimation of Potential Product Sales
8.4 Data Triangulation
8.4.1 Data Collection
8.4.2 Time Series, Cross Sectional & Panel Data Analysis
8.4.3 Cluster Analysis
8.5 Analysis and Output
8.5.1 Inhouse AI Based Real Time Analytics Tool
8.5.2 Output From Desk & Primary Research
8.6 Research Assumptions & Limitations
8.6.1 Research Assumptions
8.6.2 Research Limitations
LIST OF TABLES
1 Global Fluorinated Plasma Surface Treatment Market, By Process, 2021-2029 (USD Mllion)
2 Low-pressure Plasma Market, By Region, 2021-2029 (USD Mllion)
3 Atmospheric Plasma Market, By Region, 2021-2029 (USD Mllion)
4 Global Fluorinated Plasma Surface Treatment Market, By Application, 2021-2029 (USD Mllion)
5 Textile Market, By Region, 2021-2029 (USD Mllion)
6 Electronics Market, By Region, 2021-2029 (USD Mllion)
7 Medical Equipment Market, By Region, 2021-2029 (USD Mllion)
8 Automotive Market, By Region, 2021-2029 (USD Mllion)
9 Others Market, By Region, 2021-2029 (USD Mllion)
10 Regional Analysis, 2021-2029 (USD Mllion)
11 North America Fluorinated Plasma Surface Treatment Market, By Process, 2021-2029 (USD Mllion)
12 North America Fluorinated Plasma Surface Treatment Market, By Application, 2021-2029 (USD Mllion)
13 North America Fluorinated Plasma Surface Treatment Market, By COUNTRY, 2021-2029 (USD Mllion)
14 U.S. Fluorinated Plasma Surface Treatment Market, By Process, 2021-2029 (USD Mllion)
15 U.S. Fluorinated Plasma Surface Treatment Market, By Application, 2021-2029 (USD Mllion)
16 Canada Fluorinated Plasma Surface Treatment Market, By Process, 2021-2029 (USD Mllion)
17 Canada Fluorinated Plasma Surface Treatment Market, By Application, 2021-2029 (USD Mllion)
18 Mexico Fluorinated Plasma Surface Treatment Market, By Process, 2021-2029 (USD Mllion)
19 Mexico Fluorinated Plasma Surface Treatment Market, By Application, 2021-2029 (USD Mllion)
20 Europe Fluorinated Plasma Surface Treatment Market, By Process, 2021-2029 (USD Mllion)
21 Europe Fluorinated Plasma Surface Treatment Market, By Application, 2021-2029 (USD Mllion)
22 EUROPE Fluorinated Plasma Surface Treatment Market, By COUNTRY, 2021-2029 (USD Mllion)
23 Germany Fluorinated Plasma Surface Treatment Market, By Process, 2021-2029 (USD Mllion)
24 Germany Fluorinated Plasma Surface Treatment Market, By Application, 2021-2029 (USD Mllion)
25 U.K. Fluorinated Plasma Surface Treatment Market, By Process, 2021-2029 (USD Mllion)
26 U.K. Fluorinated Plasma Surface Treatment Market, By Application, 2021-2029 (USD Mllion)
27 France Fluorinated Plasma Surface Treatment Market, By Process, 2021-2029 (USD Mllion)
28 France Fluorinated Plasma Surface Treatment Market, By Application, 2021-2029 (USD Mllion)
29 Italy Fluorinated Plasma Surface Treatment Market, By Process, 2021-2029 (USD Mllion)
30 Italy Fluorinated Plasma Surface Treatment Market, By Application, 2021-2029 (USD Mllion)
31 Spain Fluorinated Plasma Surface Treatment Market, By Process, 2021-2029 (USD Mllion)
32 Spain Fluorinated Plasma Surface Treatment Market, By Application, 2021-2029 (USD Mllion)
33 Netherlands Fluorinated Plasma Surface Treatment Market, By Process, 2021-2029 (USD Mllion)
34 Netherlands Fluorinated Plasma Surface Treatment Market, By Application, 2021-2029 (USD Mllion)
35 Rest Of Europe Fluorinated Plasma Surface Treatment Market, By Process, 2021-2029 (USD Mllion)
36 Rest Of Europe Fluorinated Plasma Surface Treatment Market, By Application, 2021-2029 (USD Mllion)
37 Asia Pacific Fluorinated Plasma Surface Treatment Market, By Process, 2021-2029 (USD Mllion)
38 Asia Pacific Fluorinated Plasma Surface Treatment Market, By Application, 2021-2029 (USD Mllion)
39 ASIA PACIFIC Fluorinated Plasma Surface Treatment Market, By COUNTRY, 2021-2029 (USD Mllion)
40 China Fluorinated Plasma Surface Treatment Market, By Process, 2021-2029 (USD Mllion)
41 China Fluorinated Plasma Surface Treatment Market, By Application, 2021-2029 (USD Mllion)
42 Japan Fluorinated Plasma Surface Treatment Market, By Process, 2021-2029 (USD Mllion)
43 Japan Fluorinated Plasma Surface Treatment Market, By Application, 2021-2029 (USD Mllion)
44 India Fluorinated Plasma Surface Treatment Market, By Process, 2021-2029 (USD Mllion)
45 India Fluorinated Plasma Surface Treatment Market, By Application, 2021-2029 (USD Mllion)
46 South Korea Fluorinated Plasma Surface Treatment Market, By Process, 2021-2029 (USD Mllion)
47 South Korea Fluorinated Plasma Surface Treatment Market, By Application, 2021-2029 (USD Mllion)
48 Singapore Fluorinated Plasma Surface Treatment Market, By Process, 2021-2029 (USD Mllion)
49 Singapore Fluorinated Plasma Surface Treatment Market, By Application, 2021-2029 (USD Mllion)
50 Thailand Fluorinated Plasma Surface Treatment Market, By Process, 2021-2029 (USD Mllion)
51 Thailand Fluorinated Plasma Surface Treatment Market, By Application, 2021-2029 (USD Mllion)
52 Malaysia Fluorinated Plasma Surface Treatment Market, By Process, 2021-2029 (USD Mllion)
53 Malaysia Fluorinated Plasma Surface Treatment Market, By Application, 2021-2029 (USD Mllion)
54 Indonesia Fluorinated Plasma Surface Treatment Market, By Process, 2021-2029 (USD Mllion)
55 Indonesia Fluorinated Plasma Surface Treatment Market, By Application, 2021-2029 (USD Mllion)
56 Vietnam Fluorinated Plasma Surface Treatment Market, By Process, 2021-2029 (USD Mllion)
57 Vietnam Fluorinated Plasma Surface Treatment Market, By Application, 2021-2029 (USD Mllion)
58 Taiwan Fluorinated Plasma Surface Treatment Market, By Process, 2021-2029 (USD Mllion)
59 Taiwan Fluorinated Plasma Surface Treatment Market, By Application, 2021-2029 (USD Mllion)
60 Rest of APAC Fluorinated Plasma Surface Treatment Market, By Process, 2021-2029 (USD Mllion)
61 Rest of APAC Fluorinated Plasma Surface Treatment Market, By Application, 2021-2029 (USD Mllion)
62 Middle East and Africa Fluorinated Plasma Surface Treatment Market, By Process, 2021-2029 (USD Mllion)
63 Middle East and Africa Fluorinated Plasma Surface Treatment Market, By Application, 2021-2029 (USD Mllion)
64 MIDDLE EAST & ADRICA Fluorinated Plasma Surface Treatment Market, By COUNTRY, 2021-2029 (USD Mllion)
65 Saudi Arabia Fluorinated Plasma Surface Treatment Market, By Process, 2021-2029 (USD Mllion)
66 Saudi Arabia Fluorinated Plasma Surface Treatment Market, By Application, 2021-2029 (USD Mllion)
67 UAE Fluorinated Plasma Surface Treatment Market, By Process, 2021-2029 (USD Mllion)
68 UAE Fluorinated Plasma Surface Treatment Market, By Application, 2021-2029 (USD Mllion)
69 Israel Fluorinated Plasma Surface Treatment Market, By Process, 2021-2029 (USD Mllion)
70 Israel Fluorinated Plasma Surface Treatment Market, By Application, 2021-2029 (USD Mllion)
71 South Africa Fluorinated Plasma Surface Treatment Market, By Process, 2021-2029 (USD Mllion)
72 South Africa Fluorinated Plasma Surface Treatment Market, By Application, 2021-2029 (USD Mllion)
73 Rest Of Middle East and Africa Fluorinated Plasma Surface Treatment Market, By Process, 2021-2029 (USD Mllion)
74 Rest Of Middle East and Africa Fluorinated Plasma Surface Treatment Market, By Application, 2021-2029 (USD Mllion)
75 Central and South America Fluorinated Plasma Surface Treatment Market, By Process, 2021-2029 (USD Mllion)
76 Central and South America Fluorinated Plasma Surface Treatment Market, By Application, 2021-2029 (USD Mllion)
77 CENTRAL AND SOUTH AMERICA Fluorinated Plasma Surface Treatment Market, By COUNTRY, 2021-2029 (USD Mllion)
78 Brazil Fluorinated Plasma Surface Treatment Market, By Process, 2021-2029 (USD Mllion)
79 Brazil Fluorinated Plasma Surface Treatment Market, By Application, 2021-2029 (USD Mllion)
80 Chile Fluorinated Plasma Surface Treatment Market, By Process, 2021-2029 (USD Mllion)
81 Chile Fluorinated Plasma Surface Treatment Market, By Application, 2021-2029 (USD Mllion)
82 Argentina Fluorinated Plasma Surface Treatment Market, By Process, 2021-2029 (USD Mllion)
83 Argentina Fluorinated Plasma Surface Treatment Market, By Application, 2021-2029 (USD Mllion)
84 Rest Of Central and South America Fluorinated Plasma Surface Treatment Market, By Process, 2021-2029 (USD Mllion)
85 Rest Of Central and South America Fluorinated Plasma Surface Treatment Market, By Application, 2021-2029 (USD Mllion)
86 Nordson Corporation: Products & Services Offering
87 Plasmatreat: Products & Services Offering
88 AcXys Technologies: Products & Services Offering
89 Enercon Industries Corporation: Products & Services Offering
90 Plasma Etch, Inc.: Products & Services Offering
91 PLASMALEX SAS: Products & Services Offering
92 AST Products, Inc. : Products & Services Offering
93 Henniker Plasma: Products & Services Offering
94 3DT LLC, Inc: Products & Services Offering
95 Eltech Engineers Pvt Ltd: Products & Services Offering
96 Other Companies: Products & Services Offering
LIST OF FIGURES
1 Global Fluorinated Plasma Surface Treatment Market Overview
2 Global Fluorinated Plasma Surface Treatment Market Value From 2021-2029 (USD Mllion)
3 Global Fluorinated Plasma Surface Treatment Market Share, By Process (2023)
4 Global Fluorinated Plasma Surface Treatment Market Share, By Application (2023)
5 Global Fluorinated Plasma Surface Treatment Market, By Region (Asia Pacific Market)
6 Technological Trends In Global Fluorinated Plasma Surface Treatment Market
7 Four Quadrant Competitor Positioning Matrix
8 Impact Of Macro & Micro Indicators On The Market
9 Impact Of Key Drivers On The Global Fluorinated Plasma Surface Treatment Market
10 Impact Of Challenges On The Global Fluorinated Plasma Surface Treatment Market
11 Porter’s Five Forces Analysis
12 Global Fluorinated Plasma Surface Treatment Market: By Process Scope Key Takeaways
13 Global Fluorinated Plasma Surface Treatment Market, By Process Segment: Revenue Growth Analysis
14 Low-pressure Plasma Market, By Region, 2021-2029 (USD Mllion)
15 Atmospheric Plasma Market, By Region, 2021-2029 (USD Mllion)
16 Global Fluorinated Plasma Surface Treatment Market: By Application Scope Key Takeaways
17 Global Fluorinated Plasma Surface Treatment Market, By Application Segment: Revenue Growth Analysis
18 Textile Market, By Region, 2021-2029 (USD Mllion)
19 Electronics Market, By Region, 2021-2029 (USD Mllion)
20 Medical Equipment Market, By Region, 2021-2029 (USD Mllion)
21 Automotive Market, By Region, 2021-2029 (USD Mllion)
22 Others Market, By Region, 2021-2029 (USD Mllion)
23 Global Fluorinated Plasma Surface Treatment Market: Regional Analysis
24 North America Fluorinated Plasma Surface Treatment Market Overview
25 North America Fluorinated Plasma Surface Treatment Market, By Process
26 North America Fluorinated Plasma Surface Treatment Market, By Application
27 North America Fluorinated Plasma Surface Treatment Market, By Country
28 U.S. Fluorinated Plasma Surface Treatment Market, By Process
29 U.S. Fluorinated Plasma Surface Treatment Market, By Application
30 Canada Fluorinated Plasma Surface Treatment Market, By Process
31 Canada Fluorinated Plasma Surface Treatment Market, By Application
32 Mexico Fluorinated Plasma Surface Treatment Market, By Process
33 Mexico Fluorinated Plasma Surface Treatment Market, By Application
34 Four Quadrant Positioning Matrix
35 Company Market Share Analysis
36 Nordson Corporation: Company Snapshot
37 Nordson Corporation: SWOT Analysis
38 Nordson Corporation: Geographic Presence
39 Plasmatreat: Company Snapshot
40 Plasmatreat: SWOT Analysis
41 Plasmatreat: Geographic Presence
42 AcXys Technologies: Company Snapshot
43 AcXys Technologies: SWOT Analysis
44 AcXys Technologies: Geographic Presence
45 Enercon Industries Corporation: Company Snapshot
46 Enercon Industries Corporation: Swot Analysis
47 Enercon Industries Corporation: Geographic Presence
48 Plasma Etch, Inc.: Company Snapshot
49 Plasma Etch, Inc.: SWOT Analysis
50 Plasma Etch, Inc.: Geographic Presence
51 PLASMALEX SAS: Company Snapshot
52 PLASMALEX SAS: SWOT Analysis
53 PLASMALEX SAS: Geographic Presence
54 AST Products, Inc. : Company Snapshot
55 AST Products, Inc. : SWOT Analysis
56 AST Products, Inc. : Geographic Presence
57 Henniker Plasma: Company Snapshot
58 Henniker Plasma: SWOT Analysis
59 Henniker Plasma: Geographic Presence
60 3DT LLC, Inc.: Company Snapshot
61 3DT LLC, Inc.: SWOT Analysis
62 3DT LLC, Inc.: Geographic Presence
63 Eltech Engineers Pvt Ltd: Company Snapshot
64 Eltech Engineers Pvt Ltd: SWOT Analysis
65 Eltech Engineers Pvt Ltd: Geographic Presence
66 Other Companies: Company Snapshot
67 Other Companies: SWOT Analysis
68 Other Companies: Geographic Presence
The Global Fluorinated Plasma Surface Treatment Market has been studied from the year 2019 till 2029. However, the CAGR provided in the report is from the year 2024 to 2029. The research methodology involved three stages: Desk research, Primary research, and Analysis & Output from the entire research process.

The desk research involved a robust background study which meant referring to paid and unpaid databases to understand the market dynamics; mapping contracts from press releases; identifying the key players in the market, studying their product portfolio, competition level, annual reports/SEC filings & investor presentations; and learning the demand and supply-side analysis for the Fluorinated Plasma Surface Treatment Market.

The primary research activity included telephonic conversations with more than 50 tier 1 industry consultants, distributors, and end-use product manufacturers.

Finally, based on the above thorough research process, an in-depth analysis was carried out considering the following aspects: market attractiveness, current & future market trends, market share analysis, SWOT analysis of the company and customer analytics.

Frequently Asked Questions

This FREE sample includes market data points, ranging from trend analyses to market estimates & forecasts. See for yourself.
Or view our licence options:
Tailor made solutions just for you
80% of our clients seek made-to-order reports. How do you want us to tailor yours?
OUR CLIENTS


