This report was recently updated on July 8 2025 with the latest and most recent
market numbers
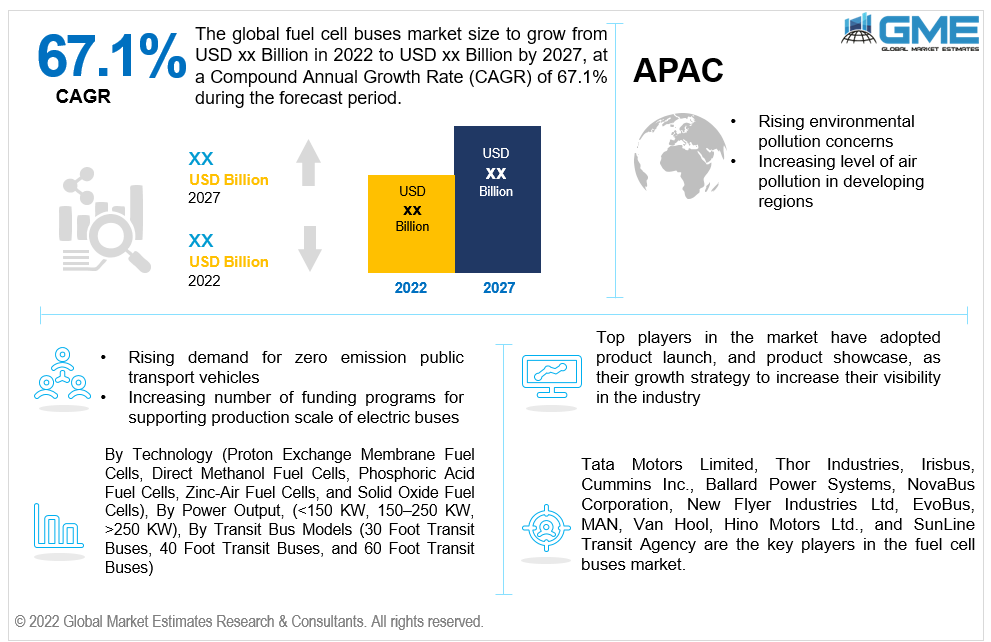
Global Fuel Cell Buses Market Size, Trends & Analysis - Forecasts to 2027 By Technology (Proton Exchange Membrane Fuel Cells, Direct Methanol Fuel Cells, Phosphoric Acid Fuel Cells, Zinc-Air Fuel Cells, and Solid Oxide Fuel Cells), By Power Output, (<150 KW, 150–250 KW, >250 KW), By Transit Bus Models (30 Foot Transit Buses, 40 Foot Transit Buses, and 60 Foot Transit Buses), By Region (North America, Asia Pacific, Central & South America, Europe, and the Middle East and Africa), Company Market Share Analysis, and Competitor Analysis
The global fuel cell buses market is projected to grow at a CAGR value of 67.1% from 2022 to 2027.
Fuel cell buses are electric vehicles that run on hydrogen fuel cell and work on capacitors or batteries. Such fuel buses gain all the energy for the vehicle operation from the hydrogen source and, the batteries/capacitors offer power output to the motors in order to meet the demand for gradients and rapid acceleration.
The major reason for the fuel cell buses market to grow rapidly in terms of adoption is that the hydrogen based fuel system offers higher energy density compared to other electrical storage systems. This in turn helps the vehicle to run for a longer range as compared to other battery based vehicles. Another advantage of fuel cell buses is that the refuelling of the bus takes around 7-8 minutes which is sufficient for the bus to run for 24 hours. A fuel cell electric bus does not require any additional city infrastructure work or permits other than a centralized hydrogen refuelling station (HRS) at the bus depot. Moreover, the fuel cell electric bus is a zero emission solution that has been a boon for the automotive industry, with efficiency which as equal as of a regular diesel bus. Hence these advantages have helped to accelerate the adoption of the fuel cell buses market across the globe.
The key factors positively impacting the growth of the fuel cell buses market includes rapidly rising environmental pollution concerns, increasing level of air pollution in developing regions, rising demand for zero emission public transport vehicles by various government bodies, increasing number of funding programs for launching and supporting production scale of electric buses, and rising government initiatives for launching hydrogen fuel cell infrastructures.
Moreover, increasing cost of gas and diesel across the globe due to socio-economic factors, rising awareness regarding high efficiency of fuel cell over gasoline, longer driving range efficiency offered by fuel cell buses, faster refuelling time, are some of the drivers supporting the growth of the market.
The COVID-19 pandemic has not served well for the electric vehicle industry and especially the fuel cell buses business. With the worldwide lockdown and closure of manufacturing sites, the market greatly suffered from shortage of raw material supplies, lack of manpower for manufacturing sites, and lack of successful business strategy execution process. However, with the rising gasoline prices, and increasing demand for environment friendly vehicles, the market is expected to grow at a steady rate in the post pandemic era.
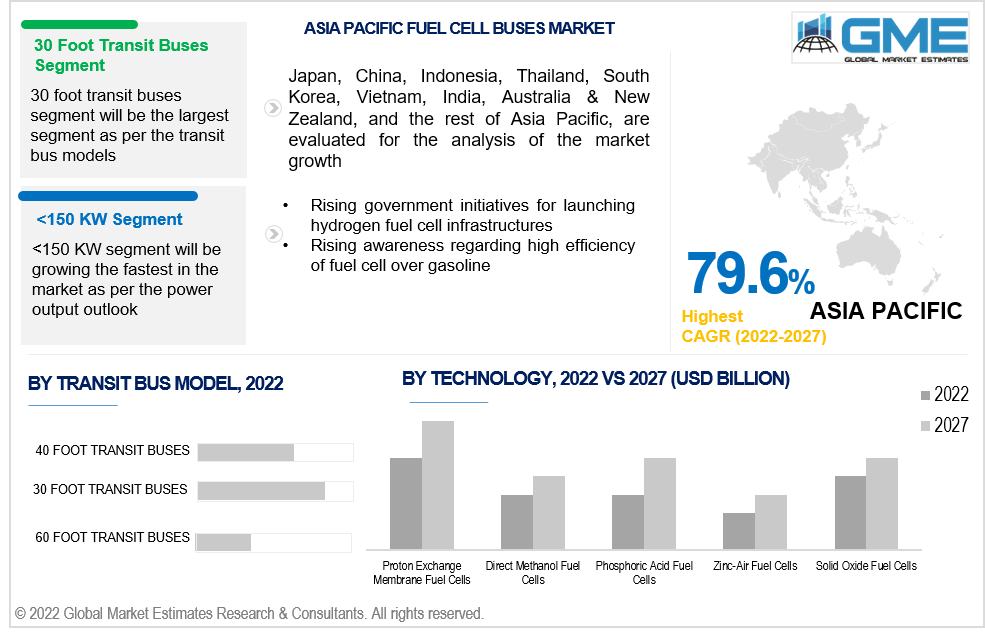
Based on the technology, the fuel cell buses market is divided into proton exchange membrane fuel cells, direct methanol fuel cells, phosphoric acid fuel cells, zinc-air fuel cells, and solid oxide fuel cells. The proton exchange membrane fuel cells segment is expected to grow the fastest in the forecast period of 2022-2027. This technology helps in transforming the chemical energy liberated during the electrochemical reaction of hydrogen and oxygen into electrical energy. Proton exchange membrane fuel cell works the best for the fuel cell buses vehicles and is one of the most highly demanded technology in the EV industry.
Based on the power output, the fuel cell buses market is divided into <150 KW, 150–250 KW, >250 KW. The <150 KW segment is expected to grow the fastest in the forecast period of 2022-2027. Fuel cells with less than 150 kW power output are used in passenger vehicles, buses and industrial cars. The sales rate of less than 150 kW fuel cells is higher and hence dominates the market globally.
Based on the transit bus models, the fuel cell buses market is divided into 30 foot transit buses, 40 foot transit buses, and 60 foot transit buses. The 30 foot transit buses segment is expected to grow the fastest in the forecast period of 2022-2027. The fuel cell stack power of fuel cell buses ranges from 20 kW to 200 kW for 30 to 40-foot transit buses. This type of transit models is the most adopted in the automotive industry, due to the efficient passenger capacity, and pocket friendly cost/rates in the market.
As per the geographical analysis, the fuel cell buses market can be classified into North America (the United States, Canada, and Mexico), Asia Pacific (India, China, Japan, Malaysia, Singapore, and the Rest of Asia Pacific), Europe (Germany, United Kingdom, Italy, France, Spain, Netherlands, and Rest of Europe), Middle East & Africa (Saudi Arabia, United Arab Emirates, and Rest of the Middle East & Africa) and Central & South America (Brazil, Argentina, and Rest of Central and South America).
Europe (Germany, United Kingdom, Italy, France, Spain, Netherlands, and Rest of Europe) will have a dominant share in the fuel cell buses market from 2022 to 2027. The major factor driving the growth of the market is mainly due to the presence of the top fuel cell buses manufacturers, awareness of latest EV technologies, and high adoption of passenger electric vehicles in the region.
Moreover, the Asia Pacific (India, China, Japan, Malaysia, Singapore, and the Rest of Asia Pacific) region is expected to be the fastest-growing segment in the fuel cell buses market during the forecast period. Rapidly rising population, increasing demand for passenger buses, and rapidly grow production scale of fuel buses will support the growth of the market.
Tata Motors Limited, Thor Industries, Irisbus, Cummins Inc., Ballard Power Systems, NovaBus Corporation, New Flyer Industries Ltd, EvoBus, MAN, Van Hool, Hino Motors Ltd., and SunLine Transit Agency are the key players in the fuel cell buses market.
Fuji Electric, Ballard Power Systems, UTC, Hydrogenics, Nuvera, and Proton Motor Fuel Cell GmbH are the key players in the fuel cell manufacturers market.
Please note: This is not an exhaustive list of companies profiled in the report.
Chapter 1 Methodology
1.1 Market Scope & Definitions
1.2 Estimates & Forecast Calculation
1.3 Historical Data Overview and Validation
1.4 Data Sources
1.4.1 Secondary
1.4.2 Primary
Chapter 2 Report Outlook
2.1 Fuel Cell Buses Industry Overview, 2022-2027
2.1.1 Industry Overview
2.1.2 Power Output Overview
2.1.3 Technology Overview
2.1.4 Transit Bus Model Overview
2.1.6 Regional Overview
Chapter 3 Fuel Cell Buses Market Trends
3.1 Market Segmentation
3.2 Industry Background, 2022-2027
3.3 Market Key Trends
3.3.1 Positive Trends
3.3.1.1 Rising demand for zero emission electric buses
3.3.2 Industry Challenges
3.3.2.1 Lack of adequate infrastructure and automated systems in developing nations
3.4 Prospective Growth Scenario
3.4.1 Power Output Growth Scenario
3.4.2 Technology Growth Scenario
3.4.3 Transit Bus Model Growth Scenario
3.5 COVID-19 Influence over Industry Growth
3.6 Porter’s Analysis
3.7 PESTEL Analysis
3.8 Value Chain & Supply Chain Analysis
3.9 Regulatory Framework
3.9.1 North America
3.9.2 Europe
3.9.3 APAC
3.9.4 LATAM
3.9.5 MEA
3.10 Transit Bus Model Overview
3.11 Market Share Analysis, 2020
3.11.1 Company Positioning Overview, 2020
Chapter 4 Fuel Cell Buses Market, By Power Output
4.1 Power Output Outlook
4.2 <150 KW
4.2.1 Market Size, By Region, 2022-2027 (USD Billion)
4.3 150–250 KW
4.3.1 Market Size, By Region, 2022-2027 (USD Billion)
4.4 >250 KW
4.4.1 Market Size, By Region, 2022-2027 (USD Billion)
Chapter 5 Fuel Cell Buses Market, By Technology
5.1 Technology Outlook
5.2 Proton Exchange Membrane Fuel Cells
5.2.1 Market Size, By Region, 2022-2027 (USD Billion)
5.3 Direct Methanol Fuel Cells
5.3.1 Market Size, By Region, 2022-2027 (USD Billion)
5.4 Phosphoric Acid Fuel Cells
5.4.1 Market Size, By Region, 2022-2027 (USD Billion)
5.5 Zinc-Air Fuel Cells
5.5.1 Market Size, By Region, 2022-2027 (USD Billion)
5.6 Solid Oxide Fuel Cells
5.6.1 Market Size, By Region, 2022-2027 (USD Billion)
Chapter 6 Fuel Cell Buses Market, By Transit Bus Model
6.1 30 Foot Transit Buses
6.1.1 Market Size, By Region, 2022-2027 (USD Billion)
6.2 40 Foot Transit Buses
6.2.1 Market Size, By Region, 2022-2027 (USD Billion)
6.3 60 Foot Transit Buses
6.3.1 Market Size, By Region, 2022-2027 (USD Billion)
Chapter 7 Fuel Cell Buses Market, By Region
7.1 Regional outlook
7.2 North America
7.2.1 Market Size, By Country 2022-2027 (USD Billion)
7.2.2 Market Size, By Power Output, 2022-2027 (USD Billion)
7.2.3 Market Size, By Technology, 2022-2027 (USD Billion)
7.2.4 Market Size, By Transit Bus Model, 2022-2027 (USD Billion)
7.2.6 U.S.
7.2.6.1 Market Size, By Power Output, 2022-2027 (USD Billion)
7.2.4.2 Market Size, By Technology, 2022-2027 (USD Billion)
7.2.4.3 Market Size, By Transit Bus Model, 2022-2027 (USD Billion)
7.2.7 Canada
7.2.7.1 Market Size, By Power Output, 2022-2027 (USD Billion)
7.2.7.2 Market Size, By Technology, 2022-2027 (USD Billion)
7.2.7.3 Market Size, By Transit Bus Model, 2022-2027 (USD Billion)
7.3 Europe
7.3.1 Market Size, By Country 2022-2027 (USD Billion)
7.3.2 Market Size, By Power Output, 2022-2027 (USD Billion)
7.3.3 Market Size, By Technology, 2022-2027 (USD Billion)
7.3.4 Market Size, By Transit Bus Model, 2022-2027 (USD Billion)
7.3.6 Germany
7.3.6.1 Market Size, By Power Output, 2022-2027 (USD Billion)
7.3.6.2 Market Size, By Technology, 2022-2027 (USD Billion)
7.3.6.3 Market Size, By Transit Bus Model, 2022-2027 (USD Billion)
7.3.7 UK
7.3.7.1 Market Size, By Power Output, 2022-2027 (USD Billion)
7.3.7.2 Market Size, By Technology, 2022-2027 (USD Billion)
7.3.7.3 Market Size, By Transit Bus Model, 2022-2027 (USD Billion)
7.3.8 France
7.3.7.1 Market Size, By Power Output, 2022-2027 (USD Billion)
7.3.7.2 Market Size, By Technology, 2022-2027 (USD Billion)
7.3.7.3 Market Size, By Transit Bus Model, 2022-2027 (USD Billion)
7.3.9 Italy
7.3.9.1 Market Size, By Power Output, 2022-2027 (USD Billion)
7.3.9.2 Market Size, By Technology, 2022-2027 (USD Billion)
7.3.9.3 Market Size, By Transit Bus Model, 2022-2027 (USD Billion)
7.3.10 Spain
7.3.10.1 Market Size, By Power Output, 2022-2027 (USD Billion)
7.3.10.2 Market Size, By Technology, 2022-2027 (USD Billion)
7.3.10.3 Market Size, By Transit Bus Model, 2022-2027 (USD Billion)
7.3.11 Russia
7.3.11.1 Market Size, By Power Output, 2022-2027 (USD Billion)
7.3.11.2 Market Size, By Technology, 2022-2027 (USD Billion)
7.3.11.3 Market Size, By Transit Bus Model, 2022-2027 (USD Billion)
7.4 Asia Pacific
7.4.1 Market Size, By Country 2022-2027 (USD Billion)
7.4.2 Market Size, By Power Output, 2022-2027 (USD Billion)
7.4.3 Market Size, By Technology, 2022-2027 (USD Billion)
7.4.4 Market Size, By Transit Bus Model, 2022-2027 (USD Billion)
7.4.6 China
7.4.6.1 Market Size, By Power Output, 2022-2027 (USD Billion)
7.4.6.2 Market Size, By Technology, 2022-2027 (USD Billion)
7.4.6.3 Market Size, By Transit Bus Model, 2022-2027 (USD Billion)
7.4.7 India
7.4.7.1 Market Size, By Power Output, 2022-2027 (USD Billion)
7.4.7.2 Market Size, By Technology, 2022-2027 (USD Billion)
7.4.7.3 Market Size, By Transit Bus Model, 2022-2027 (USD Billion)
7.4.8 Japan
7.4.7.1 Market Size, By Power Output, 2022-2027 (USD Billion)
7.4.7.2 Market Size, By Technology, 2022-2027 (USD Billion)
7.4.7.3 Market Size, By Transit Bus Model, 2022-2027 (USD Billion)
7.4.9 Australia
7.4.9.1 Market Size, By Power Output, 2022-2027 (USD Billion)
7.4.9.2 Market size, By Technology, 2022-2027 (USD Billion)
7.4.9.3 Market Size, By Transit Bus Model, 2022-2027 (USD Billion)
7.4.10 South Korea
7.4.10.1 Market Size, By Power Output, 2022-2027 (USD Billion)
7.4.10.2 Market Size, By Technology, 2022-2027 (USD Billion)
7.4.10.3 Market Size, By Transit Bus Model, 2022-2027 (USD Billion)
7.5 Latin America
7.5.1 Market Size, By Country 2022-2027 (USD Billion)
7.5.2 Market Size, By Power Output, 2022-2027 (USD Billion)
7.5.3 Market Size, By Technology, 2022-2027 (USD Billion)
7.5.4 Market Size, By Transit Bus Model, 2022-2027 (USD Billion)
7.5.6 Brazil
7.5.6.1 Market Size, By Power Output, 2022-2027 (USD Billion)
7.5.6.2 Market Size, By Technology, 2022-2027 (USD Billion)
7.5.6.3 Market Size, By Transit Bus Model, 2022-2027 (USD Billion)
7.5.7 Mexico
7.5.7.1 Market Size, By Power Output, 2022-2027 (USD Billion)
7.5.7.2 Market Size, By Technology, 2022-2027 (USD Billion)
7.5.7.3 Market Size, By Transit Bus Model, 2022-2027 (USD Billion)
7.5.8 Argentina
7.5.7.1 Market Size, By Power Output, 2022-2027 (USD Billion)
7.5.7.2 Market Size, By Technology, 2022-2027 (USD Billion)
7.5.7.3 Market Size, By Transit Bus Model, 2022-2027 (USD Billion)
7.6 MEA
7.6.1 Market Size, By Country 2022-2027 (USD Billion)
7.6.2 Market Size, By Power Output, 2022-2027 (USD Billion)
7.6.3 Market Size, By Technology, 2022-2027 (USD Billion)
7.6.4 Market Size, By Transit Bus Model, 2022-2027 (USD Billion)
7.6.6 Saudi Arabia
7.6.6.1 Market Size, By Power Output, 2022-2027 (USD Billion)
7.6.6.2 Market Size, By Technology, 2022-2027 (USD Billion)
7.6.6.3 Market Size, By Transit Bus Model, 2022-2027 (USD Billion)
7.6.7 UAE
7.6.7.1 Market Size, By Power Output, 2022-2027 (USD Billion)
7.6.7.2 Market Size, By Technology, 2022-2027 (USD Billion)
7.6.7.3 Market Size, By Transit Bus Model, 2022-2027 (USD Billion)
7.6.8 South Africa
7.6.7.1 Market Size, By Power Output, 2022-2027 (USD Billion)
7.6.7.2 Market Size, By Technology, 2022-2027 (USD Billion)
7.6.7.3 Market Size, By Transit Bus Model, 2022-2027 (USD Billion)
Chapter 8 Company Landscape
8.1 Competitive Analysis, 2020
8.2 Tata Motors Limited
8.2.1 Company Overview
8.2.2 Financial Analysis
8.2.3 Strategic Positioning
8.2.4 Info Graphic Analysis
8.3 Thor Industries
8.3.1 Company Overview
8.3.2 Financial Analysis
8.3.3 Strategic Positioning
8.3.4 Info Graphic Analysis
8.4 Irisbus
8.4.1 Company Overview
8.4.2 Financial Analysis
8.4.3 Strategic Positioning
8.4.4 Info Graphic Analysis
8.5 Cummins Inc.
8.5.1 Company Overview
8.5.2 Financial Analysis
8.5.3 Strategic Positioning
8.5.4 Info Graphic Analysis
8.6 Ballard Power Systems
8.6.1 Company Overview
8.6.2 Financial Analysis
8.6.3 Strategic Positioning
8.6.4 Info Graphic Analysis
8.7 NovaBus Corporation
8.7.1 Company Overview
8.7.2 Financial Analysis
8.7.3 Strategic Positioning
8.7.4 Info Graphic Analysis
8.8 New Flyer Industries Ltd
8.8.1 Company Overview
8.8.2 Financial Analysis
8.8.3 Strategic Positioning
8.8.4 Info Graphic Analysis
8.9 EvoBus
8.8.1 Company Overview
8.8.2 Financial Analysis
8.8.3 Strategic Positioning
8.8.4 Info Graphic Analysis
8.10 MAN
8.10.1 Company Overview
8.10.2 Financial Analysis
8.10.3 Strategic Positioning
8.10.4 Info Graphic Analysis
8.11 Van Hool
8.11.1 Company Overview
8.11.2 Financial Analysis
8.11.3 Strategic Positioning
8.11.4 Info Graphic Analysis
8.12 Hino Motors Ltd.
8.12.1 Company Overview
8.12.2 Financial Analysis
8.12.3 Strategic Positioning
8.12.4 Info Graphic Analysis
8.13 SunLine Transit Agency
8.13.1 Company Overview
8.13.2 Financial Analysis
8.13.3 Strategic Positioning
8.13.4 Info Graphic Analysis
The Global Fuel Cell Buses Market has been studied from the year 2019 till 2027. However, the CAGR provided in the report is from the year 2022 to 2027. The research methodology involved three stages: Desk research, Primary research, and Analysis & Output from the entire research process.

The desk research involved a robust background study which meant referring to paid and unpaid databases to understand the market dynamics; mapping contracts from press releases; identifying the key players in the market, studying their product portfolio, competition level, annual reports/SEC filings & investor presentations; and learning the demand and supply-side analysis for the Fuel Cell Buses Market.

The primary research activity included telephonic conversations with more than 50 tier 1 industry consultants, distributors, and end-use product manufacturers.

Finally, based on the above thorough research process, an in-depth analysis was carried out considering the following aspects: market attractiveness, current & future market trends, market share analysis, SWOT analysis of the company and customer analytics.

Frequently Asked Questions

This FREE sample includes market data points, ranging from trend analyses to market estimates & forecasts. See for yourself.
Or view our licence options:
Tailor made solutions just for you
80% of our clients seek made-to-order reports. How do you want us to tailor yours?
OUR CLIENTS


