This report was recently updated on August 13 2025 with the latest and most recent
market numbers
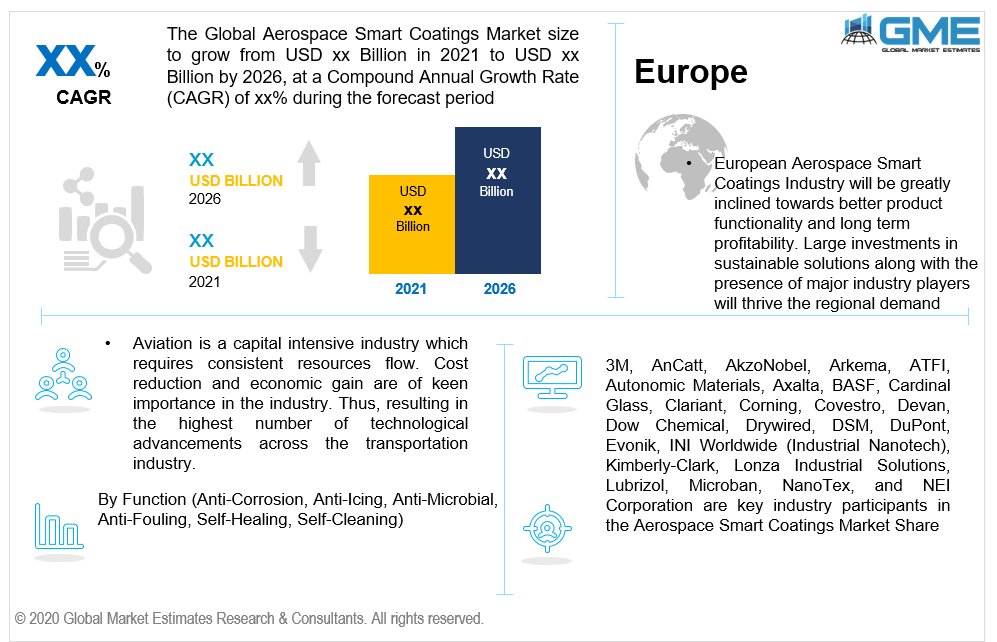
Global Aerospace Smart Coatings Market Size, Trends & Analysis - Forecasts to 2026 By Function (Anti-Corrosion, Anti-Icing, Anti-Microbial, Anti-Fouling, Self-Healing, Self-Cleaning), By Layer (Single, Multi), By Region (North America, Asia Pacific, Europe, Latin America, Middle East & Africa); End-User Landscape, Company Market Share Analysis, and Competitor Analysis
Increasing aircraft functionality and improving the aesthetic appearance are major factors driving Aerospace Smart Coatings demand. Enhancing paint life, surface protection, and increasing surface proficiency have influenced aircraft manufacturers to shift from conventional undercoats. Advancement in the development of multi-functional & smart coatings such as self-healing coats, nano-coatings, and interior functionality enhancement will open new avenues in the industry.
Rising demand for efficient and lighter-weight aircraft along with the preference for durable composites will drive the demand for Smart Coatings in the Aerospace industry. Associated advantages with these materials include but are not limited to tensile strength, anti-corrosion, and lesser fuel consumption which makes the product highly beneficial for the capital-intensive industry.
Aviation is a capital-intensive industry that requires consistent resource flow. Cost reduction and economic gain are of keen importance in the industry. Thus, resulting in the highest number of technological advancements across the transportation industry. Number of patents with respect to technological advancement is highest in the aviation industry Annually, more than 9% of patent activity increases, with nearly 40% patents were filed in China followed by the U.S., and Japan. Majorly the patents are filed by the research institutes and universities. China also has the highest grant rate as compared to the other nations.
The overall patenting activity depicts the major focus on parts and components of the aircraft such as structural body parts, compressor or turbine blades, airfoils, heat exchanges, and valves. The other patents emphasize on parts and components which are prone to exposure in harsh environments factors such as high temperatures and pressures which may result in corrosion and surface damage.
Technological advancements along with the expansion in the aviation industry will propel the Aerospace Smart Coatings adoption. Requirements to meet such energy efficiency, light weightiness, sturdiness, superior performance, and improved appearance will drive industrial growth. Comparatively lesser cost along with the reduction in operational cost due to effective protective layers will induce the product demand. In addition, increasing aircraft lifespan by providing anti-corrosive and self-healing undercoats will impact the overall industrial growth.
Anti-corrosion, anti-icing, anti-microbial, anti-fouling, self-healing, and self-cleaning are major functions involved in the aerospace smart coatings market. Corrosion resistance is among the major concern in the aviation industry. Each year engineers spend a huge amount of money to maintain the aircraft and prevent it from corrosion. Thus, the introduction of anti-corrosive materials has gained huge adoption in the aviation industry. The other major functionality is the protection from microbes. The aircraft are prone to get affected by microbes due to the diversified climatic conditions which in turn impact the lifespan of the components. It is recommended to adopt the anti-microbial layer on the interior and exterior structure to increase the component life cycle.
Self-healing functionality is expected to witness high growth due to its novel features and capabilities. It is capital intensive to repair the damaged aircraft components and also requires high technicality to renovate the components. Thus, the introduction of self-healing materials will ease the restoration process and reduce the overall cost.
Single and multi layer are two aerospace smart coatings available in the industry. The usage is highly dependent on the component nature and purpose. The components which are prone to exposure in high temperature and harsh environments require multiple layers. Whereas the lesser complex parts which are for decorative purposesare not prone to tough surroundings may require only a single layer. The multiple layer is projected to witness the highest gains due to the increased requirement from larger heavy-duty parts and components.
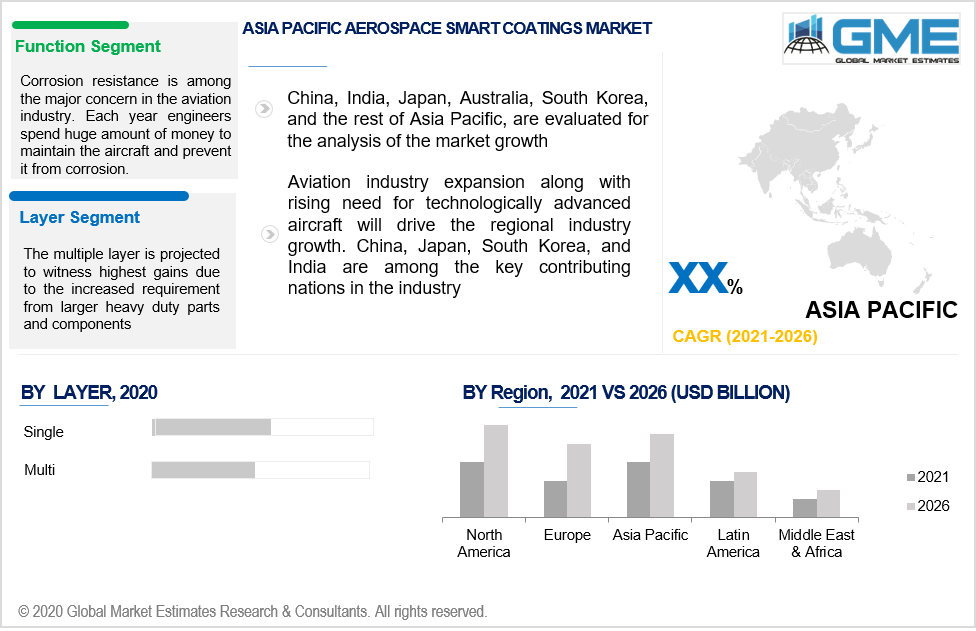
Asia Pacific Aerospace Smart Coatings Market is projected to attain a maximum share in the coming years. Aviation industry expansion along with the rising need for technologically advanced aircraft will drive the regional industry growth. China, Japan, South Korea, and India are among the key contributing nations in the industry. The presence of major institutes in China and Japan to work on patented technology related to aircraft material performance will influence the demand.
North America is expected to foresee significant gains during the forecast period. Heavy investment in smart materials to gain better functionality will stimulate growth in the region. European Aerospace Smart Coatings Industry will be greatly inclined towards better product functionality and long-term profitability. Large investments in sustainable solutions along with the presence of major industry players will thrive the regional demand.
3M, AnCatt, AkzoNobel, Arkema, ATFI, Autonomic Materials, Axalta, BASF, Cardinal Glass, Clariant, Corning, Covestro, Devan, Dow Chemical, Drywired, DSM, DuPont, Evonik, INI Worldwide (Industrial Nanotech), Kimberly-Clark, Lonza Industrial Solutions, Lubrizol, Microban, NanoTex, and NEI Corporation are key industry participants in the Aerospace Smart Coatings Market Share.
Please note: This is not an exhaustive list of companies profiled in the report.
Other major players include but are not limited to PPG, nGimat, Reactive Surfaces, Saint-Gobain, Huntsman Corporation, Sensor Coatings Systems, Sherwin-Williams, SLIPS Technologies, Specialty Coating Systems, and Tesla Nanocoatings.
The market is excessively competitive due to the presence of a large number of industry players. Product development and technological advancement are key strategies witnessed in the industry.
Chapter 1 Methodology
1.1 Market scope & definitions
1.2 Estimates & forecast calculation
1.3 Historical data overview and validation
1.4 Data sources
1.4.1 Secondary
1.4.2 Primary
Chapter 2 Report Outlook
2.1 Aerospace Carbon Nanotube Market industry overview, 2016-2026
2.1.1 Industry overview
2.1.2 Type overview
2.1.3 Application overview
2.1.4 Regional overview
Chapter 3 Aerospace Carbon Nanotube Market Trends
3.1 Market segmentation
3.2 Industry background, 2016-2026
3.3 Market key trends
3.3.1 Positive trends
3.3.2 Industry challenges
3.4 Prospective growth scenario
3.4.1 Type growth scenario
3.4.2 Application growth scenario
3.5 COVID-19 influence over industry growth
3.6 Porter’s analysis
3.7 PESTEL analysis
3.8 Value chain & supply chain analysis
3.9 Regulatory framework
3.9.1 North America
3.9.2 Europe
3.9.3 APAC
3.9.4 LATAM
3.9.5 MEA
3.10 Product innovation
3.11 Market share analysis, 2020
3.11.1 Company positioning overview, 2020
Chapter 4 Aerospace Carbon Nanotube Market, By Type
4.1 Type Outlook
4.2 Single Walled
4.2.1 Market size, by region, 2016-2026 (USD Million)
4.3 Multi-Walled
4.3.1 Market size, by region, 2016-2026 (USD Million)
Chapter 5 Aerospace Carbon Nanotube Market, By Application
5.1 Application Outlook
5.2 Light Weight Structural Components
5.2.1 Market size, by region, 2016-2026 (USD Million)
5.3 Aircraft Braking Systems
5.3.1 Market size, by region, 2016-2026 (USD Million)
5.4 Electromagnetic Interference
5.4.1 Market size, by region, 2016-2026 (USD Million)
5.5 Radio Frequency Interference
5.5.1 Market size, by region, 2016-2026 (USD Million)
5.6 Electrostatic Discharge
5.6.1 Market size, by region, 2016-2026 (USD Million)
5.7 De-Icing
5.7.1 Market size, by region, 2016-2026 (USD Million)
5.7 Others
5.7.1 Market size, by region, 2016-2026 (USD Million)
Chapter 6 Aerospace Carbon Nanotube Market, By Region
6.1 Regional outlook
6.2 North America
6.2.1 Market size, by country 2016-2026 (USD Million)
6.2.2 Market size, by Type, 2016-2026 (USD Million)
6.2.3 Market size, by Application, 2016-2026 (USD Million)
6.2.4 U.S.
6.2.4.1 Market size, by Type, 2016-2026 (USD Million)
6.2.4.2 Market size, by Application, 2016-2026 (USD Million)
6.2.5 Canada
6.2.5.1 Market size, by Type, 2016-2026 (USD Million)
6.2.5.2 Market size, by Application, 2016-2026 (USD Million)
6.3 Europe
6.3.1 Market size, by country 2016-2026 (USD Million)
6.3.2 Market size, by Type, 2016-2026 (USD Million)
6.3.3 Market size, by Application, 2016-2026 (USD Million)
6.3.4 Germany
6.2.4.1 Market size, by Type, 2016-2026 (USD Million)
6.2.4.2 Market size, by Application, 2016-2026 (USD Million)
6.3.5 UK
6.3.5.1 Market size, by Type, 2016-2026 (USD Million)
6.3.5.2 Market size, by Application, 2016-2026 (USD Million)
6.3.6 France
6.3.6.1 Market size, by Type, 2016-2026 (USD Million)
6.3.6.2 Market size, by Application, 2016-2026 (USD Million)
6.3.7 Italy
6.3.7.1 Market size, by Type, 2016-2026 (USD Million)
6.3.7.2 Market size, by Application, 2016-2026 (USD Million)
6.3.8 Spain
6.3.8.1 Market size, by Type, 2016-2026 (USD Million)
6.3.8.2 Market size, by Application, 2016-2026 (USD Million)
6.3.9 Russia
6.3.9.1 Market size, by Type, 2016-2026 (USD Million)
6.3.9.2 Market size, by Application, 2016-2026 (USD Million)
6.4 Asia Pacific
6.4.1 Market size, by country 2016-2026 (USD Million)
6.4.2 Market size, by Type, 2016-2026 (USD Million)
6.4.3 Market size, by Application, 2016-2026 (USD Million)
6.4.4 China
6.4.4.1 Market size, by Type, 2016-2026 (USD Million)
6.4.4.2 Market size, by Application, 2016-2026 (USD Million)
6.4.5 India
6.4.5.1 Market size, by Type, 2016-2026 (USD Million)
6.4.5.2 Market size, by Application, 2016-2026 (USD Million)
6.4.6 Japan
6.4.6.1 Market size, by Type, 2016-2026 (USD Million)
6.4.6.2 Market size, by Application, 2016-2026 (USD Million)
6.4.7 Australia
6.4.7.1 Market size, by Type, 2016-2026 (USD Million)
6.4.7.2 Market size, by Application, 2016-2026 (USD Million)
6.4.8 South Korea
6.4.8.1 Market size, by Type, 2016-2026 (USD Million)
6.4.8.2 Market size, by Application, 2016-2026 (USD Million)
6.5 Latin America
6.5.1 Market size, by country 2016-2026 (USD Million)
6.5.2 Market size, by Type, 2016-2026 (USD Million)
6.5.3 Market size, by Application, 2016-2026 (USD Million)
6.5.4 Brazil
6.5.4.1 Market size, by Type, 2016-2026 (USD Million)
6.5.4.2 Market size, by Application, 2016-2026 (USD Million)
6.5.5 Mexico
6.5.5.1 Market size, by Type, 2016-2026 (USD Million)
6.5.5.2 Market size, by Application, 2016-2026 (USD Million)
6.5.6 Argentina
6.5.6.1 Market size, by Type, 2016-2026 (USD Million)
6.5.6.2 Market size, by Application, 2016-2026 (USD Million)
6.6 MEA
6.6.1 Market size, by country 2016-2026 (USD Million)
6.6.2 Market size, by Type, 2016-2026 (USD Million)
6.6.3 Market size, by Application, 2016-2026 (USD Million)
6.6.4 Saudi Arabia
6.6.4.1 Market size, by Type, 2016-2026 (USD Million)
6.6.4.2 Market size, by Application, 2016-2026 (USD Million)
6.6.5 UAE
6.6.5.1 Market size, by Type, 2016-2026 (USD Million)
6.6.5.2 Market size, by Application, 2016-2026 (USD Million)
6.6.6 South Africa
6.6.6.1 Market size, by Type, 2016-2026 (USD Million)
6.6.6.2 Market size, by Application, 2016-2026 (USD Million)
Chapter 7 Company Landscape
7.1 Competitive analysis, 2020
7.2 Nanocyl SA
7.2.1 Company overview
7.2.2 Financial analysis
7.2.3 Strategic positioning
7.2.4 Info graphic analysis
7.3 Arkema SA
7.3.1 Company overview
7.3.2 Financial analysis
7.3.3 Strategic positioning
7.3.4 Info graphic analysis
7.4 Cheap Tubes, Inc.
7.4.1 Company overview
7.4.2 Financial analysis
7.4.3 Strategic positioning
7.4.4 Info graphic analysis
7.5 Showa Denko K.K.
7.5.1 Company overview
7.5.2 Financial analysis
7.5.3 Strategic positioning
7.5.4 Info graphic analysis
7.6 Toray International Group Limited
7.6.1 Company overview
7.6.2 Financial analysis
7.6.3 Strategic positioning
7.6.4 Info graphic analysis
7.7 Arry International Group Limited
7.7.1 Company overview
7.7.2 Financial analysis
7.7.3 Strategic positioning
7.7.4 Info graphic analysis
7.8 Hanwha Corporation
7.8.1 Company overview
7.8.2 Financial analysis
7.8.3 Strategic positioning
7.8.4 Info graphic analysis
7.9 Cnt Co., Ltd.
7.9.1 Company overview
7.9.2 Financial analysis
7.9.3 Strategic positioning
7.9.4 Info graphic analysis
7.10 Carbon Solutions, Inc.
7.10.1 Company overview
7.10.2 Financial analysis
7.10.3 Strategic positioning
7.10.4 Info graphic analysis
7.11 Cnano Technology Ltd.
7.11.1 Company overview
7.11.2 Financial analysis
7.11.3 Strategic positioning
7.11.4 Info graphic analysis
7.12 Ocsial
7.12.1 Company overview
7.12.2 Financial analysis
7.12.3 Strategic positioning
7.12.4 Info graphic analysis
7.13 Kumho Petrochemical Co., Ltd.
7.13.1 Company overview
7.13.2 Financial analysis
7.13.3 Strategic positioning
7.13.4 Info graphic analysis
7.14 Grafen Chemical Industries (Grafen Co.)
7.14.1 Company overview
7.14.2 Financial analysis
7.14.3 Strategic positioning
7.14.4 Info graphic analysis
7.15 Chengdu Organic Chemicals Co. Ltd.
7.15.1 Company overview
7.15.2 Financial analysis
7.15.3 Strategic positioning
7.15.4 Info graphic analysis
7.16 Klean Commodities
7.16.1 Company overview
7.16.2 Financial analysis
7.16.3 Strategic positioning
7.16.4 Info graphic analysis
7.17 Thomas Swan & Co. Limited
7.17.1 Company overview
7.17.2 Financial analysis
7.17.3 Strategic positioning
7.17.4 Info graphic analysis
7.18 Raymor
7.18.1 Company overview
7.18.2 Financial analysis
7.18.3 Strategic positioning
7.18.4 Info graphic analysis
7.19 Nanolab Inc.
7.19.1 Company overview
7.19.2 Financial analysis
7.19.3 Strategic positioning
7.19.4 Info graphic analysis
7.20 Nanoshel LLC
7.20.1 Company overview
7.20.2 Financial analysis
7.20.3 Strategic positioning
7.20.4 Info graphic analysis
7.21 Advanced Nanopower Inc.
7.21.1 Company overview
7.21.2 Financial analysis
7.21.3 Strategic positioning
7.21.4 Info graphic analysis
7.22 Chasm Advanced Materials, Inc.
7.22.1 Company overview
7.22.2 Financial analysis
7.22.3 Strategic positioning
7.22.4 Info graphic analysis
7.23 Nanothinx S.A.
7.23.1 Company overview
7.23.2 Financial analysis
7.23.3 Strategic positioning
7.23.4 Info graphic analysis
7.24 Nano-C Inc.
7.24.1 Company overview
7.24.2 Financial analysis
7.24.3 Strategic positioning
7.24.4 Info graphic analysis
7.25 Xinnano Materials, Inc.
7.25.1 Company overview
7.25.2 Financial analysis
7.25.3 Strategic positioning
7.25.4 Info graphic analysis
7.26 Reinste Nano Ventures
7.26.1 Company overview
7.26.2 Financial analysis
7.26.3 Strategic positioning
7.26.4 Info graphic analysis
7.27 Continental Carbon Nanotechnologies
7.27.1 Company overview
7.27.2 Financial analysis
7.27.3 Strategic positioning
7.27.4 Info graphic analysis
7.28 Hyperion Catalysis International Inc.
7.28.1 Company overview
7.28.2 Financial analysis
7.28.3 Strategic positioning
7.28.4 Info graphic analysis
7.29 Future Carbon GmbH
7.29.1 Company overview
7.29.2 Financial analysis
7.29.3 Strategic positioning
7.29.4 Info graphic analysis
The Global Aerospace Smart Coatings Market has been studied from the year 2019 till 2026. However, the CAGR provided in the report is from the year 2021 to 2026. The research methodology involved three stages: Desk research, Primary research, and Analysis & Output from the entire research process.

The desk research involved a robust background study which meant referring to paid and unpaid databases to understand the market dynamics; mapping contracts from press releases; identifying the key players in the market, studying their product portfolio, competition level, annual reports/SEC filings & investor presentations; and learning the demand and supply-side analysis for the Aerospace Smart Coatings Market.

The primary research activity included telephonic conversations with more than 50 tier 1 industry consultants, distributors, and end-use product manufacturers.

Finally, based on the above thorough research process, an in-depth analysis was carried out considering the following aspects: market attractiveness, current & future market trends, market share analysis, SWOT analysis of the company and customer analytics.


This FREE sample includes market data points, ranging from trend analyses to market estimates & forecasts. See for yourself.
Or view our licence options:
Tailor made solutions just for you
80% of our clients seek made-to-order reports. How do you want us to tailor yours?
OUR CLIENTS


