This report was recently updated on July 9 2025 with the latest and most recent
market numbers
Global Augmented Reality In Construction Market Size, Trends & Analysis - Forecasts to 2026 By Offering (Hardware & Equipment, Software & Applications), By Application (Project Planning, 3D Mapping, Automated Measures, Project Modification, On-Site Information, Team Collaboration, Training), By Stage (Pre-Construction, On-Going Construction, Post Construction), By Deployment (Cloud, IOT, Others), By Region (North America, Asia Pacific, Europe, Latin America, Middle East & Africa); End-User Landscape, Company Market Share Analysis, and Competitor Analysis
Increasing artificial intelligence inclusion in various industries has also inspired infrastructure building solution companies to adopt this technology. Better results with improved project planning, automated measurements, 3D mapping, project modification, site information, and team collaboration are major aspects to drive demand for Augmented Reality In Construction industry. Increasing investments by the structure building companies to capitalize on technology-oriented products for improved outcomes will stimulate the industry's growth. However, the lack of skilled labors and their compatibility with the new technologies may pose a hindrance in the short run.
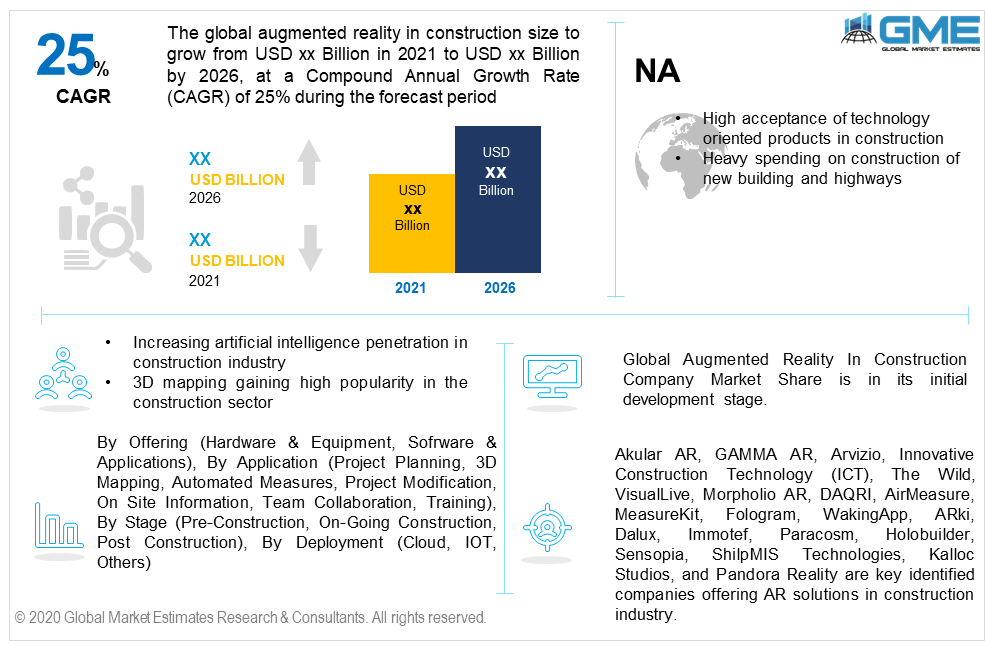
The Augmented Reality In Construction Market by offering is divided into hardware & equipment and software & applications. Software & applications dominated the offering segment and held for the maximum revenue share in 2019. Multiple solution offerings with the latest inputs and technology are the key contributing factors to proliferate the demand in this segment. The hardware & equipment segment is likely to grow at the highest rate owing to the commercialization of various gadgets and wearable devices such as helmets and goggles specifically designed for construction applications.
Project planning, 3D mapping, automated measurements, project modification, on site information, training, and team collaborations are the major applications involved in the Augmented Reality In Construction Market. Each application holds a different purpose exclusively dependent on the infrastructure requirement. Project planning deals with the preparation and development of the itinerary required during structure creation. Through AR, it becomes easier for engineers to plan and execute the overall process. 3D mapping is gaining high popularity in the past few years among the architectures which will enhance the market development.
Automated measurements will witness significant growth owing to their high efficiency in measuring the site area and making the right decision. AR helps in various other applications such as on-site information which is among the major components during the structure creation.
The stage segment is categorized into pre-construction, on-going construction, and post construction. On-going construction is witnessing high growth owing to the high requirement of modifications, on-site information, and team collaboration. The segment faced significant demand in recent years.
Pre-construction stage usually involves project planning, 3D mapping, measurements, and training applications. The segment is gaining high attention recently owing to the availability of multiple tools which makes the overall structure creation experience easier, smoother, and faster for the architects and engineers. Post-construction mainly deals with the inspection and improvement to rectify the errors.
Cloud and IOT are the major deployment types available in the Augmented Reality In Construction Market. IOT dominated the deployment segment and accounted for the maximum share in 2019. Higher compatibility and suitability with the applications and gadgets along with better connections with other devices are major factors to drive demand in this segment.
Cloud computing will witness the fastest and highest growth up to 2026. Changing technology orientation and platform towards advancements & upgradation are major reasons to drive penetration in this segment.
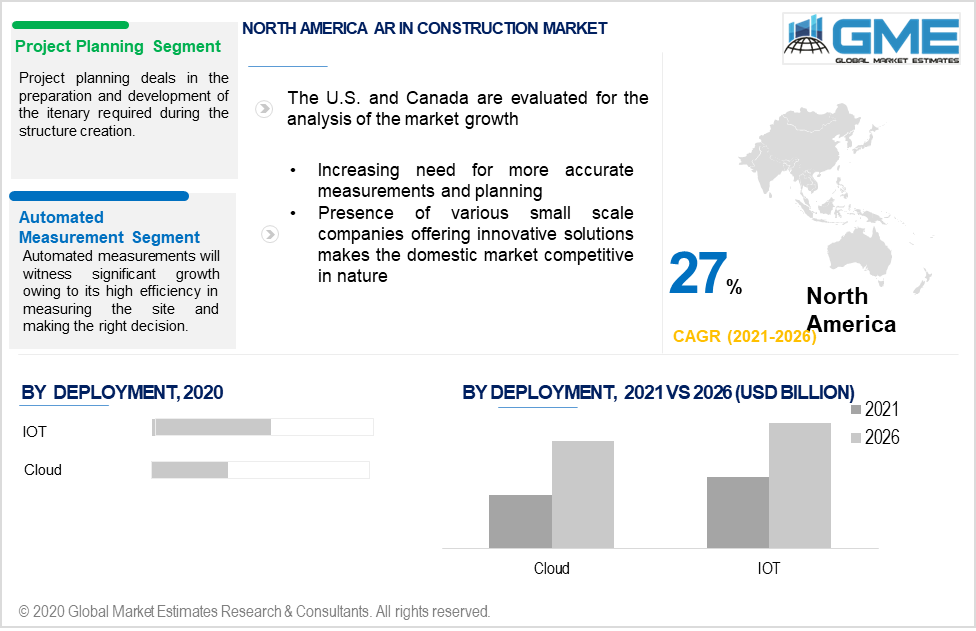
North America Augmented Reality in Construction Market will dominate the regional revenue in 2019. High acceptance and knowledge regarding the product and application usage along with the increasing need for more accurate measurements and planning will induce regional market growth. The presence of various small scale companies offering innovative solutions makes the domestic market competitive in nature.
Asia Pacific Augmented Reality In Construction Market will foresee significant growth in the coming years. China, South Korea, Japan, Singapore, and Australia are among the major countries to adopt and invest in AR-based architectural solutions. The region is highly technology oriented when it comes to artificial intelligence and other IT solutions. Presence of various domestic products in China and South Korea makes the region highly concentrated in nature.
European AR solutions in the architectural segment are largely inclined towards the safety norms and conditions while inspecting the location and site. On site inspection, measurement, and safety are among the major concerns in this region. The UK, Germany, France, and Italy will be the key adopting countries in this region.
Global Augmented Reality In Construction Company Market Share is in its initial development stage. The presence of very few technology oriented companies offering the latest architectural solutions made the market successful in recent years. However, the wide acceptance of these methods along with high investment from other companies to enter the market makes the industry more dynamic and competitive in nature. Applications development and new product development regarding the gadgets are prime approaches witnessed in the market.
Akular AR, GAMMA AR, Arvizio, Innovative Construction Technology (ICT), The Wild, VisualLive, Morpholio AR, DAQRI, AirMeasure, MeasureKit, Fologram, WakingApp, ARki, Dalux, Immotef, Paracosm, Holobuilder, Sensopia, ShilpMIS Technologies, Kalloc Studios, and Pandora Reality are key identified companies offering AR solutions in construction industry.
Please note: This is not an exhaustive list of companies profiled in the report.
The industry holds a huge potential for new market entrants owing to the diversified solution requirement in architecture along with the ability to focus on other innovative product offerings.
Chapter 1 Methodology
1.1 Market scope & definitions
1.2 Estimates & forecast calculation
1.3 Historical data overview and validation
1.4 Data sources
1.4.1 Secondary
1.4.2 Primary
Chapter 2 Report Outlook
2.1 AR in Construction industry overview, 2019-2026
2.1.1 Industry overview
2.1.2 Offering overview
2.1.3 Application overview
2.1.4 Stage overview
2.1.5 Deployment overview
2.1.6 Regional overview
Chapter 3 AR in Construction Market Trends
3.1 Market segmentation
3.2 Industry background, 2019-2026
3.3 Market key trends
3.3.1 Positive trends
3.3.2 Industry challenges
3.4 Prospective growth scenario
3.5 COVID-19 influence over industry growth
3.6 Porter’s analysis
3.7 PESTEL analysis
3.8 Value chain & supply chain analysis
3.9 Regulatory framework
3.9.1 North America
3.9.2 Europe
3.9.3 APAC
3.9.4 LATAM
3.9.5 MEA
3.10 Production overview
3.10.1 Formulation
3.10.2 End-Use
3.11 Market share analysis, 2020
3.11.1 Company positioning overview, 2020
Chapter 4 AR in Construction Market, By Offering
4.1 Offering Outlook
4.2 Hardware and equipment
4.2.1 Market size, by region, 2019-2026 (USD Million)
4.3 Applications & software
4.3.1 Market size, by region, 2019-2026 (USD Million)
4.4 Others
4.4.1 Market size, by region, 2019-2026 (USD Million)
Chapter 5 AR in Construction Market, By Applications
5.1 Applications Outlook
5.2 Project planning
5.2.1 Market size, by region, 2019-2026 (USD Million)
5.3 3D mapping
5.3.1 Market size, by region, 2019-2026 (USD Million)
5.4 Automated Measurements
5.4.1 Market size, by region, 2019-2026 (USD Million)
5.5 Project Modification
5.5.1 Market size, by region, 2019-2026 (USD Million)
5.6 On site information
5.6.1 Market size, by region, 2019-2026 (USD Million)
5.7 Team collaboration
5.7.1 Market size, by region, 2019-2026 (USD Million)
Chapter 6 AR in Construction Market, By Stage
6.1 Stage Outlook
6.2 Pre-construction
6.2.1 Market size, by region, 2019-2026 (USD Million)
6.3 On-going construction
6.3.1 Market size, by region, 2019-2026 (USD Million)
6.4 Post construction
6.4.1 Market size, by region, 2019-2026 (USD Million)
Chapter 7 AR in Construction Market, By Deployment
7.1 Deployment Outlook
7.2 Cloud
7.2.1 Market size, by region, 2019-2026 (USD Million)
7.3 IOT
7.3.1 Market size, by region, 2019-2026 (USD Million)
7.4 Others
7.4.1 Market size, by region, 2019-2026 (USD Million)
Chapter 8 AR in Construction Market, By Region
8.1 Regional outlook
8.2 North America
8.2.1 Market size, by country 2019-2026 (USD Million)
8.2.2 Market size, by offering, 2019-2026 (USD Million)
8.2.3 Market size, by application, 2019-2026 (USD Million)
8.2.4 Market size, by stage, 2019-2026 (USD Million)
8.2.5 Market size, by deployment, 2019-2026 (USD Million)
8.2.6 U.S.
8.2.6.1 Market size, by offering, 2019-2026 (USD Million)
8.2.6.2 Market size, by application, 2019-2026 (USD Million)
8.2.6.3 Market size, by stage, 2019-2026 (USD Million)
8.2.6.4 Market size, by deployment, 2019-2026 (USD Million)
8.2.7 Canada
8.2.7.1 Market size, by offering, 2019-2026 (USD Million)
8.2.7.2 Market size, by application, 2019-2026 (USD Million)
8.2.7.3 Market size, by stage, 2019-2026 (USD Million)
8.2.7.4 Market size, by deployment, 2019-2026 (USD Million)
8.3 Europe
8.3.1 Market size, by country 2019-2026 (USD Million)
8.3.2 Market size, by offering, 2019-2026 (USD Million)
8.3.3 Market size, by application, 2019-2026 (USD Million)
8.3.4 Market size, by stage, 2019-2026 (USD Million)
8.3.5 Market size, by deployment, 2019-2026 (USD Million)
8.3.6 Germany
8.2.6.1 Market size, by offering, 2019-2026 (USD Million)
8.2.6.2 Market size, by application, 2019-2026 (USD Million)
8.2.6.3 Market size, by stage, 2019-2026 (USD Million)
8.2.6.4 Market size, by deployment, 2019-2026 (USD Million)
8.3.7 UK
8.3.7.1 Market size, by offering, 2019-2026 (USD Million)
8.3.7.2 Market size, by application, 2019-2026 (USD Million)
8.3.7.3 Market size, by stage, 2019-2026 (USD Million)
8.3.7.4 Market size, by deployment, 2019-2026 (USD Million)
8.3.8 France
8.3.8.1 Market size, by offering, 2019-2026 (USD Million)
8.3.8.2 Market size, by application, 2019-2026 (USD Million)
8.3.8.3 Market size, by stage, 2019-2026 (USD Million)
8.3.8.4 Market size, by deployment, 2019-2026 (USD Million)
8.3.9 Italy
8.3.9.1 Market size, by offering, 2019-2026 (USD Million)
8.3.9.2 Market size, by application, 2019-2026 (USD Million)
8.3.9.3 Market size, by stage, 2019-2026 (USD Million)
8.3.9.4 Market size, by deployment, 2019-2026 (USD Million)
8.3.10 Spain
8.3.10.1 Market size, by offering, 2019-2026 (USD Million)
8.3.10.2 Market size, by application, 2019-2026 (USD Million)
8.3.10.3 Market size, by stage, 2019-2026 (USD Million)
8.3.10.4 Market size, by deployment, 2019-2026 (USD Million)
8.4 Asia Pacific
8.4.1 Market size, by country 2019-2026 (USD Million)
8.4.2 Market size, by offering, 2019-2026 (USD Million)
8.4.3 Market size, by application, 2019-2026 (USD Million)
8.4.4 Market size, by stage, 2019-2026 (USD Million)
8.4.5 Market size, by deployment, 2019-2026 (USD Million)
8.4.6 China
8.4.6.1 Market size, by offering, 2019-2026 (USD Million)
8.4.6.2 Market size, by application, 2019-2026 (USD Million)
8.4.6.3 Market size, by stage, 2019-2026 (USD Million)
8.4.6.4 Market size, by deployment, 2019-2026 (USD Million)
8.4.7 India
8.4.7.1 Market size, by offering, 2019-2026 (USD Million)
8.4.7.2 Market size, by application, 2019-2026 (USD Million)
8.4.7.3 Market size, by stage, 2019-2026 (USD Million)
8.4.7.4 Market size, by deployment, 2019-2026 (USD Million)
8.4.8 Japan
8.4.8.1 Market size, by offering, 2019-2026 (USD Million)
8.4.8.2 Market size, by application, 2019-2026 (USD Million)
8.4.8.3 Market size, by stage, 2019-2026 (USD Million)
8.4.8.4 Market size, by deployment, 2019-2026 (USD Million)
8.4.9 Australia
8.4.9.1 Market size, by offering, 2019-2026 (USD Million)
8.4.9.2 Market size, by application, 2019-2026 (USD Million)
8.4.9.3 Market size, by stage, 2019-2026 (USD Million)
8.4.9.4 Market size, by deployment, 2019-2026 (USD Million)
8.4.10 South Korea
8.4.10.1 Market size, by offering, 2019-2026 (USD Million)
8.4.10.2 Market size, by application, 2019-2026 (USD Million)
8.4.10.3 Market size, by stage, 2019-2026 (USD Million)
8.4.10.4 Market size, by deployment, 2019-2026 (USD Million)
8.5 Latin America
8.5.1 Market size, by country 2019-2026 (USD Million)
8.5.2 Market size, by offering, 2019-2026 (USD Million)
8.5.3 Market size, by application, 2019-2026 (USD Million)
8.5.4 Market size, by stage, 2019-2026 (USD Million)
8.5.5 Market size, by deployment, 2019-2026 (USD Million)
8.5.6 Brazil
8.5.6.1 Market size, by offering, 2019-2026 (USD Million)
8.5.6.2 Market size, by application, 2019-2026 (USD Million)
8.5.6.3 Market size, by stage, 2019-2026 (USD Million)
8.5.6.4 Market size, by deployment, 2019-2026 (USD Million)
8.5.7 Mexico
8.5.7.1 Market size, by offering, 2019-2026 (USD Million)
8.5.7.2 Market size, by application, 2019-2026 (USD Million)
8.5.7.3 Market size, by stage, 2019-2026 (USD Million)
8.5.7.4 Market size, by deployment, 2019-2026 (USD Million)
8.6 MEA
8.6.1 Market size, by country 2019-2026 (USD Million)
8.6.2 Market size, by offering, 2019-2026 (USD Million)
8.6.3 Market size, by application, 2019-2026 (USD Million)
8.6.4 Market size, by stage, 2019-2026 (USD Million)
8.6.5 Market size, by deployment, 2019-2026 (USD Million)
8.6.6 Saudi Arabia
8.6.6.1 Market size, by offering, 2019-2026 (USD Million)
8.6.6.2 Market size, by application, 2019-2026 (USD Million)
8.6.6.3 Market size, by stage, 2019-2026 (USD Million)
8.6.6.4 Market size, by deployment, 2019-2026 (USD Million)
8.6.7 UAE
8.6.7.1 Market size, by offering, 2019-2026 (USD Million)
8.6.7.2 Market size, by application, 2019-2026 (USD Million)
8.6.7.3 Market size, by stage, 2019-2026 (USD Million)
8.6.7.4 Market size, by deployment, 2019-2026 (USD Million)
Chapter 9 Company Landscape
9.1 Competitive analysis, 2020
9.2 Akular AR
9.2.1 Company overview
9.2.2 Financial analysis
9.2.3 Strategic positioning
9.2.4 Info graphic analysis
9.3 GAMMA AR
9.3.1 Company overview
9.3.2 Financial analysis
9.3.3 Strategic positioning
9.3.4 Info graphic analysis
9.4 Arvizio
9.4.1 Company overview
9.4.2 Financial analysis
9.4.3 Strategic positioning
9.4.4 Info graphic analysis
9.5 Innovative Construction Technology (ICT)
9.5.1 Company overview
9.5.2 Financial analysis
9.5.3 Strategic positioning
9.5.4 Info graphic analysis
9.6 The Wild
9.6.1 Company overview
9.6.2 Financial analysis
9.6.3 Strategic positioning
9.6.4 Info graphic analysis
9.7 VisualLive
9.7.1 Company overview
9.7.2 Financial analysis
9.7.3 Strategic positioning
9.7.4 Info graphic analysis
9.8 Morpholio AR
9.8.1 Company overview
9.8.2 Financial analysis
9.8.3 Strategic positioning
9.8.4 Info graphic analysis
9.9 DAQRI
9.9.1 Company overview
9.9.2 Financial analysis
9.9.3 Strategic positioning
9.9.4 Info graphic analysis
9.10 AirMeasure
9.10.1 Company overview
9.10.2 Financial analysis
9.10.3 Strategic positioning
9.10.4 Info graphic analysis
9.11 MeasureKit
9.11.1 Company overview
9.11.2 Financial analysis
9.11.3 Strategic positioning
9.11.4 Info graphic analysis
9.12 Fologram
9.12.1 Company overview
9.12.2 Financial analysis
9.12.3 Strategic positioning
9.12.4 Info graphic analysis
9.13 WakingApp
9.13.1 Company overview
9.13.2 Financial analysis
9.13.3 Strategic positioning
9.13.4 Info graphic analysis
9.14 ARki
9.14.1 Company overview
9.14.2 Financial analysis
9.14.3 Strategic positioning
9.14.4 Info graphic analysis
9.15 Dalux
9.15.1 Company overview
9.15.2 Financial analysis
9.15.3 Strategic positioning
9.15.4 Info graphic analysis
9.16 Immotef
9.16.1 Company overview
9.16.2 Financial analysis
9.16.3 Strategic positioning
9.16.4 Info graphic analysis
9.17 Paracosm
9.17.1 Company overview
9.17.2 Financial analysis
9.17.3 Strategic positioning
9.17.4 Info graphic analysis
9.18 Holobuilder
9.18.1 Company overview
9.18.2 Financial analysis
9.18.3 Strategic positioning
9.18.4 Info graphic analysis
9.19 Sensopia
9.19.1 Company overview
9.19.2 Financial analysis
9.19.3 Strategic positioning
9.19.4 Info graphic analysis
9.20 ShilpMIS Technologies
9.20.1 Company overview
9.20.2 Financial analysis
9.20.3 Strategic positioning
9.20.4 Info graphic analysis
9.21 Kalloc Studios
9.21.1 Company overview
9.21.2 Financial analysis
9.21.3 Strategic positioning
9.21.4 Info graphic analysis
9.22 Pandora Reality
9.22.1 Company overview
9.22.2 Financial analysis
9.22.3 Strategic positioning
9.22.4 Info graphic analysis
The Global Augmented Reality In Construction Market has been studied from the year 2019 till 2026. However, the CAGR provided in the report is from the year 2021 to 2026. The research methodology involved three stages: Desk research, Primary research, and Analysis & Output from the entire research process.

The desk research involved a robust background study which meant referring to paid and unpaid databases to understand the market dynamics; mapping contracts from press releases; identifying the key players in the market, studying their product portfolio, competition level, annual reports/SEC filings & investor presentations; and learning the demand and supply-side analysis for the Augmented Reality In Construction Market.

The primary research activity included telephonic conversations with more than 50 tier 1 industry consultants, distributors, and end-use product manufacturers.

Finally, based on the above thorough research process, an in-depth analysis was carried out considering the following aspects: market attractiveness, current & future market trends, market share analysis, SWOT analysis of the company and customer analytics.

Frequently Asked Questions

This FREE sample includes market data points, ranging from trend analyses to market estimates & forecasts. See for yourself.
Or view our licence options:
Tailor made solutions just for you
80% of our clients seek made-to-order reports. How do you want us to tailor yours?
OUR CLIENTS


