This report was recently updated on August 24 2025 with the latest and most recent
market numbers
Global Automatic Identification and Data Capture Market Size, Trends & Analysis - Forecasts to 2026 By Product (Barcoding Solutions, Smart Cards, Optical Character Recognition (OCR) Systems, RFID Systems, Magnetic Stripe Cards, Voice-Directed WMS, Heads-up Displays, VR Solutions, Wearables, Google Glass and Biometric Systems), By Offering (Hardware, Software, and Services), By Vertical (Manufacturing, Retail, Transportation & Logistics, Hospitality, Banking & Finance, Healthcare, Government, Commercial and Energy & Power), By Region (North America, Europe, Asia Pacific, MEA, and CSA), End-User Landscape, Company Market Share Analysis, and Competitor Analysis
Automatic identification and data capture (AIDC) is a technological system that is used to automatically detect the object, capture the necessary data about the object and automatically feed the data to the computer system without any human intervention. The external data is captured through image sensing, capturing sound or video and a transducer is used to convert the data format from image or sound to digital file and is stored in the database where it can be used for further analysis. Due to the presence of an automated process, the data is captured at a faster rate and also accurately. The AIDC method is largely employed in warehouses, inventory management, tracking, order shipment, volume, and weight determination and is used across various industry verticals. Therefore, with increasing object movement activities and the benefits of faster and accurate data capturing, the demand for automatic identification and data capturing is high across the globe.
The different types of AIDC systems used are barcode solutions, smart cards, optical character recognition (OCR) systems, RFID products, magnetic stripe cards, voice-directed WMS, heads-up displays, VR solutions, wearables, google glass, and biometric systems. Barcode readers are widely used in retail, healthcare, manufacturing, warehousing, education, banking, among others, and provide a faster throughput rate and reduce human error. The AIDC systems are widely used in retail stores and supermarkets for faster serving time and help to reduce the queue length. This helps to provide better customer satisfaction at the point of sale and also reduces the cost of service. For instance, radio frequency identification (RFID) products are used for product tracking, electronic toll collection process, and product shipments. The Government of India has made mandatory implementation of RFID technology-based AIDC product now FASTag from January 2021 for all the four-wheeler motor vehicles. This RIFD based FASTag is used to automatically collect the toll at the toll booth from all the four-wheelers. Therefore, there is rising demand for the AIDC system across the globe.
The E-commerce sector is booming across the world. The AIDC system is employed in the e-commerce segment as it is used in warehousing, inventory management, order shipment and it helps to connect the whole process by storing the data at a centralized database. The barcode readers and RIFD systems used in e-commerce system helps to reduce the processing time and faster shipment of the order items and helps to reduce the cost by saving the processing time and automating the process of data capturing. As per the United Nations Conference on Trade and Development (UNCTAD), the global e-commerce revenue stands at $ 25.6 billion worldwide in the year 2018 and it is estimated that more than 1.4 billion population across the globe uses e-commerce websites for shopping. Therefore, with the booming e-commerce sector, the demand for the AIDC system will be increasing.
The major market drivers for automatic identification and data capture (AIDC) system are growing adoption of faster, accurate, and automated data identification and capturing system, growing usage in retail stores at point of sales to reduce service time, increasing demand for AIDC in electronic toll collection, booming e-commerce sector, growing focus on AIDC system in banking and finance to reduce transaction time, growing demand across different industry verticals and rising demand for QR codes scanning from smartphone for different applications. These aforementioned points will support AIDC market growth during the tenure from 2021 to 2026. The AIDC market growth will be hindered due to the higher initial cost of AIDC systems.
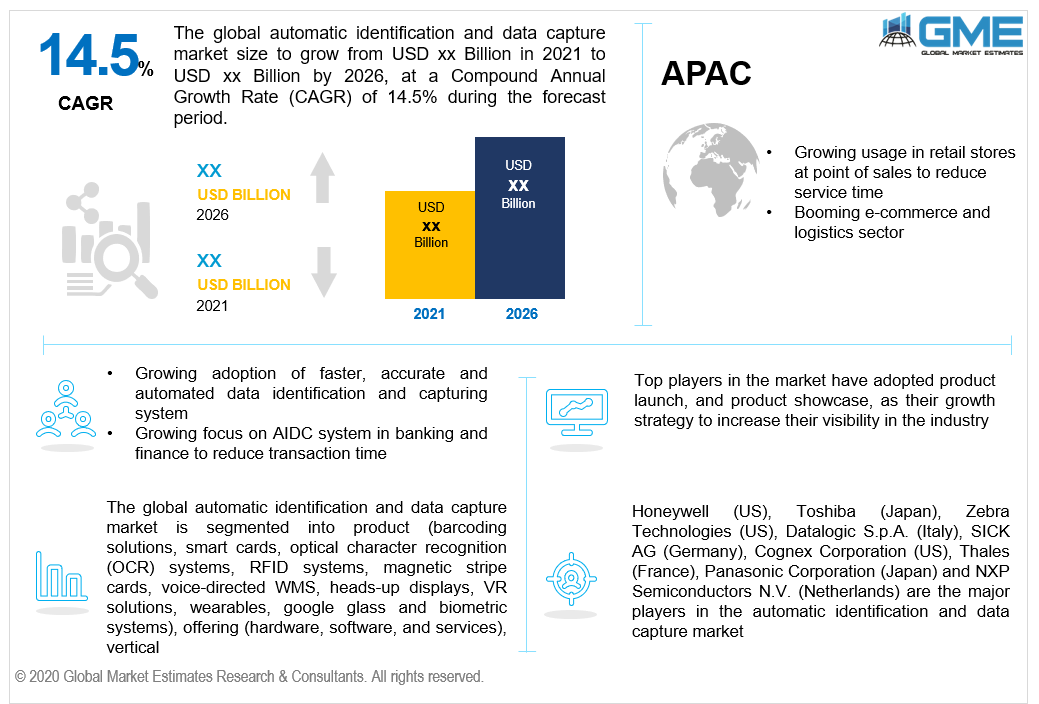
Based on the product, the market is categorized into barcoding solutions, smart cards, optical character recognition (OCR) systems, RFID systems, magnetic stripe cards, voice-directed wms, heads-up displays, VR solutions, wearables, google glass, and biometric systems. The barcoding solutions segment will be dominating the market during the forecast period. This is due to the increasing usage of barcodes and QR codes in retail, manufacturing, and warehouse for product identification and inventory management and the growing use of QR codes for monetary transactions. The barcode solutions are also widely used in the E-commerce segment.
Based on the offering, the market is segmented into hardware, software, and services. The hardware segment is expected to hold the largest share in the market owing to the increasing requirement of barcode scanning machines, RFID Tag readers, OCR systems, tablets, smart cards, and magnetic stripe card readers, among others.
Based on the vertical, the market is segmented into manufacturing, retail, transportation & logistics, hospitality, banking & finance, healthcare, government, commercial, and energy & power. The manufacturing segment will be accountable for the largest share in the market to the increasing usage of the AIDC system in supply chain and inventory management. AIDC system provides faster identification and reduces the cost and helps to manage a huge number of goods. With growing demand across the e-commerce and retail stores, the retail segment will witness faster growth as it provides a faster throughput rate and ease at the point of sale.
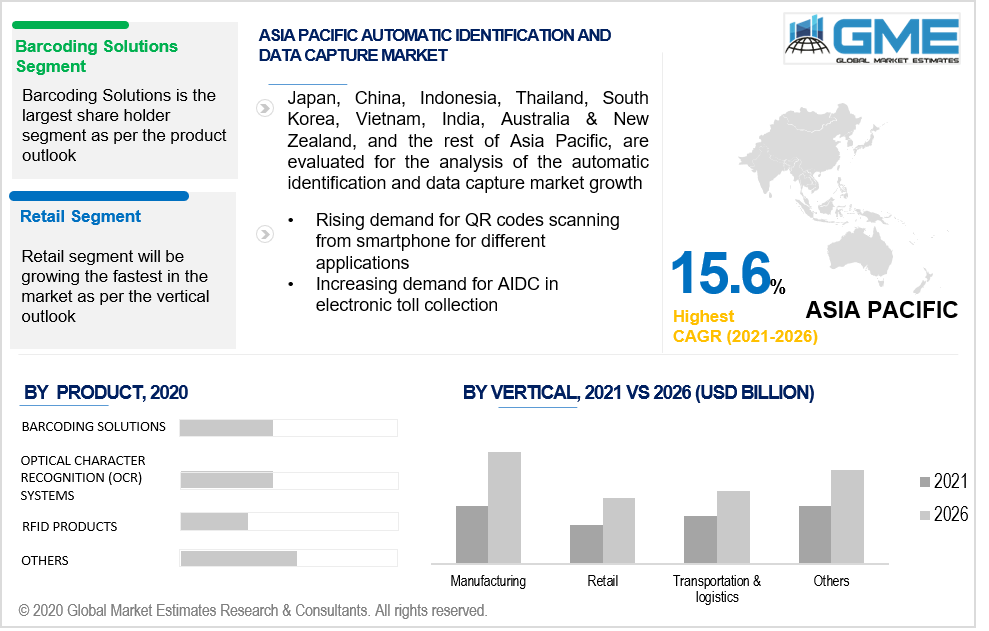
As per the geographical analysis, the market can be classified into North America (the US, Canada, and Mexico), Asia Pacific (India, China, Japan, Malaysia, Singapore, and Rest of Asia Pacific), Europe (Germany, United Kingdom, Italy, France, Spain, Netherlands, and Rest of Europe), Middle East & Africa (Saudi Arabia, United Arab Emirates, and Rest of the Middle East & Africa) and Central South America (Brazil, Argentina, and Rest of Central and South America). APAC is appraised to be the largest market for AIDC during the cited forecast tenure. There are large investments made in the retail and manufacturing industries and the increasing recognition and growing adoption of AIDC products, the government legislation on the use of AIDC technology, and a rising E-commerce industry are major factors driving the growth of this regional segment. The rising trend of digitizing and growing usage of smartphones for monetary transactions by using QR codes will help the APAC region grow the fastest.
Honeywell (US), Toshiba (Japan), Zebra Technologies (US), Datalogic S.p.A. (Italy), SICK AG (Germany), Cognex Corporation (US), Thales (France), Panasonic Corporation (Japan), and NXP Semiconductors N.V. (Netherlands) are the major players in the automatic identification and data capture market.
Please note: This is not an exhaustive list of companies profiled in the report.
In April 2021, Panasonic Corporation successfully acquired Blue Yonder company for its AI/ML-driven supply chain and IoT and edge devices. It helped Panasonic Corporation to broaden its product portfolio and expand its business proficiency.
Chapter 1 Methodology
1.1 Market Scope & Definitions
1.2 Estimates & Forecast Calculation
1.3 Historical Data Overview And Validation
1.4 Data Sources
1.4.1 Secondary
1.4.2 Primary
Chapter 2 Report Outlook
2.1 Automatic Identification and Data Capture Industry Overview, 2019-2026
2.1.1 Industry Overview
2.1.2 Product Overview
2.1.3 Offering Overview
2.1.4 Vertical Overview
2.1.5 Regional Overview
Chapter 3 Global Automatic Identification and Data Capture Market Trends
3.1 Market Segmentation
3.2 Industry Background, 2019-2026
3.3 Market Key Trends
3.3.1 Positive Trends
3.3.1.1 Growing adoption of faster, accurate and automated data identification and capturing system
3.3.1.2 Growing usage in retail stores at point of sales and booming e-commerce sector
3.3.1.3 Increasing demand for AIDC in electronic toll collection
3.3.2 Industry Challenges
3.3.2.1 Higher initial cost of AIDC systems
3.4 Prospective Growth Scenario
3.4.1 Product Growth Scenario
3.4.2 Offering Growth Scenario
3.4.3 Vertical Growth Scenario
3.5 COVID-19 Influence over Industry Growth
3.6 Porter’s Analysis
3.7 PESTEL Analysis
3.8 Value Chain & Supply Chain Analysis
3.9 Regulatory Framework
3.9.1 North America
3.9.2 Europe
3.9.3 APAC
3.9.4 LATAM
3.9.5 MEA
3.10 Technology Overview
3.11 Market Share Analysis, 2020
3.11.1 Company Positioning Overview, 2020
Chapter 4 Automatic Identification and Data Capture Market, By Product
4.1 Product Outlook
4.2 Barcoding Solutions
4.2.1 Market Size, By Region, 2019-2026 (USD Billion)
4.2.1.1 Barcode Scanners
4.2.1.2 Barcode Printers
4.2.1.3 Laser Scanners
4.2.1.4 Rugged Tablets
4.3 Smart Cards
4.3.1 Market Size, By Region, 2019-2026 (USD Billion)
4.3.1.1 Contact-Based Smart Cars
4.3.1.2 Contactless-Based Smart Cars
4.4 Optical Character Recognition (OCR) Systems
4.4.1 Market Size, By Region, 2019-2026 (USD Billion)
4.5 RFID Products
4.5.1 Market Size, By Region, 2019-2026 (USD Billion)
4.5.1.1 RFID Scanners
4.5.1.2 RFID Tags
4.6 Magnetic Stripe Cards
4.6.1 Market Size, By Region, 2019-2026 (USD Billion)
4.7 Voice-Directed WMS
4.7.1 Market Size, By Region, 2019-2026 (USD Billion)
4.8 Heads-up Displays
4.8.1 Market Size, By Region, 2019-2026 (USD Billion)
4.9 VR Solutions
4.9.1 Market Size, By Region, 2019-2026 (USD Billion)
4.10 Wearables
4.10.1 Market Size, By Region, 2019-2026 (USD Billion)
4.11 Google Glass
4.11.1 Market Size, By Region, 2019-2026 (USD Billion)
4.12 Biometric Systems
4.12.1 Market Size, By Region, 2019-2026 (USD Billion)
4.12.1 Face Recognition Systems
4.12.2 Iris Recognition Systems
4.12.3 Voice Recognition Systems
Chapter 5 Global Automatic Identification and Data Capture Market, By Offering
5.1 Offering Outlook
5.2 Hardware
5.2.1 Market Size, By Region, 2019-2026 (USD Billion)
5.3 Software
5.3.1 Market Size, By Region, 2019-2026 (USD Billion)
5.4 Services
5.4.1 Market Size, By Region, 2019-2026 (USD Billion)
Chapter 6 Global Automatic Identification and Data Capture Market, By Vertical
6.1 Vertical Outlook
6.2 Manufacturing
6.2.1 Market Size, By Region, 2019-2026 (USD Billion)
6.3 Retail
6.3.1 Market Size, By Region, 2019-2026 (USD Billion)
6.4 Transportation & Logistics
6.4.1 Market Size, By Region, 2019-2026 (USD Billion)
6.5 Hospitality
6.5.1 Market Size, By Region, 2019-2026 (USD Billion)
6.6 Banking & Finance
6.6.1 Market Size, By Region, 2019-2026 (USD Billion)
6.7 Healthcare
6.7.1 Market Size, By Region, 2019-2026 (USD Billion)
6.8 Government
6.8.1 Market Size, By Region, 2019-2026 (USD Billion)
6.9 Commercial
6.9.1 Market Size, By Region, 2019-2026 (USD Billion)
6.10 Energy & Power
6.10.1 Market Size, By Region, 2019-2026 (USD Billion)
Chapter 7 Global Automatic Identification and Data Capture Market, By Region
7.1 Regional outlook
7.2 North America
7.2.1 Market Size, By Country 2019-2026 (USD Billion)
7.2.2 Market Size, By Product, 2019-2026 (USD Billion)
7.2.3 Market Size, By Offering, 2019-2026 (USD Billion)
7.2.4 Market Size, By Vertical, 2019-2026 (USD Billion)
7.2.5 U.S.
7.2.5.1 Market Size, By Product, 2019-2026 (USD Billion)
7.2.5.2 Market Size, By Offering, 2019-2026 (USD Billion)
7.2.5.3 Market Size, By Vertical, 2019-2026 (USD Billion)
7.2.6 Canada
7.2.6.1 Market Size, By Product, 2019-2026 (USD Billion)
7.2.6.2 Market Size, By Offering, 2019-2026 (USD Billion)
7.2.6.3 Market Size, By Vertical, 2019-2026 (USD Billion)
7.3 Europe
7.3.1 Market Size, By Country 2019-2026 (USD Billion)
7.3.2 Market Size, By Product, 2019-2026 (USD Billion)
7.3.3 Market Size, By Offering, 2019-2026 (USD Billion)
7.3.4 Market Size, By Vertical, 2019-2026 (USD Billion)
7.3.5 Germany
7.3.5.1 Market Size, By Product, 2019-2026 (USD Billion)
7.3.5.2 Market Size, By Offering, 2019-2026 (USD Billion)
7.3.5.3 Market Size, By Vertical, 2019-2026 (USD Billion)
7.3.6 UK
7.3.6.1 Market Size, By Product, 2019-2026 (USD Billion)
7.3.6.2 Market Size, By Offering, 2019-2026 (USD Billion)
7.3.6.3 Market Size, By Vertical, 2019-2026 (USD Billion)
7.3.7 France
7.3.7.1 Market Size, By Product, 2019-2026 (USD Billion)
7.3.7.2 Market Size, By Offering, 2019-2026 (USD Billion)
7.3.7.3 Market Size, By Vertical, 2019-2026 (USD Billion)
7.3.8 Italy
7.3.8.1 Market Size, By Product, 2019-2026 (USD Billion)
7.3.8.2 Market Size, By Offering, 2019-2026 (USD Billion)
7.3.8.3 Market Size, By Vertical, 2019-2026 (USD Billion)
7.3.9 Spain
7.3.9.1 Market Size, By Product, 2019-2026 (USD Billion)
7.3.9.2 Market Size, By Offering, 2019-2026 (USD Billion)
7.2.9.3 Market Size, By Vertical, 2019-2026 (USD Billion)
7.3.10 Russia
7.3.10.1 Market Size, By Product, 2019-2026 (USD Billion)
7.3.10.2 Market Size, By Offering, 2019-2026 (USD Billion)
7.2.10.3 Market Size, By Vertical, 2019-2026 (USD Billion)
7.4 Asia Pacific
7.4.1 Market Size, By Country 2019-2026 (USD Billion)
7.4.2 Market Size, By Product, 2019-2026 (USD Billion)
7.4.3 Market Size, By Offering, 2019-2026 (USD Billion)
7.4.4 Market Size, By Vertical, 2019-2026 (USD Billion)
7.4.5 China
7.4.5.1 Market Size, By Product, 2019-2026 (USD Billion)
7.4.5.2 Market Size, By Offering, 2019-2026 (USD Billion)
7.4.5.3 Market Size, By Vertical, 2019-2026 (USD Billion)
7.4.6 India
7.4.6.1 Market Size, By Product, 2019-2026 (USD Billion)
7.4.6.2 Market Size, By Offering, 2019-2026 (USD Billion)
7.4.6.3 Market Size, By Vertical, 2019-2026 (USD Billion)
7.4.7 Japan
7.4.7.1 Market Size, By Product, 2019-2026 (USD Billion)
7.4.7.2 Market Size, By Offering, 2019-2026 (USD Billion)
7.4.7.3 Market Size, By Vertical, 2019-2026 (USD Billion)
7.4.8 Australia
7.4.8.1 Market Size, By Product, 2019-2026 (USD Billion)
7.4.8.2 Market size, By Offering, 2019-2026 (USD Billion)
7.4.8.3 Market Size, By Vertical, 2019-2026 (USD Billion)
7.4.9 South Korea
7.4.9.1 Market Size, By Product, 2019-2026 (USD Billion)
7.4.9.2 Market Size, By Offering, 2019-2026 (USD Billion)
7.4.9.3 Market Size, By Vertical, 2019-2026 (USD Billion)
7.5 Latin America
7.5.1 Market Size, By Country 2019-2026 (USD Billion)
7.5.2 Market Size, By Product, 2019-2026 (USD Billion)
7.5.3 Market Size, By Offering, 2019-2026 (USD Billion)
7.5.4 Market Size, By Vertical, 2019-2026 (USD Billion)
7.5.5 Brazil
7.5.5.1 Market Size, By Product, 2019-2026 (USD Billion)
7.5.5.2 Market Size, By Offering, 2019-2026 (USD Billion)
7.5.5.3 Market Size, By Vertical, 2019-2026 (USD Billion)
7.5.6 Mexico
7.5.6.1 Market Size, By Product, 2019-2026 (USD Billion)
7.5.6.2 Market Size, By Offering, 2019-2026 (USD Billion)
7.5.6.3 Market Size, By Vertical, 2019-2026 (USD Billion)
7.5.7 Argentina
7.5.7.1 Market Size, By Product, 2019-2026 (USD Billion)
7.5.7.2 Market Size, By Offering, 2019-2026 (USD Billion)
7.5.7.3 Market Size, By Vertical, 2019-2026 (USD Billion)
7.6 MEA
7.6.1 Market Size, By Country 2019-2026 (USD Billion)
7.6.2 Market Size, By Product, 2019-2026 (USD Billion)
7.6.3 Market Size, By Offering, 2019-2026 (USD Billion)
7.6.4 Market Size, By Vertical, 2019-2026 (USD Billion)
7.6.5 Saudi Arabia
7.6.5.1 Market Size, By Product, 2019-2026 (USD Billion)
7.6.5.2 Market Size, By Offering, 2019-2026 (USD Billion)
7.6.5.3 Market Size, By Vertical, 2019-2026 (USD Billion)
7.6.6 UAE
7.6.6.1 Market Size, By Product, 2019-2026 (USD Billion)
7.6.6.2 Market Size, By Offering, 2019-2026 (USD Billion)
7.6.6.3 Market Size, By Vertical, 2019-2026 (USD Billion)
7.6.7 South Africa
7.6.7.1 Market Size, By Product, 2019-2026 (USD Billion)
7.6.7.2 Market Size, By Offering, 2019-2026 (USD Billion)
7.6.7.3 Market Size, By Vertical, 2019-2026 (USD Billion)
Chapter 7 Company Landscape
7.1 Competitive Analysis, 2020
7.2 Honeywell
7.2.1 Company Overview
7.2.2 Financial Analysis
7.2.3 Strategic Positioning
7.2.4 Info Graphic Analysis
7.3 Toshiba
7.3.1 Company Overview
7.3.2 Financial Analysis
7.3.3 Strategic Positioning
7.3.4 Info Graphic Analysis
7.4 Zebra Technologies
7.4.1 Company Overview
7.4.2 Financial Analysis
7.4.3 Strategic Positioning
7.4.4 Info Graphic Analysis
7.5 Datalogic S.p.A.
7.5.1 Company Overview
7.5.2 Financial Analysis
7.5.3 Strategic Positioning
7.5.4 Info Graphic Analysis
7.6 SICK AG
7.6.1 Company Overview
7.6.2 Financial Analysis
7.6.3 Strategic Positioning
7.6.4 Info Graphic Analysis
7.7 Cognex Corporation
7.7.1 Company Overview
7.7.2 Financial Analysis
7.7.3 Strategic Positioning
7.7.4 Info Graphic Analysis
7.8 Thales
7.8.1 Company Overview
7.8.2 Financial Analysis
7.8.3 Strategic Positioning
7.8.4 Info Graphic Analysis
7.9 Panasonic Corporation
7.9.1 Company Overview
7.9.2 Financial Analysis
7.9.3 Strategic Positioning
7.9.4 Info Graphic Analysis
7.10 NXP Semiconductors N.V.
7.10.1 Company Overview
7.10.2 Financial Analysis
7.10.3 Strategic Positioning
7.10.4 Info Graphic Analysis
7.11 Other Companies
7.11.1 Company Overview
7.11.2 Financial Analysis
7.11.3 Strategic Positioning
7.11.4 Info Graphic Analysis
The Global Automatic Identification and Data Capture Market has been studied from the year 2019 till 2026. However, the CAGR provided in the report is from the year 2021 to 2026. The research methodology involved three stages: Desk research, Primary research, and Analysis & Output from the entire research process.

The desk research involved a robust background study which meant referring to paid and unpaid databases to understand the market dynamics; mapping contracts from press releases; identifying the key players in the market, studying their product portfolio, competition level, annual reports/SEC filings & investor presentations; and learning the demand and supply-side analysis for the Automatic Identification and Data Capture Market.

The primary research activity included telephonic conversations with more than 50 tier 1 industry consultants, distributors, and end-use product manufacturers.

Finally, based on the above thorough research process, an in-depth analysis was carried out considering the following aspects: market attractiveness, current & future market trends, market share analysis, SWOT analysis of the company and customer analytics.


This FREE sample includes market data points, ranging from trend analyses to market estimates & forecasts. See for yourself.
Or view our licence options:
Tailor made solutions just for you
80% of our clients seek made-to-order reports. How do you want us to tailor yours?
OUR CLIENTS


