This report was recently updated on August 18 2025 with the latest and most recent
market numbers
Global Clean Label Ingredients Market Size, Trends & Analysis - Forecasts to 2028 By Type (Flavors, Colorants, Additives, Emulsifier, Stabilizer and Thickeners (EST), Flours, and Others), By Form (Dry and Liquid), By Application (Dairy & Frozen Desserts, Beverages, Preservatives, Bakery & Confectionery, Meat Products, Sauce & Condiment, and Oils & Fats), and By Region (North America, Asia Pacific, Central and South America, Europe, and Middle East and Africa), Competitive Landscape, Company Market Share Analysis, and End User Analysis
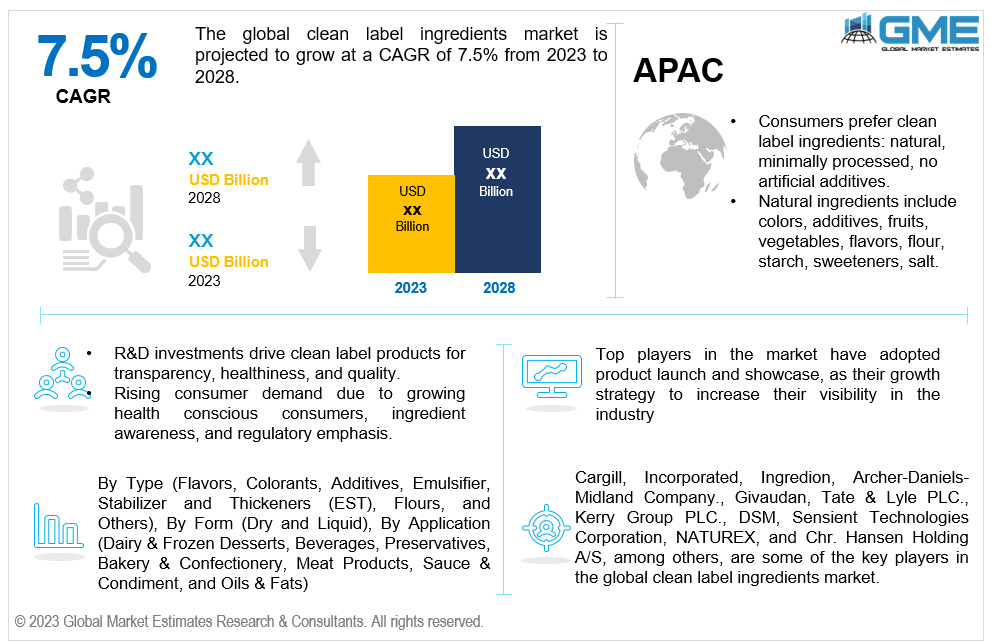
The global Clean Label Ingredients market is projected to grow at a CAGR of 7.5% from 2023 to 2028.
A clean label ingredient refers to a food ingredient that is perceived as natural, minimally processed, and free from artificial or synthetic additives. Clean label ingredients are often preferred by consumers who seek transparency and simplicity in their food choices. These ingredients are typically recognizable and familiar, with easy-to-understand names. They may include natural extracts, herbs, spices, fruit and vegetable concentrates, and other minimally processed substances. Clean label ingredients are sought after for their perceived healthiness, sustainability, and alignment with a more natural and wholesome approach to food.
Clean label ingredients, often referred to as natural ingredients, include colours, food additives, fruits, vegetables, flavours, flour, starch, sweeteners, salt, and more. Additionally, they may incorporate secondary factors such as organic, natural, and non-genetically modified organisms. The development of clean label products requires substantial investments in R&D as companies strive to meet consumer demands for transparency, healthiness, and quality. These efforts aim to capture a larger market share and stay ahead in the competitive clean label ingredients market.
Consumers are focusing on their health, the growth of urbanization, and the workforce has led to a rising demand for quality food and nutrition. This trend is reflected in the increasing popularity of ready-to-eat food, packaged food, frozen meals, instant noodles, and similar products in the clean label ingredients market. Additionally, factors such as increasing disposable income and age groups also significantly influence the clean label ingredients market, with millennials being a key driver of the industry's growth.
The growth of the clean label ingredients market is driven by various factors. Firstly, there is increasing consumer demand for healthier food choices and a growing awareness of the potential health risks associated with artificial ingredients. Additionally, regulatory bodies are placing greater emphasis on ingredient transparency, which is leading to the adoption of clean label ingredients. Moreover, industries are focusing more on innovation, and the influence of social media and digital platforms is also contributing to the market's growth.
Clean label ingredients often align with sustainability and environmental consciousness. Consumers are more inclined towards products that are produced using environmentally friendly practices, including the use of natural and sustainably sourced ingredients.
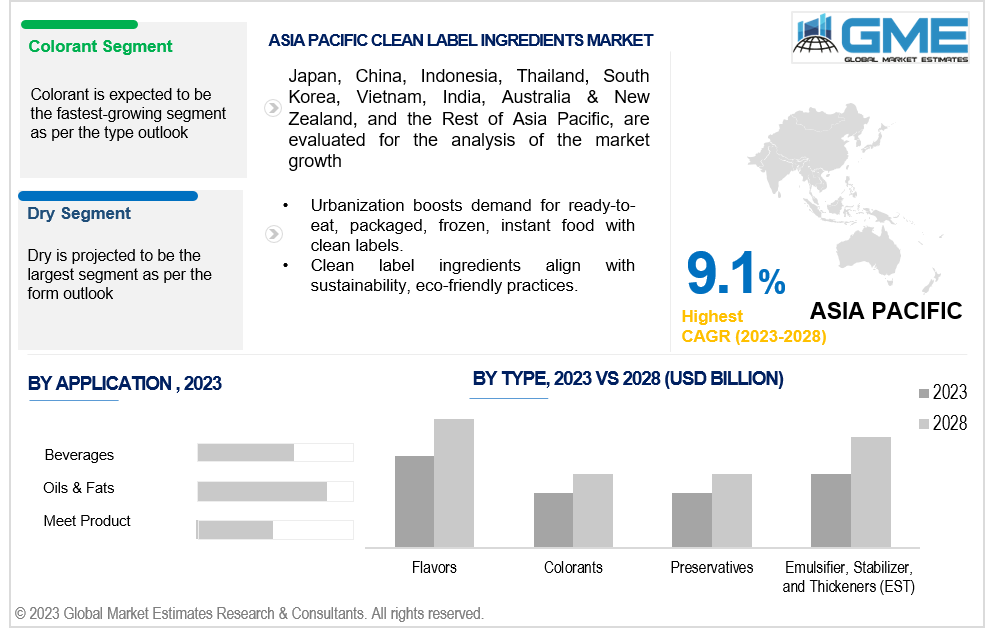
Colorant is projected to be the fastest growing segment 2023-2028. This segment is most widely preferred type of clean label ingredients due to the growing awareness regarding the ill effects of toxic additives, especially in dairy and beverage products. Clean label ingredients, such as lactic acid derived from biobased sources, are gaining popularity. Natural colorants, extracted from fruits, vegetables, and other plants, are becoming more accessible in liquid and powder forms.
Flour segment is expected to hold the largest share in the market as flour is a key ingredient in many food industries, including baking, packaged foods, beverages, dressings and sauces, and confectionery. Its economic importance lies in its widespread use and its ability to contribute to the overall quality and appeal of food products.
Dry is anticipated to be the fastest-growing segment in the market from 2023-2028. This projection is supported by economic factors such as cost-effectiveness, convenience in storage and transportation, and longer shelf life of dry ingredients. The dry segment's leading position is expected to contribute to the overall growth and profitability of the clean label ingredients market, as it aligns with the demands of manufacturers and consumers seeking efficient and economically viable solutions for their food products.
The beverages is anticipated to be the fastest-growing segment in the market from 2023-2028. This growth is attributed to the introduction of innovative clean label beverage products that offer new natural flavours and choices to customers. Additionally, the expansion of product portfolios within this segment contributes to its positive market outlook. These factors positively impact the economic aspects of the beverages industry, driving revenue generation and market expansion. The bakery & confectionery segment holds the largest share of the market primarily because of the extensive use of flour in various baked goods, including bread, pastries, cakes, and cookies.
North America is projected to be the largest region in the market. The market growth is primarily boosted by significant demand for various organic ingredients from the food and beverage industry. This demand is driven by factors such as increased internet penetration and higher per-capita income, which have positively impacted the growth of the clean label ingredients market. These macroeconomic factors contribute to the overall economic performance of the market in the region, leading to revenue generation and market expansion.
Asia Pacific is predicted to witness the fastest growth during the forecast period. This is ascribed to increasing standard of living in this region and growing demand for simple and convenient goods. In the Asia-Pacific region, China dominates the market for clean-label ingredients. To capitalise on consumers' growing interest in healthy eating and ingredient awareness, major players are concentrating their efforts in this area to inform them of the advantages of clean-label ingredients. To meet the growing consumer demand, a lot of food service providers, including restaurants, are switching to clean-label ingredients.
Cargill, Incorporated, Ingredion, Archer-Daniels-Midland Company., Givaudan, Tate & Lyle PLC., Kerry Group PLC., DSM, Sensient Technologies Corporation, NATUREX, and Chr. Hansen Holding A/S, among others, are some of the key players in the global clean label ingredients market.
Please note: This is not an exhaustive list of companies profiled in the report.
1 STRATEGIC INSIGHTS ON NEW REVENUE POCKETS
1.1 Strategic Opportunity & Attractiveness Analysis
1.1.1 Hot Revenue Pockets
1.1.2 Market Attractiveness Score
1.1.3 Revenue Impacting Opportunity
1.1.4 High Growing Region/Country
1.1.5 Competitor Analysis
1.1.6 Consumer Analysis
1.2 Global Market Estimates' View
1.3 Strategic Insights across Business Functions
1.3.1 For Chief Executive Officers
1.3.2 For Chief Marketing Officers
1.3.3 For Chief Strategy Officers
1.4 Evaluate the Potential of your Existing Business Lines vs. New Lines to Enter Into
2 TECHNOLOGICAL TRENDS
2.1 Technological Adoption Rate
2.2 Current Trend Impact Analysis
2.3 Future Trend Impact Analysis
2.4 Data Metrics
3 GLOBAL CLEAN LABEL INGREDIENTS MARKET OUTLOOK
3.1 Market Pyramid Analysis
3.1.1 Introduction
3.1.2 Adjacent Market Opportunities
3.1.3 Ancillary Market Opportunities
3.2 Demand Side Analysis
3.2.1 Market Drivers: Impact Analysis
3.2.2 Market Restraints: Impact Analysis
3.2.3 Market Opportunities: Impact Analysis
3.2.4 Market Challenges: Impact Analysis
3.3 Supply Side Analysis
3.3.1 Porter’s Five Forces Analysis
3.3.1.1 Threat of New Entrants
3.3.1.2 Threat of New Substitutes
3.3.1.3 Bargaining Power of Suppliers
3.3.1.4 Bargaining Power of Buyers
3.3.1.5 Intensity of Competitive Rivalry
3.3.2 SWOT Analysis; By Factor (Political & Legal, Economic, and Technological)
3.3.2.1 Political Landscape
3.3.2.2 Economic Landscape
3.3.2.3 Social Landscape
3.3.2.4 Technology Landscape
3.3.3 Value Chain Analysis
3.3.4 Trend Analysis
3.3.5 Gap Analysis
3.3.6 Cost Analysis
4 GLOBAL CLEAN LABEL INGREDIENTS MARKET, BY TYPE
4.1 Introduction
4.2 Clean Label Ingredients Market: Type Scope Key Takeaways
4.3 Revenue Growth Analysis, 2022 & 2028
4.4 Flavors
4.4.1 Flavors Market Estimates and Forecast, 2020-2028 (USD Billion)
4.5 Colorants
4.5.1 Colorants Market Estimates and Forecast, 2020-2028 (USD Billion)
4.6 Emulsifier, Stabilizer, and Thickeners (EST)
4.6.1 Emulsifier, Stabilizer, and Thickeners (EST) Market Estimates and Forecast, 2020-2028 (USD Billion)
4.7 Stabilizer and Thickeners (EST)
4.7.1 Stabilizer and Thickeners (EST) Market Estimates and Forecast, 2020-2028 (USD Billion)
4.8 Flours
4.8.1 Flours Market Estimates and Forecast, 2020-2028 (USD Billion)
4.9 Others
4.9.1 Others Market Estimates and Forecast, 2020-2028 (USD Billion)
5 GLOBAL CLEAN LABEL INGREDIENTS MARKET, BY FORM
5.1 Introduction
5.2 Clean Label Ingredients Market: Form Scope Key Takeaways
5.3 Revenue Growth Analysis, 2022 & 2028
5.4 Dry
5.4.1 Dry Market Estimates and Forecast, 2020-2028 (USD Billion)
5.5 Liquid
5.5.1 Liquid Market Estimates and Forecast, 2020-2028 (USD Billion)
6 GLOBAL CLEAN LABEL INGREDIENTS MARKET, BY APPLICATION
6.1 Introduction
6.2 Clean Label Ingredients Market: Application Scope Key Takeaways
6.3 Revenue Growth Analysis, 2022 & 2028
6.4 Dairy & Frozen Desserts
6.4.1 Dairy & Frozen Desserts Market Estimates and Forecast, 2020-2028 (USD Billion)
6.5 Beverages
6.5.1 Beverages Market Estimates and Forecast, 2020-2028 (USD Billion)
6.6 Preservatives
6.6.1 Preservatives Market Estimates and Forecast, 2020-2028 (USD Billion)
6.7 Bakery & Confectionery
6.7.1 Bakery & Confectionery Market Estimates and Forecast, 2020-2028 (USD Billion)
6.8 Meat Products
6.8.1 Meat Products Market Estimates and Forecast, 2020-2028 (USD Billion)
6.9 Sauce & Condiment
6.9.1 Sauce & Condiment Market Estimates and Forecast, 2020-2028 (USD Billion)
6.10 Oils & Fats
6.10.1 Oils & Fats Market Estimates and Forecast, 2020-2028 (USD Billion)
7 GLOBAL CLEAN LABEL INGREDIENTS MARKET, BY REGION
7.1 Introduction
7.2 North America Clean Label Ingredients Market Estimates and Forecast, 2020-2028 (USD Billion)
7.2.1 By Type
7.2.2 By Form
7.2.3 By Application
7.2.4 By Country
7.2.4.1 U.S. Clean Label Ingredients Market Estimates and Forecast, 2020-2028 (USD Billion)
7.2.4.1.1 By Type
7.2.4.1.2 By Form
7.2.4.1.3 By Application
7.2.4.2 Canada Clean Label Ingredients Market Estimates and Forecast, 2020-2028 (USD Billion)
7.2.4.2.1 By Type
7.2.4.2.2 By Form
7.2.4.2.3 By Application
7.2.4.3 Mexico Clean Label Ingredients Market Estimates and Forecast, 2020-2028 (USD Billion)
7.2.4.3.1 By Type
7.2.4.3.2 By Form
7.2.4.3.3 By Application
7.3 Europe Clean Label Ingredients Market Estimates and Forecast, 2020-2028 (USD Billion)
7.3.1 By Type
7.3.2 By Form
7.3.3 By Application
7.3.4 By Country
7.3.4.1 Germany Clean Label Ingredients Market Estimates and Forecast, 2020-2028 (USD Billion)
7.3.4.1.1 By Type
7.3.4.1.2 By Form
7.3.4.1.3 By Application
7.3.4.2 U.K. Clean Label Ingredients Market Estimates and Forecast, 2020-2028 (USD Billion)
7.3.4.2.1 By Type
7.3.4.2.2 By Form
7.3.4.2.3 By Application
7.3.4.3 France Clean Label Ingredients Market Estimates and Forecast, 2020-2028 (USD Billion)
7.3.4.3.1 By Type
7.3.4.3.2 By Form
7.3.4.3.3 By Application
7.3.4.4 Italy Clean Label Ingredients Market Estimates and Forecast, 2020-2028 (USD Billion)
7.3.4.4.1 By Type
7.3.4.4.2 By Form
7.2.4.4.3 By Application
7.3.4.5 Spain Clean Label Ingredients Market Estimates and Forecast, 2020-2028 (USD Billion)
7.3.4.5.1 By Type
7.3.4.5.2 By Form
7.2.4.5.3 By Application
7.3.4.6 Netherlands Clean Label Ingredients Market Estimates and Forecast, 2020-2028 (USD Billion)
7.3.4.6.1 By Type
7.3.4.6.2 By Form
7.2.4.6.3 By Application
7.3.4.7 Rest of Europe Clean Label Ingredients Market Estimates and Forecast, 2020-2028 (USD Billion)
7.3.4.7.1 By Type
7.3.4.7.2 By Form
7.2.4.7.3 By Application
7.4 Asia Pacific Clean Label Ingredients Market Estimates and Forecast, 2020-2028 (USD Billion)
7.4.1 By Type
7.4.2 By Form
7.4.3 By Application
7.4.4 By Country
7.4.4.1 China Clean Label Ingredients Market Estimates and Forecast, 2020-2028 (USD Billion)
7.4.4.1.1 By Type
7.4.4.1.2 By Form
7.4.4.1.3 By Application
7.4.4.2 Japan Clean Label Ingredients Market Estimates and Forecast, 2020-2028 (USD Billion)
7.4.4.2.1 By Type
7.4.4.2.2 By Form
7.4.4.2.3 By Application
7.4.4.3 India Clean Label Ingredients Market Estimates and Forecast, 2020-2028 (USD Billion)
7.4.4.3.1 By Type
7.4.4.3.2 By Form
7.4.4.3.3 By Application
7.4.4.4 South Korea Clean Label Ingredients Market Estimates and Forecast, 2020-2028 (USD Billion)
7.4.4.4.1 By Type
7.4.4.4.2 By Form
7.4.4.4.3 By Application
7.4.4.5 Singapore Clean Label Ingredients Market Estimates and Forecast, 2020-2028 (USD Billion)
7.4.4.5.1 By Type
7.4.4.5.2 By Form
7.4.4.5.3 By Application
7.4.4.6 Malaysia Clean Label Ingredients Market Estimates and Forecast, 2020-2028 (USD Billion)
7.4.4.6.1 By Type
7.4.4.6.2 By Form
7.4.4.6.3 By Application
7.4.4.7 Thailand Clean Label Ingredients Market Estimates and Forecast, 2020-2028 (USD Billion)
7.4.4.7.1 By Type
7.4.4.7.2 By Form
7.4.4.7.3 By Application
7.4.4.8 Indonesia Clean Label Ingredients Market Estimates and Forecast, 2020-2028 (USD Billion)
7.4.4.8.1 By Type
7.4.4.8.2 By Form
7.4.4.8.3 By Application
7.4.4.9 Vietnam Clean Label Ingredients Market Estimates and Forecast, 2020-2028 (USD Billion)
7.4.4.9.1 By Type
7.4.4.9.2 By Form
7.4.4.9.3 By Application
7.4.4.10 Taiwan Clean Label Ingredients Market Estimates and Forecast, 2020-2028 (USD Billion)
7.4.4.10.1 By Type
7.4.4.10.2 By Form
7.4.4.10.3 By Application
7.4.4.11 Rest of Asia Pacific Clean Label Ingredients Market Estimates and Forecast, 2020-2028 (USD Billion)
7.4.4.11.1 By Type
7.4.4.11.2 By Form
7.4.4.11.3 By Application
7.5 Middle East and Africa Clean Label Ingredients Market Estimates and Forecast, 2020-2028 (USD Billion)
7.5.1 By Type
7.5.2 By Form
7.5.3 By Application
7.5.4 By Country
7.5.4.1 Saudi Arabia Clean Label Ingredients Market Estimates and Forecast, 2020-2028 (USD Billion)
7.5.4.1.1 By Type
7.5.4.1.2 By Form
7.5.4.1.3 By Application
7.5.4.2 U.A.E. Clean Label Ingredients Market Estimates and Forecast, 2020-2028 (USD Billion)
7.5.4.2.1 By Type
7.5.4.2.2 By Form
7.5.4.2.3 By Application
7.5.4.3 Israel Clean Label Ingredients Market Estimates and Forecast, 2020-2028 (USD Billion)
7.5.4.3.1 By Type
7.5.4.3.2 By Form
7.5.4.3.3 By Application
7.5.4.4 South Africa Clean Label Ingredients Market Estimates and Forecast, 2020-2028 (USD Billion)
7.5.4.4.1 By Type
7.5.4.4.2 By Form
7.5.4.4.3 By Application
7.5.4.5 Rest of Middle East and Africa Clean Label Ingredients Market Estimates and Forecast, 2020-2028 (USD Billion)
7.5.4.5.1 By Type
7.5.4.5.2 By Form
7.5.4.5.2 By Application
7.6 Central & South America Clean Label Ingredients Market Estimates and Forecast, 2020-2028 (USD Billion)
7.6.1 By Type
7.6.2 By Form
7.6.3 By Application
7.6.4 By Country
7.6.4.1 Brazil Clean Label Ingredients Market Estimates and Forecast, 2020-2028 (USD Billion)
7.6.4.1.1 By Type
7.6.4.1.2 By Form
7.6.4.1.3 By Application
7.6.4.2 Argentina Eaporative Air Cooler Market Estimates and Forecast, 2020-2028 (USD Billion)
7.6.4.2.1 By Type
7.6.4.2.2 By Form
7.6.4.2.3 By Application
7.6.4.3 Chile Clean Label Ingredients Market Estimates and Forecast, 2020-2028 (USD Billion)
7.6.4.3.1 By Type
7.6.4.3.2 By Form
7.6.4.3.3 By Application
7.6.4.4 Rest of Central & South America Clean Label Ingredients Market Estimates and Forecast, 2020-2028 (USD Billion)
7.6.4.4.1 By Type
7.6.4.4.2 By Form
7.6.4.4.3 By Application
8 COMPETITIVE LANDCAPE
8.1 Company Market Share Analysis
8.2 Four Quadrant Positioning Matrix
8.2.1 Market Leaders
8.2.2 Market Visionaries
8.2.3 Market Challengers
8.2.4 Niche Market Players
8.3 Vendor Landscape
8.3.1 North America
8.3.2 Europe
8.3.3 Asia Pacific
8.3.4 Rest of the World
8.4 Company Profiles
8.4.1 CARGILL, INCORPORATED
8.4.1.1 Business Description & Financial Analysis
8.4.1.2 SWOT Analysis
8.4.1.3 Products & Services Offered
8.4.1.4 Strategic Alliances between Business Partners
8.4.2 Ingredion
8.4.2.1 Business Description & Financial Analysis
8.4.2.2 SWOT Analysis
8.4.2.3 Products & Services Offered
8.4.2.4 Strategic Alliances between Business Partners
8.4.3 Archer-Daniels-Midland Company.
8.4.3.1 Business Description & Financial Analysis
8.4.3.2 SWOT Analysis
8.4.3.3 Products & Services Offered
8.4.3.4 Strategic Alliances between Business Partners
8.4.4 Givaudan
8.4.4.1 Business Description & Financial Analysis
8.4.4.2 SWOT Analysis
8.4.4.3 Products & Services Offered
8.4.4.4 Strategic Alliances between Business Partners
8.4.5 TATE & LYLE PLC.
8.4.5.1 Business Description & Financial Analysis
8.4.5.2 SWOT Analysis
8.4.5.3 Products & Services Offered
8.4.5.4 Strategic Alliances between Business Partners
8.4.6 Kerry Group PLC.
8.4.6.1 Business Description & Financial Analysis
8.4.6.2 SWOT Analysis
8.4.6.3 Products & Services Offered
8.4.6.4 Strategic Alliances between Business Partners
8.4.7 DSM
8.4.7.1 Business Description & Financial Analysis
8.4.7.2 SWOT Analysis
8.4.7.3 Products & Services Offered
8.4.8.4 Strategic Alliances between Business Partners
8.4.8 Sensient Technologies Corporation,
8.4.8.1 Business Description & Financial Analysis
8.4.8.2 SWOT Analysis
8.4.8.3 Products & Services Offered
8.4.8.4 Strategic Alliances between Business Partners
8.4.9 NATUREX
8.4.9.1 Business Description & Financial Analysis
8.4.9.2 SWOT Analysis
8.4.9.3 Products & Services Offered
8.4.9.4 Strategic Alliances between Business Partners
8.4.10 Chr. Hansen Holding A/S
8.4.10.1 Business Description & Financial Analysis
8.4.10.2 SWOT Analysis
8.4.10.3 Products & Services Offered
8.4.10.4 Strategic Alliances between Business Partners
8.4.11 Other Companies
8.4.11.1 Business Description & Financial Analysis
8.4.11.2 SWOT Analysis
8.4.11.3 Products & Services Offered
8.4.11.4 Strategic Alliances between Business Partners
9 RESEARCH METHODOLOGY
9.1 Market Introduction
9.1.1 Market Definition
9.1.2 Market Scope & Segmentation
9.2 Information Procurement
9.2.1 Secondary Research
9.2.1.1 Purchased Databases
9.2.1.2 GMEs Internal Data Repository
9.2.1.3 Secondary Resources & Third Party Perspectives
9.2.1.4 Company Information Sources
9.2.2 Primary Research
9.2.2.1 Various Types of Respondents for Primary Interviews
9.2.2.2 Number of Interviews Conducted throughout the Research Process
9.2.2.3 Primary Stakeholders
9.2.2.4 Discussion Guide for Primary Participants
9.2.3 Expert Panels
9.2.3.1 Expert Panels Across 30+ Industry
9.2.4 Paid Local Experts
9.2.4.1 Paid Local Experts Across 30+ Industry Across each Region
9.3 Market Estimation
9.3.1 Top-Down Approach
9.3.1.1 Macro-Economic Indicators Considered
9.3.1.2 Micro-Economic Indicators Considered
9.3.2 Bottom Up Approach
9.3.2.1 Company Share Analysis Approach
9.3.2.2 Estimation of Potential Product Sales
9.4 Data Triangulation
9.4.1 Data Collection
9.4.2 Time Series, Cross Sectional & Panel Data Analysis
9.4.3 Cluster Analysis
9.5 Analysis and Output
9.5.1 Inhouse AI Based Real Time Analytics Tool
9.5.2 Output From Desk & Primary Research
9.6 Research Assumptions & Limitations
9.7.1 Research Assumptions
9.7.2 Research Limitations
LIST OF TABLES
1 Global Clean Label Ingredients Market, By Type, 2020-2028 (USD Billion)
2 Flavors Market, By Region, 2020-2028 (USD Billion)
3 Colorants Market, By Region, 2020-2028 (USD Billion)
4 Additives Market, By Region, 2020-2028 (USD Billion)
5 Emulsifier, Stabilizer, and Thickeners (EST) Market, By Region, 2020-2028 (USD Billion)
6 Flour Market, By Region, 2020-2028 (USD Billion)
7 Others Market, By Region, 2020-2028 (USD Billion)
8 Global Clean Label Ingredients Market, By Form, 2020-2028 (USD Billion)
9 Dry Market, By Region, 2020-2028 (USD Billion)
10 Liquid Market, By Region, 2020-2028 (USD Billion)
11 Global Clean Label Ingredients Market, By Application, 2020-2028 (USD Billion)
12 Dairy & Frozen Desserts Market, By Region, 2020-2028 (USD Billion)
13 Beverages Market, By Region, 2020-2028 (USD Billion)
14 meat product Market, By Region, 2020-2028 (USD Billion)
15 bakery & confectionery Market, By Region, 2020-2028 (USD Billion)
16 Sauce & Condiment Market, By Region, 2020-2028 (USD Billion)
17 oils & fatsMarket, By Region, 2020-2028 (USD Billion)
18 Preservatives Market, By Region, 2020-2028 (USD Billion)
19 Regional Analysis, 2020-2028 (USD Billion)
20 North America Clean Label Ingredients Market, By Type, 2020-2028 (USD Billion)
21 North America Clean Label Ingredients Market, By Form, 2020-2028 (USD Billion)
22 North America Clean Label Ingredients Market, By Application, 2020-2028 (USD Billion)
23 North America Clean Label Ingredients Market, By Country, 2020-2028 (USD Billion)
24 U.S Clean Label Ingredients Market, By Type, 2020-2028 (USD Billion)
25 U.S Clean Label Ingredients Market, By Form, 2020-2028 (USD Billion)
26 U.S Clean Label Ingredients Market, By Application, 2020-2028 (USD Billion)
27 Canada Clean Label Ingredients Market, By Type, 2020-2028 (USD Billion)
28 Canada Clean Label Ingredients Market, By Form, 2020-2028 (USD Billion)
29 Canada Clean Label Ingredients Market, By Application, 2020-2028 (USD Billion)
30 Mexico Clean Label Ingredients Market, By Type, 2020-2028 (USD Billion)
31 Mexico Clean Label Ingredients Market, By Form, 2020-2028 (USD Billion)
32 Mexico Clean Label Ingredients Market, By Application, 2020-2028 (USD Billion)
33 Europe Clean Label Ingredients Market, By Type, 2020-2028 (USD Billion)
34 Europe Clean Label Ingredients Market, By Form, 2020-2028 (USD Billion)
35 Europe Clean Label Ingredients Market, By Application, 2020-2028 (USD Billion)
36 Germany Clean Label Ingredients Market, By Type, 2020-2028 (USD Billion)
37 Germany Clean Label Ingredients Market, By Form, 2020-2028 (USD Billion)
38 Germany Clean Label Ingredients Market, By Application, 2020-2028 (USD Billion)
39 UK Clean Label Ingredients Market, By Type, 2020-2028 (USD Billion)
40 UK Clean Label Ingredients Market, By Form, 2020-2028 (USD Billion)
41 UK Clean Label Ingredients Market, By Application, 2020-2028 (USD Billion)
42 France Clean Label Ingredients Market, By Type, 2020-2028 (USD Billion)
43 France Clean Label Ingredients Market, By Form, 2020-2028 (USD Billion)
44 France Clean Label Ingredients Market, By Application, 2020-2028 (USD Billion)
45 Italy Clean Label Ingredients Market, By Type, 2020-2028 (USD Billion)
46 Italy Clean Label Ingredients Market, By Application Type, 2020-2028 (USD Billion)
47 Italy Clean Label Ingredients Market, By Application, 2020-2028 (USD Billion)
48 Spain Clean Label Ingredients Market, By Type, 2020-2028 (USD Billion)
49 Spain Clean Label Ingredients Market, By Form, 2020-2028 (USD Billion)
50 Spain Clean Label Ingredients Market, By Application, 2020-2028 (USD Billion)
51 Rest Of Europe Clean Label Ingredients Market, By Type, 2020-2028 (USD Billion)
52 Rest Of Europe Clean Label Ingredients Market, By Form, 2020-2028 (USD Billion)
53 Rest of Europe Clean Label Ingredients Market, By Application, 2020-2028 (USD Billion)
54 Asia Pacific Clean Label Ingredients Market, By Type, 2020-2028 (USD Billion)
55 Asia Pacific Clean Label Ingredients Market, By Form, 2020-2028 (USD Billion)
56 Asia Pacific Clean Label Ingredients Market, By Application, 2020-2028 (USD Billion)
57 Asia Pacific Clean Label Ingredients Market, By Country, 2020-2028 (USD Billion)
58 China Clean Label Ingredients Market, By Type, 2020-2028 (USD Billion)
59 China Clean Label Ingredients Market, By Form, 2020-2028 (USD Billion)
60 China Clean Label Ingredients Market, By Application, 2020-2028 (USD Billion)
61 India Clean Label Ingredients Market, By Type, 2020-2028 (USD Billion)
62 India Clean Label Ingredients Market, By Form, 2020-2028 (USD Billion)
63 India Clean Label Ingredients Market, By Application, 2020-2028 (USD Billion)
64 Japan Clean Label Ingredients Market, By Type, 2020-2028 (USD Billion)
65 Japan Clean Label Ingredients Market, By Form, 2020-2028 (USD Billion)
66 Japan Clean Label Ingredients Market, By Application, 2020-2028 (USD Billion)
67 South Korea Clean Label Ingredients Market, By Type, 2020-2028 (USD Billion)
68 South Korea Clean Label Ingredients Market, By Form, 2020-2028 (USD Billion)
69 South Korea Clean Label Ingredients Market, By Application, 2020-2028 (USD Billion)
70 Middle East and Africa Clean Label Ingredients Market, By Type, 2020-2028 (USD Billion)
71 Middle East and Africa Clean Label Ingredients Market, By Form, 2020-2028 (USD Billion)
72 Middle East and Africa Clean Label Ingredients Market, By Application, 2020-2028 (USD Billion)
73 Middle East and Africa Clean Label Ingredients Market, By Country, 2020-2028 (USD Billion)
74 Saudi Arabia Clean Label Ingredients Market, By Type, 2020-2028 (USD Billion)
75 Saudi Arabia Clean Label Ingredients Market, By Form, 2020-2028 (USD Billion)
76 Saudi Arabia Clean Label Ingredients Market, By Application, 2020-2028 (USD Billion)
77 UAE Clean Label Ingredients Market, By Type, 2020-2028 (USD Billion)
78 UAE Clean Label Ingredients Market, By Form, 2020-2028 (USD Billion)
79 UAE Clean Label Ingredients Market, By Application, 2020-2028 (USD Billion)
80 Central & South America Clean Label Ingredients Market, By Type, 2020-2028 (USD Billion)
81 Central & South America Clean Label Ingredients Market, By Form, 2020-2028 (USD Billion)
82 Central & South America Clean Label Ingredients Market, By Application, 2020-2028 (USD Billion)
83 Central & South America Clean Label Ingredients Market, By Country, 2020-2028 (USD Billion)
84 Brazil Clean Label Ingredients Market, By Type, 2020-2028 (USD Billion)
85 Brazil Clean Label Ingredients Market, By Form, 2020-2028 (USD Billion)
86 Brazil Clean Label Ingredients Market, By Application, 2020-2028 (USD Billion)
87 CARGILL, INCORPORATED: Products & Services Offering
88 Ingredion: Products & Services Offering
89 Archer-Daniels-Midland Company.: Products & Services Offering
90 Givaudan: Products & Services Offering
91 TATE & LYLE PLC.: Products & Services Offering
92 Kerry Group PLC.: Products & Services Offering
93 DSM : Products & Services Offering
94 Sensient Technologies Corporation, : Products & Services Offering
95 NATUREX, Inc: Products & Services Offering
96 Chr. Hansen Holding A/S: Products & Services Offering
97 Other Companies: Products & Services Offering
LIST OF FIGURES
1 Global Clean Label Ingredients Market Overview
2 Global Clean Label Ingredients Market Value From 2020-2028 (USD Billion)
3 Global Clean Label Ingredients Market Share, By Type (2022)
4 Global Clean Label Ingredients Market Share, By Form (2022)
5 Global Clean Label Ingredients Market Share, By Application (2022)
6 Global Clean Label Ingredients Market, By Region (Asia Pacific Market)
7 Technological Trends In Global Clean Label Ingredients Market
8 Four Quadrant Competitor Positioning Matrix
9 Impact Of Macro & Micro Indicators On The Market
10 Impact Of Key Drivers On The Global Clean Label Ingredients Market
11 Impact Of Challenges On The Global Clean Label Ingredients Market
12 Porter’s Five Forces Analysis
13 Global Clean Label Ingredients Market: By Type Scope Key Takeaways
14 Global Clean Label Ingredients Market, By Type Segment: Revenue Growth Analysis
15 Flavors Market, By Region, 2020-2028 (USD Billion)
16 Colorants Market, By Region, 2020-2028 (USD Billion)
17 Additives Market, By Region, 2020-2028 (USD Billion)
18 Emulsifier, Stabilizer, and Thickeners (EST) Market, By Region, 2020-2028 (USD Billion)
19 Flour Market, By Region, 2020-2028 (USD Billion)
20 OtherMarket, By Region, 2020-2028 (USD Billion)
21 Global Clean Label Ingredients Market: By Form Scope Key Takeaways
22 Global Clean Label Ingredients Market, By Form Segment: Revenue Growth Analysis
23 Dry Market, By Region, 2020-2028 (USD Billion)
24 Liquid Market, By Region, 2020-2028 (USD Billion)
25 Global Clean Label Ingredients Market: By Application Scope Key Takeaways
26 Global Clean Label Ingredients Market, By Application Segment: Revenue Growth Analysis
27 Dairy & Frozen Desserts Market, By Region, 2020-2028 (USD Billion)
28 Beverages Market, By Region, 2020-2028 (USD Billion)
29 Preservatives Market, By Region, 2020-2028 (USD Billion)
30 Bakery & Confectionery Market, By Region, 2020-2028 (USD Billion)
31 Meat Products Market, By Region, 2020-2028 (USD Billion)
32 Sauce & Condiment Market, By Region, 2020-2028 (USD Billion)
33 Oils & Fats Market, By Region, 2020-2028 (USD Billion)
34 Regional Segment: Revenue Growth Analysis
35 Global Clean Label Ingredients Market: Regional Analysis
36 North America Clean Label Ingredients Market Overview
37 North America Clean Label Ingredients Market, By Type
38 North America Clean Label Ingredients Market, By Form
39 North America Clean Label Ingredients Market, By Application
40 North America Clean Label Ingredients Market, By Country
41 U.S. Clean Label Ingredients Market, By Type
42 U.S. Clean Label Ingredients Market, By Form
43 U.S. Clean Label Ingredients Market, By Application
44 Canada Clean Label Ingredients Market, By Type
45 Canada Clean Label Ingredients Market, By Form
46 Canada Clean Label Ingredients Market, By Application
47 Mexico Clean Label Ingredients Market, By Type
48 Mexico Clean Label Ingredients Market, By Form
49 Mexico Clean Label Ingredients Market, By Application
50 Four Quadrant Positioning Matrix
51 Company Market Share Analysis
52 CARGILL, INCORPORATED: Company Snapshot
53 CARGILL, INCORPORATED: SWOT Analysis
54 CARGILL, INCORPORATED: Geographic Presence
55 Ingredion: Company Snapshot
56 Ingredion: SWOT Analysis
57 Ingredion: Geographic Presence
58 Archer-Daniels-Midland Company.: Company Snapshot
59 Archer-Daniels-Midland Company.: SWOT Analysis
60 Archer-Daniels-Midland Company.: Geographic Presence
61 Givaudan: Company Snapshot
62 Givaudan: Swot Analysis
63 Givaudan: Geographic Presence
64 TATE & LYLE PLC.: Company Snapshot
65 TATE & LYLE PLC.: SWOT Analysis
66 TATE & LYLE PLC.: Geographic Presence
67 Kerry Group PLC.: Company Snapshot
68 Kerry Group PLC.: SWOT Analysis
69 Kerry Group PLC.: Geographic Presence
70 DSM : Company Snapshot
71 DSM : SWOT Analysis
72 DSM : Geographic Presence
73 Sensient Technologies Corporation, : Company Snapshot
74 Sensient Technologies Corporation, : SWOT Analysis
75 Sensient Technologies Corporation, : Geographic Presence
76 NATUREX, Inc.: Company Snapshot
77 NATUREX, Inc.: SWOT Analysis
78 NATUREX, Inc.: Geographic Presence
79 Chr. Hansen Holding A/S: Company Snapshot
80 Chr. Hansen Holding A/S: SWOT Analysis
81 Chr. Hansen Holding A/S: Geographic Presence
82 Other Companies: Company Snapshot
83 Other Companies: SWOT Analysis
84 Other Companies: Geographic Presence
The Global Clean Label Ingredients Market has been studied from the year 2019 till 2028. However, the CAGR provided in the report is from the year 2023 to 2028. The research methodology involved three stages: Desk research, Primary research, and Analysis & Output from the entire research process.

The desk research involved a robust background study which meant referring to paid and unpaid databases to understand the market dynamics; mapping contracts from press releases; identifying the key players in the market, studying their product portfolio, competition level, annual reports/SEC filings & investor presentations; and learning the demand and supply-side analysis for the Clean Label Ingredients Market.

The primary research activity included telephonic conversations with more than 50 tier 1 industry consultants, distributors, and end-use product manufacturers.

Finally, based on the above thorough research process, an in-depth analysis was carried out considering the following aspects: market attractiveness, current & future market trends, market share analysis, SWOT analysis of the company and customer analytics.

Frequently Asked Questions
This FREE sample includes market data points, ranging from trend analyses to market estimates & forecasts. See for yourself.
Or view our licence options:
Tailor made solutions just for you
80% of our clients seek made-to-order reports. How do you want us to tailor yours?
OUR CLIENTS


