This report was recently updated on August 13 2025 with the latest and most recent
market numbers
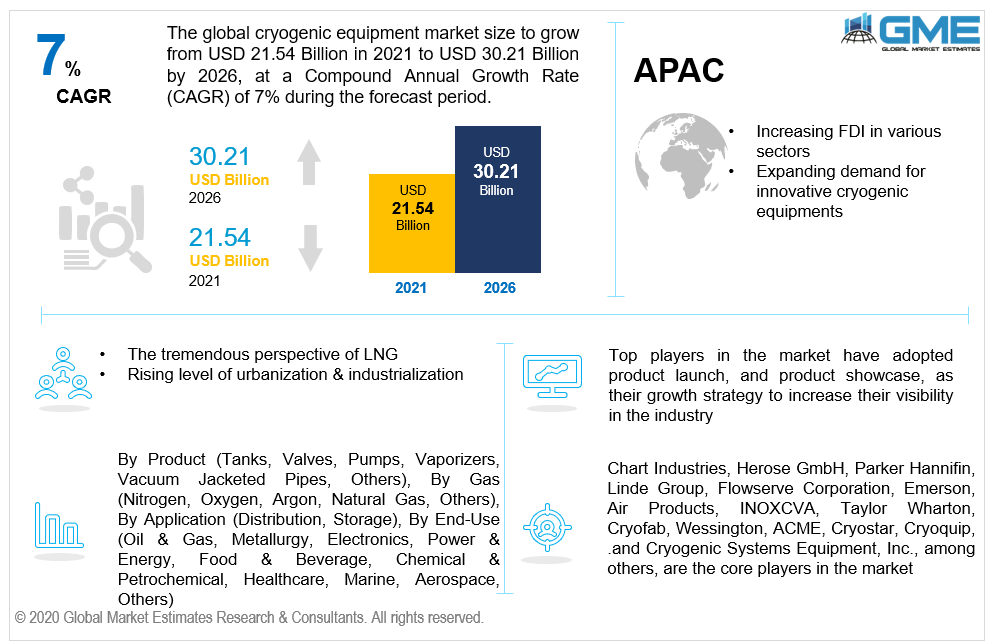
Global Cryogenic Equipment Market Size, Trends & Analysis - Forecasts to 2026 By Product (Tanks, Valves, Pumps, Vaporizers, Vacuum Jacketed Pipes, Others), By Gas (Nitrogen, Oxygen, Argon, Natural Gas, Others), By Application (Distribution, Storage), By End-Use (Oil & Gas, Metallurgy, Electronics, Power & Energy, Food & Beverage, Chemical & Petrochemical, Healthcare, Marine, Aerospace, Others), Competitive Landscape, Company Market Share Analysis, and Competitor Analysis; By Region (North America, Europe, Asia Pacific, MEA, and CSA); End-User Landscape, Company Market Share Analysis & Competitor Analysis
The global cryogenic equipment market is estimated to be valued at USD 21.54 billion in 2021 and is projected to reach USD 30.21 billion by 2026 at a CAGR of 7%. The primary element driving global demand for such equipment is soaring government and private sector efforts to encourage the expanded usage of greener fuels, including natural gas, for domestic and industrial operations. Aside from that, the growing trend of industrialization & urbanization, as well as burgeoning demand in the healthcare sector, are all encouraging the worldwide market's expansion opportunities. Furthermore, certain strict rules relating to the region's prospective pollution control objectives are likely to stimulate growth in such equipment utilization in the natural gas processing sector.
Cryogenic equipment market expansion is expected to be accelerated by rising demand in the power & energy industry, as well as the increased introduction of industrial technologies. HTS cabling and energy management have improved as the power and energy industry has progressed. This finally aids in overall market expansion. Also, significant expenditures on smart cities and high-speed trains are likely to provide development opportunities for key stakeholders in developing economies. Expanding LNG requirements and better healthcare facilities in emerging economies are two main factors boosting the market.
Furthermore, increased infrastructure investment is projected to stimulate such equipment deployment in a multitude of sectors. Furthermore, such equipment will be used in more complicated industrial applications, fueling the overall demand. Likewise, the increased need for energy and power production will stimulate the consumption of LNG-based power production, resulting in increased use of oil tankers for transportation in the shipbuilding sector. Cryogenic equipment's evolution will also be aided by these considerations.
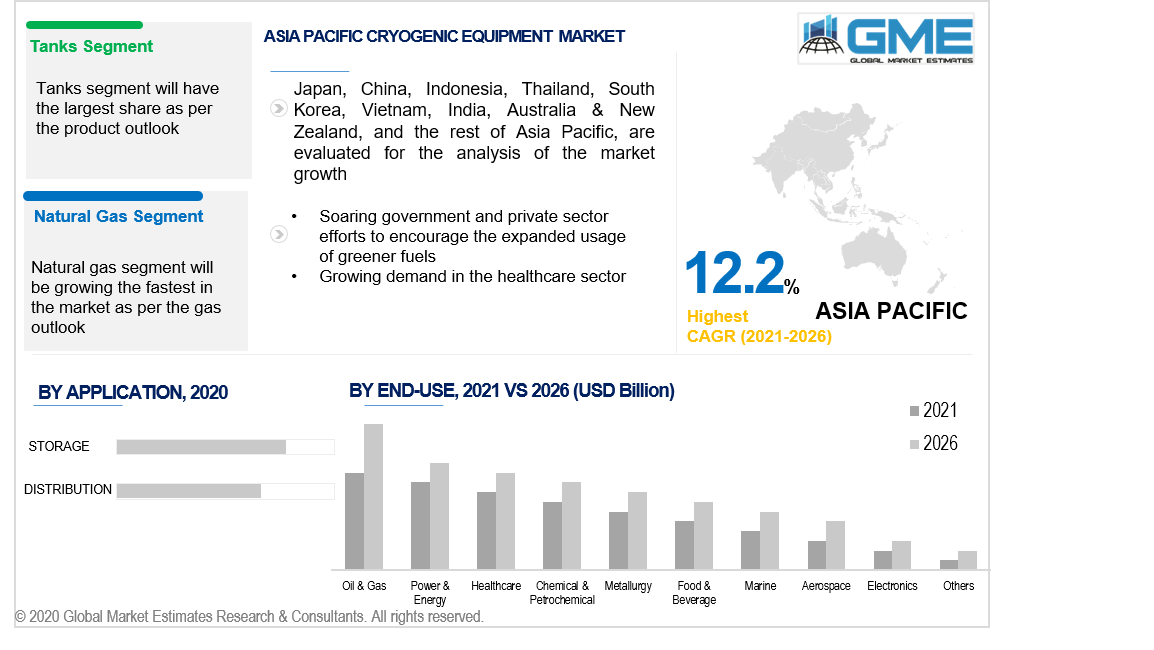
Depending on the product, the market is categorized as tanks, valves, pumps, vaporizers, vacuum jacketed pipes, and others. The tank segment is likely to be the most prominent. Because LNG transporters deliver such a large proportion of LNG in their cargo tanks, controlling tank pressure is critical. Tanks offer several advantages, notably superior insulation, longer service life, and cheaper maintenance costs.
Depending on the product, the market is categorized into nitrogen, oxygen, argon, natural gas, and others. Natural gas has risen to the top of the market. The US government's shale revolution has resulted in high natural gas output, which has increased industrial demand in the oil and gas sector. Expanded natural gas trading is predicted to provide the market with enormous development potential. As a result, rising LNG demand among myriad sectors, combined with increased industrialization, will propel the market forward throughout the forecast period.
The nitrogen cryogenic equipment market is likely to have the second-largest share, owing to a comprehensive range of applications in oil and gas, metallurgy, as well as the chemical industry. It is employed in the healthcare sector to package medications and freeze blood, as well as to cleanse machinery containers and pipes in the chemical, pharmaceutical, and food & beverage sectors. Subsequently, because of its widespread use in the healthcare and steel industries, the oxygen cryogenic equipment market is also growing.
Depending on the application, the market is categorized as distribution and storage. Storage is regarded as the most prevalent application domain. It could be ascribed to the growing demand for liquefied gases like oxygen, nitrogen, natural gas, and argon, as well as the increased necessity for acquiring, warehousing, processing, and transporting them. The device is used to create low-temperature storage environments for such gases. Gases inside the container act as insulation, reducing temperature changes due to changes in the outside environment.
Depending on the end-use, the market is categorized as oil & gas, metallurgy, electronics, power & energy, food & beverage, chemical & petrochemical, healthcare, marine, aerospace, and others. Because of the vast range of uses for refining and refueling, the oil and gas segment is expected to have the largest market share amongst the end-users. Additional applications include LNG transportation and gas processing. In addition, technological improvements in the discovery of alternative oil and gas sources such as tight gas, tight oil, shale gas, and coal bed methane will drive the market forward. Transportation containers for cryogenic liquid cylinders are witnessing soaring demand because the oil and gas trade relies on a variety of equipment, including LNG vessels, valves, and pumps.
As per the geographical analysis, the market can be classified into North America (the United States, Canada, and Mexico), Asia Pacific (India, China, Japan, Malaysia, Singapore, and Rest of Asia Pacific), Europe (Germany, United Kingdom, Italy, France, Spain, Netherlands, and Rest of Europe), Middle East & Africa (Saudi Arabia, United Arab Emirates, and Rest of the Middle East & Africa) and Central & South America (Brazil, Argentina, and Rest of Central and South America).
The Asia Pacific is foreseen to be the dominant market. As a result of the growing investment in LNG shipping as an energy and fuel resource that is abundant in Asian nations, the overall demand has risen. Funds such as FDI have increased significantly in many sectors, resulting in a tremendous need for such equipment in the area. The area is quickly becoming the most dynamic end market for industrial technologies. Especially this market is witnessing significant expansion in allied industries like metallurgy, chemical manufacturing, food & beverages, and energy & power. Such equipment providers have a tremendous opportunity to intensify manufacturing to meet demand from the healthcare sector as a result of COVID-19. Thus, cryogenic cylinder manufacture is being pushed by core players in the APAC.
The Asia-Pacific is one of the world's leading areas regarding investment and infrastructural development, which serves to propel the industrial sector to new altitudes. The industrial sector encompasses industries that use such equipment, including manufacturing, processing, and construction. As a result, the market volume will be driven by the rising level of urbanization, industrialization, and burgeoning demands for LNG from APAC.
Due to widespread use in the food & beverage, healthcare, and electronics sectors to preserve products at low temperatures, Europe is expected to take a significant market share throughout the forecast period. The European government prefers LNG because it is a low-emission fuel that meets ecological considerations. A considerable portion of LNG is delivered to significant European economies, resulting in a high need for LNG storage tanks. Subsequently, the tremendous perspective of LNG and the expanding use of such equipment in North America represents a large expansion prognosis for the market throughout the forecast period.
Chart Industries, Herose GmbH, Parker Hannifin, Linde Group, Flowserve Corporation, Emerson, Air Products, INOXCVA, Taylor Wharton, Cryofab, Wessington, ACME, Cryostar, Cryoquip, .and Cryogenic Systems Equipment, Inc., among others, are the key players in the market.
Please note: This is not an exhaustive list of companies profiled in the report.
Chapter 1 Methodology
1.1 Market Scope & Definitions
1.2 Estimates & Forecast Calculation
1.3 Historical Data Overview And Validation
1.4 Data Sources
1.4.1 Secondary
1.4.2 Primary
Chapter 2 Report Outlook
2.1 Global Cryogenic Equipment Industry Overview, 2019-2026
2.1.1 Industry Overview
2.1.2 Product Overview
2.1.3 Gas Overview
2.1.4 Application Overview
2.1.5 End-Use Overview
2.1.6 Regional Overview
Chapter 3 Global Cryogenic Equipment Market Trends
3.1 Market Segmentation
3.2 Industry Background, 2019-2026
3.3 Market Key Trends
3.3.1 Positive Trends
3.3.1.1 Rising Foreign Direct Investment (FDI) Contributions
3.3.1.2 Growing Trend of Industrialization & Urbanization
3.3.2 Industry Challenges
3.3.2.1 Cost of Maintenance
3.4 Prospective Growth Scenario
3.4.1 Product Growth Scenario
3.4.2 Gas Growth Scenario
3.4.3 Application Growth Scenario
3.4.4 End-Use Growth Scenario
3.5 COVID-19 Influence over Industry Growth
3.6 Porter’s Analysis
3.7 PESTEL Analysis
3.8 Value Chain & Supply Chain Analysis
3.9 Regulatory Framework
3.9.1 North America
3.9.2 Europe
3.9.3 APAC
3.9.4 LATAM
3.9.5 MEA
3.10 Technology Overview
3.11 Market Share Analysis, 2020
3.11.1 Company Positioning Overview, 2020
Chapter 4 Global Cryogenic Equipment Market, By Product
4.1 Product Outlook
4.2 Tanks
4.2.1 Market Size, By Region, 2019-2026 (USD Million)
4.3 Valves
4.3.1 Market Size, By Region, 2019-2026 (USD Million)
4.4 Pumps
4.4.1 Market Size, By Region, 2019-2026 (USD Million)
4.5 Vaporizers
4.5.1 Market Size, By Region, 2019-2026 (USD Million)
4.6 Vacuum Jacketed Pipes
4.6.1 Market Size, By Region, 2019-2026 (USD Million)
4.7 Others
4.7.1 Market Size, By Region, 2019-2026 (USD Million)
Chapter 5 Global Cryogenic Equipment Market, By Gas
5.1 Gas Outlook
5.2 Nitrogen
5.2.1 Market Size, By Region, 2019-2026 (USD Million)
5.3 Oxygen
5.3.1 Market Size, By Region, 2019-2026 (USD Million)
5.4 Argon
5.4.1 Market Size, By Region, 2019-2026 (USD Million)
5.5 Natural Gas
5.5.1 Market Size, By Region, 2019-2026 (USD Million)
5.6 Others
5.6.1 Market Size, By Region, 2019-2026 (USD Million)
Chapter 6 Global Cryogenic Equipment Market, By Application
6.1 Application Outlook
6.2 Distribution
6.2.1 Market Size, By Region, 2019-2026 (USD Million)
6.3 Storage
6.3.1 Market Size, By Region, 2019-2026 (USD Million)
Chapter 7 Global Cryogenic Equipment Market, By End-Use
7.1 End-Use Outlook
7.2 Oil & Gas
5.2.1 Market Size, By Region, 2019-2026 (USD Million)
7.4 Metallurgy
7.4.1 Market Size, By Region, 2019-2026 (USD Million)
7.5 Electronics
7.5.1 Market Size, By Region, 2019-2026 (USD Million)
7.6 Power & Energy
7.6.1 Market Size, By Region, 2019-2026 (USD Million)
7.7 Food & Beverage
7.7.1 Market Size, By Region, 2019-2026 (USD Million)
7.8 Chemical & Petrochemical
7.8.1 Market Size, By Region, 2019-2026 (USD Million)
7.9 Healthcare
7.9.1 Market Size, By Region, 2019-2026 (USD Million)
7.10 Marine
7.10.1 Market Size, By Region, 2019-2026 (USD Million)
7.11 Aerospace
7.11.1 Market Size, By Region, 2019-2026 (USD Million)
7.12 Others
7.12.1 Market Size, By Region, 2019-2026 (USD Million)
Chapter 8 Global Cryogenic Equipment Market, By Region
8.1 Regional outlook
8.2 North America
8.2.1 Market Size, By Country, 2019-2026 (USD Million)
8.2.2 Market Size, By Product, 2019-2026 (USD Million)
8.2.3 Market Size, By Gas, 2019-2026 (USD Million)
8.2.4 Market Size, By Application, 2019-2026 (USD Million)
8.2.5 Market Size, By End-Use, 2019-2026 (USD Million)
8.2.6 U.S.
8.2.6.1 Market Size, By Product, 2019-2026 (USD Million)
8.2.6.2 Market Size, By Gas, 2019-2026 (USD Million)
8.2.6.3 Market Size, By Application, 2019-2026 (USD Million)
8.2.6.4 Market Size, By End-Use, 2019-2026 (USD Million)
8.2.7 Canada
8.2.7.1 Market Size, By Product, 2019-2026 (USD Million)
8.2.7.2 Market Size, By Gas, 2019-2026 (USD Million)
8.2.7.3 Market Size, By Application, 2019-2026 (USD Million)
8.2.7.4 Market Size, By End-Use, 2019-2026 (USD Million)
8.3 Europe
8.3.1 Market Size, By Country, 2019-2026 (USD Million)
8.3.2 Market Size, By Product, 2019-2026 (USD Million)
8.3.3 Market Size, By Gas, 2019-2026 (USD Million)
8.3.4 Market Size, By Application, 2019-2026 (USD Million)
8.3.5 Market Size, By End-Use, 2019-2026 (USD Million)
8.3.6 Germany
8.3.6.1 Market Size, By Product, 2019-2026 (USD Million)
8.3.6.2 Market Size, By Gas, 2019-2026 (USD Million)
8.3.6.3 Market Size, By Application, 2019-2026 (USD Million)
8.3.6.4 Market Size, By End-Use, 2019-2026 (USD Million)
8.3.7 UK
8.3.7.1 Market Size, By Product, 2019-2026 (USD Million)
8.3.7.2 Market Size, By Gas, 2019-2026 (USD Million)
8.3.7.3 Market Size, By Application, 2019-2026 (USD Million)
8.3.7.4 Market Size, By End-Use, 2019-2026 (USD Million)
8.3.8 France
8.3.8.1 Market Size, By Product, 2019-2026 (USD Million)
8.3.8.2 Market Size, By Gas, 2019-2026 (USD Million)
8.3.8.3 Market Size, By Application, 2019-2026 (USD Million)
8.3.8.4 Market Size, By End-Use, 2019-2026 (USD Million)
8.3.9 Italy
8.3.9.1 Market Size, By Product, 2019-2026 (USD Million)
8.3.9.2 Market Size, By Gas, 2019-2026 (USD Million)
8.3.9.3 Market Size, By Application, 2019-2026 (USD Million)
8.3.9.4 Market Size, By End-Use, 2019-2026 (USD Million)
8.3.10 Spain
8.3.10.1 Market Size, By Product, 2019-2026 (USD Million)
8.3.10.2 Market Size, By Gas, 2019-2026 (USD Million)
8.3.10.3 Market Size, By Application, 2019-2026 (USD Million)
8.3.10.4 Market Size, By End-Use, 2019-2026 (USD Million)
8.3.11 Russia
8.3.11.1 Market Size, By Product, 2019-2026 (USD Million)
8.3.11.2 Market Size, By Gas, 2019-2026 (USD Million)
8.3.11.3 Market Size, By Application, 2019-2026 (USD Million)
8.3.11.4 Market Size, By End-Use, 2019-2026 (USD Million)
8.4 Asia Pacific
8.4.1 Market Size, By Country, 2019-2026 (USD Million)
8.4.2 Market Size, By Product, 2019-2026 (USD Million)
8.4.3 Market Size, By Gas, 2019-2026 (USD Million)
8.4.4 Market Size, By Application, 2019-2026 (USD Million)
8.4.5 Market Size, By End-Use, 2019-2026 (USD Million)
8.4.6 China
8.4.6.1 Market Size, By Product, 2019-2026 (USD Million)
8.4.6.2 Market Size, By Gas, 2019-2026 (USD Million)
8.4.6.3 Market Size, By Application, 2019-2026 (USD Million)
8.4.6.4 Market Size, By End-Use, 2019-2026 (USD Million)
8.4.7 India
8.4.7.1 Market Size, By Product, 2019-2026 (USD Million)
8.4.7.2 Market Size, By Gas, 2019-2026 (USD Million)
8.4.7.3 Market Size, By Application, 2019-2026 (USD Million)
8.4.7.4 Market Size, By End-Use, 2019-2026 (USD Million)
8.4.8 Japan
8.4.8.1 Market Size, By Product, 2019-2026 (USD Million)
8.4.8.2 Market Size, By Gas, 2019-2026 (USD Million)
8.4.8.3 Market Size, By Application, 2019-2026 (USD Million)
8.4.8.4 Market Size, By End-Use, 2019-2026 (USD Million)
8.4.9 Australia
8.4.9.1 Market Size, By Product, 2019-2026 (USD Million)
8.4.9.2 Market size, By Gas, 2019-2026 (USD Million)
8.4.9.3 Market size, By Application, 2019-2026 (USD Million)
8.4.9.4 Market size, By End-Use, 2019-2026 (USD Million)
8.4.10 South Korea
8.4.10.1 Market Size, By Product, 2019-2026 (USD Million)
8.4.10.2 Market Size, By Gas, 2019-2026 (USD Million)
8.4.10.3 Market Size, By Application, 2019-2026 (USD Million)
8.4.10.4 Market Size, By End-Use, 2019-2026 (USD Million)
8.5 Latin America
8.5.1 Market Size, By Country, 2019-2026 (USD Million)
8.5.2 Market Size, By Product, 2019-2026 (USD Million)
8.5.3 Market Size, By Gas, 2019-2026 (USD Million)
8.5.4 Market Size, By Application, 2019-2026 (USD Million)
8.5.5 Market Size, By End-Use, 2019-2026 (USD Million)
8.5.6 Brazil
8.5.6.1 Market Size, By Product, 2019-2026 (USD Million)
8.5.6.2 Market Size, By Gas, 2019-2026 (USD Million)
8.5.6.3 Market Size, By Application, 2019-2026 (USD Million)
8.5.6.4 Market Size, By End-Use, 2019-2026 (USD Million)
8.5.7 Mexico
8.5.7.1 Market Size, By Product, 2019-2026 (USD Million)
8.5.7.2 Market Size, By Gas, 2019-2026 (USD Million)
8.5.7.3 Market Size, By Application, 2019-2026 (USD Million)
8.5.7.4 Market Size, By End-Use, 2019-2026 (USD Million)
8.5.8 Argentina
8.5.8.1 Market Size, By Product, 2019-2026 (USD Million)
8.5.8.2 Market Size, By Gas, 2019-2026 (USD Million)
8.5.8.3 Market Size, By Application, 2019-2026 (USD Million)
8.5.8.4 Market Size, By End-Use, 2019-2026 (USD Million)
8.6 MEA
8.6.1 Market Size, By Country, 2019-2026 (USD Million)
8.6.2 Market Size, By Product, 2019-2026 (USD Million)
8.6.3 Market Size, By Gas, 2019-2026 (USD Million)
8.6.4 Market Size, By Application, 2019-2026 (USD Million)
8.6.5 Market Size, By End-Use, 2019-2026 (USD Million)
8.6.6 Saudi Arabia
8.6.6.1 Market Size, By Product, 2019-2026 (USD Million)
8.6.6.2 Market Size, By Gas, 2019-2026 (USD Million)
8.6.6.3 Market Size, By Application, 2019-2026 (USD Million)
8.6.6.4 Market Size, By End-Use, 2019-2026 (USD Million)
8.6.7 UAE
8.6.7.1 Market Size, By Product, 2019-2026 (USD Million)
8.6.7.2 Market Size, By Gas, 2019-2026 (USD Million)
8.6.7.3 Market Size, By Application, 2019-2026 (USD Million)
8.6.7.4 Market Size, By End-Use, 2019-2026 (USD Million)
8.6.8 South Africa
8.6.8.1 Market Size, By Product, 2019-2026 (USD Million)
8.6.8.2 Market Size, By Gas, 2019-2026 (USD Million)
8.6.8.3 Market Size, By Application, 2019-2026 (USD Million)
8.6.8.4 Market Size, By End-Use, 2019-2026 (USD Million)
Chapter 9 Company Landscape
9.1 Competitive Analysis, 2020
9.2 Chart Industries
9.2.1 Company Overview
9.2.2 Financial Analysis
9.2.3 Strategic Positioning
9.2.4 Info Graphic Analysis
9.3 Herose GmbH
9.3.1 Company Overview
9.3.2 Financial Analysis
9.3.3 Strategic Positioning
9.3.4 Info Graphic Analysis
9.4 Parker Hannifin
9.4.1 Company Overview
9.4.2 Financial Analysis
9.4.3 Strategic Positioning
9.4.4 Info Graphic Analysis
9.5 Linde Group
9.5.1 Company Overview
9.5.2 Financial Analysis
9.5.3 Strategic Positioning
9.5.4 Info Graphic Analysis
9.6 Flowserve Corporation
9.6.1 Company Overview
9.6.2 Financial Analysis
9.6.3 Strategic Positioning
9.6.4 Info Graphic Analysis
9.7 Emerson
9.7.1 Company Overview
9.7.2 Financial Analysis
9.7.3 Strategic Positioning
9.7.4 Info Graphic Analysis
9.8 Air Products
9.8.1 Company Overview
9.8.2 Financial Analysis
9.8.3 Strategic Positioning
9.8.4 Info Graphic Analysis
9.9 INOXCVA
7.9.1 Company Overview
9.9.2 Financial Analysis
9.9.3 Strategic Positioning
9.9.4 Info Graphic Analysis
9.10 Taylor Wharton
9.10.1 Company Overview
9.10.2 Financial Analysis
9.10.3 Strategic Positioning
9.10.4 Info Graphic Analysis
9.11 Cryofab
9.11.1 Company Overview
9.11.2 Financial Analysis
9.11.3 Strategic Positioning
9.11.4 Info Graphic Analysis
9.12 Wessington
9.12.1 Company Overview
9.12.2 Financial Analysis
9.12.3 Strategic Positioning
9.12.4 Info Graphic Analysis
9.13 ACME
9.13.1 Company Overview
9.13.2 Financial Analysis
9.13.3 Strategic Positioning
9.13.4 Info Graphic Analysis
9.14 Cryostar
9.14.1 Company Overview
9.14.2 Financial Analysis
9.14.3 Strategic Positioning
9.14.4 Info Graphic Analysis
9.15 Cryoquip
9.15.1 Company Overview
9.15.2 Financial Analysis
9.15.3 Strategic Positioning
9.15.4 Info Graphic Analysis
9.16 Cryogenic Systems Equipment, Inc.
9.16.1 Company Overview
9.16.2 Financial Analysis
9.16.3 Strategic Positioning
9.16.4 Info Graphic Analysis
9.17 Other Companies
9.17.1 Company Overview
9.17.2 Financial Analysis
9.17.3 Strategic Positioning
9.17.4 Info Graphic Analysis
The Global Cryogenic Equipment Market has been studied from the year 2019 till 2026. However, the CAGR provided in the report is from the year 2021 to 2026. The research methodology involved three stages: Desk research, Primary research, and Analysis & Output from the entire research process.

The desk research involved a robust background study which meant referring to paid and unpaid databases to understand the market dynamics; mapping contracts from press releases; identifying the key players in the market, studying their product portfolio, competition level, annual reports/SEC filings & investor presentations; and learning the demand and supply-side analysis for the Cryogenic Equipment Market.

The primary research activity included telephonic conversations with more than 50 tier 1 industry consultants, distributors, and end-use product manufacturers.

Finally, based on the above thorough research process, an in-depth analysis was carried out considering the following aspects: market attractiveness, current & future market trends, market share analysis, SWOT analysis of the company and customer analytics.

Frequently Asked Questions

This FREE sample includes market data points, ranging from trend analyses to market estimates & forecasts. See for yourself.
Or view our licence options:
Tailor made solutions just for you
80% of our clients seek made-to-order reports. How do you want us to tailor yours?
OUR CLIENTS


