This report was recently updated on August 18 2025 with the latest and most recent
market numbers
Global Digital Soil Monitoring Market Size, Trends & Analysis - Forecasts to 2026 By Technology (Software, Hardware), By Application (Moisture, Salinity, Temperature), By End-Use (Agriculture, Non-Agriculture), By System (Sensing & Imagery, Ground-Based Sensing, Robotic & Telematics), By Region (North America, Asia Pacific, Europe, Latin America, Middle East & Africa); End-User Landscape, Company Market Share Analysis, and Competitor Analysis
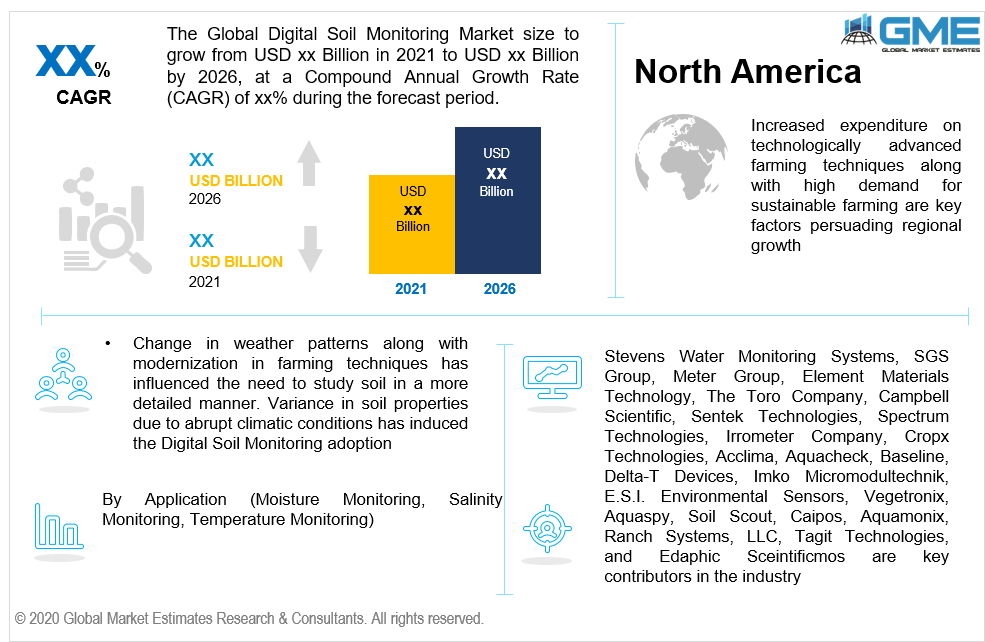
Increasing government efforts to encourage sustainable farming practices, preserve soil quality, and thereby improving farmland efficiency has promoted the Digital Soil Monitoring Market growth. The rising population has put pressure on the agriculture industry to increase productivity which may, in turn, instigate the advanced technologies adoption for optimum farm utilization.
Change in weather patterns along with modernization in farming techniques has influenced the need to study soil in a more detailed manner. Variance in soil properties due to abrupt climatic conditions has induced the Digital Soil Monitoring market growth. Critical factors such as over utilization and under utilization of land resources may result in more sustainable farming practices such as moisture check, salinity check, and temperature check. These technological advancements are helping farmers in various aspects such as optimum water usage depending on the nature of soil, crop, and weather. With the help of this sensing feature, it became easier for farmers to detect and limit resource use as per the farming requirement.
Digital soil monitoring is also helping in limiting the over-irrigation which in turn saves crops from diseases and predicting any early disease on the farm. Positive economic factors such as low-cost technology, limited electricity use, and saving water will proliferate the digital soil monitoring market growth.
The industry also has high penetration in non-agricultural sectors such as golf courses and stadiums. These sports grounds are vast and need consistent checking due to heavy usage. Increasing sports trends on a commercial basis as well as recreational activity will promote the deployment of Digital Soil Monitoring Systems in the sports venue sector.
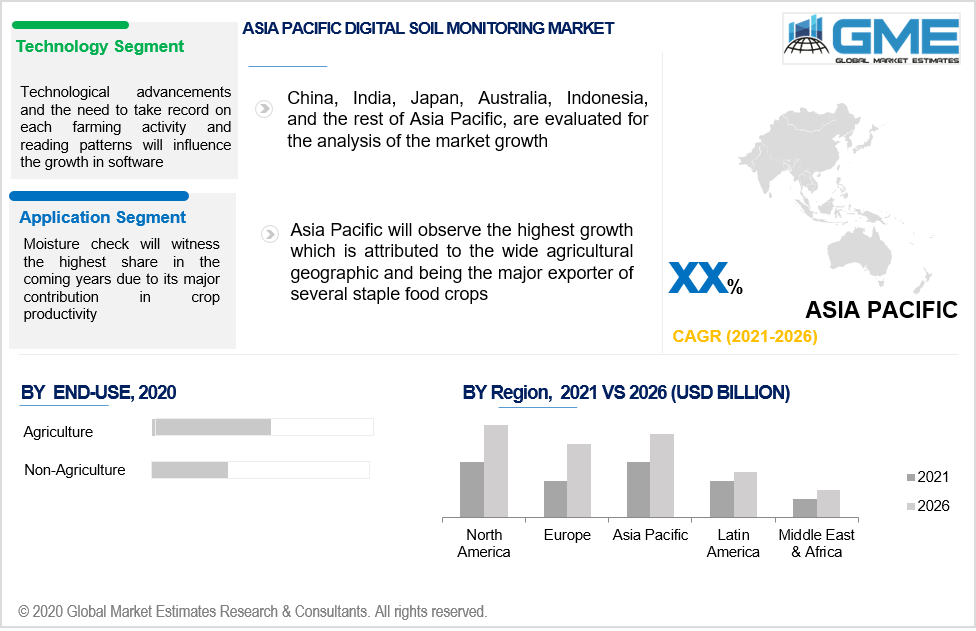
The technology segment is bifurcated into software and hardware systems. The software segment is expected to witness the highest gains in the coming years. Technological advancements and the need to make a record of each farming activity and reading patterns will influence the growth in this segment. Softwares are economical solutions and also have a predictive analysis which makes it easier for a user to make a decision.
The hardware systems consist of equipment of various sizes depending on the need and usage. These equipments are placed near the farmland to check various factors which may affect the productivity. As of now, hardware accounts for the largest share in the technology segment.
Observing moisture, salinity, and temperature are major applications in the industry. The change in farming techniques due to consistently fluctuating weather conditions has put pressure on farmers to decide on the crop selection, irrigation method, water requirement, and fertilizers selection. These DSM systems are making it easier for farmers to make these critical decisions and thereby increasing land fertility and crop production.
Moisture check will witness the highest share in the coming years due to its major contribution to crop productivity. Various technologically advanced software and hardware can be deployed to check the farms’ moisture resistance and water needs. Temperature check will observe significant growth during the forecast period due to its increasing use in regions with high climate fluctuation.
Digital Soil Monitoring has wide usage in agriculture and non-agriculture sectors. The agriculture sector is limited to farms. However, the non-agriculture includes golf courses, outdoor stadiums, nurseries, and other lands for recreational purposes. The agriculture sector holds the largest industry share due to its size and critical need to increase land productivity. The non-agriculture sector will witness the highest gains in the coming years. Increasing demand from nurseries and golf courses will induce the demand. Trends for recreational activities or leisure gardening will also promote product penetration.
Sensing & imagery, ground-based sensing, and robotics & telematics are major systems used in the industry. The ground-based sensing led the market share and is expected to maintain the dominance in the coming years. The need to adopt intelligent technology which promotes sustainable farming and increasing farm productivity has encouraged the need for ground-based sensing equipment and software among farmers. The ground-based sensing systems help in observing various factors including but not limited to moisture, humidity, and temperature. With the help of these parameters, users can decide by comparing suggested options from mobile apps.
North America Digital Soil Monitoring Market will lead the regional share and is expected to maintain the dominance during the forecast period. Increased expenditure on technologically advanced farming techniques along with high demand for sustainable farming are key factors persuading regional growth. Moreover, the presence of major industry players concentrated in the U.S. will impact the overall system adoption.
Asia Pacific will observe the highest growth which is attributed to the wide agricultural geographics and being the major exporter of several staple food crops. China, India, Malaysia, Japan and Indonesia are major contributing countries due to their agriculture capacities.
Middle East & Africa industrial growth will be highly influenced due to limited resource factors and critical climatic conditions. African countries need consistent Digital Soil Monitoring to utilize the resources in a limiting manner. Erosion, infertility, and limited water reserves are major factors in this region.
Stevens Water Monitoring Systems, SGS Group, Meter Group, Element Materials Technology, The Toro Company, Campbell Scientific, Sentek Technologies, Spectrum Technologies, Irrometer Company, Cropx Technologies, Acclima, Aquacheck, Baseline, Delta-T Devices, Imko Micromodultechnik, E.S.I. Environmental Sensors, Vegetronix, Aquaspy, Soil Scout, Caipos, Aquamonix, Ranch Systems, LLC, Tagit Technologies, and Edaphic Sceintificmos are key contributors in the industry.
Please note: This is not an exhaustive list of companies profiled in the report.
Chapter 1 Methodology
1.1 Market scope & definitions
1.2 Estimates & forecast calculation
1.3 Historical data overview and validation
1.4 Data sources
1.4.1 Secondary
1.4.2 Primary
Chapter 2 Report Outlook
2.1 Digital soil monitoring industry overview, 2016-2026
2.1.1 Industry overview
2.1.2 Technology overview
2.1.3 Application overview
2.1.4 End-Use overview
2.1.5 System overview
2.1.6 Regional overview
Chapter 3 Digital Soil Monitoring Market Trends
3.1 Market segmentation
3.2 Industry background, 2016-2026
3.3 Market key trends
3.3.1 Positive trends
3.3.2 Industry challenges
3.4 Prospective growth scenario
3.5 COVID-19 influence over industry growth
3.6 Porter’s analysis
3.7 PESTEL analysis
3.8 Value chain & supply chain analysis
3.9 Regulatory framework
3.9.1 North America
3.9.2 Europe
3.9.3 APAC
3.9.4 LATAM
3.9.5 MEA
3.10 Technology overview
3.10.1 Hardware
3.10.2 Software
3.11 Market share analysis, 2020
3.11.1 Company positioning overview, 2020
Chapter 4 Digital Soil Monitoring Market, By Technology
4.1 Technology Outlook
4.2 Software
4.2.1 Market size, by region, 2016-2026 (USD Million)
4.3 Hardware
4.3.1 Market size, by region, 2016-2026 (USD Million)
Chapter 5 Digital Soil Monitoring Market, By Application
5.1 Application Outlook
5.2 Moisture
5.2.1 Market size, by region, 2016-2026 (USD Million)
5.3 Salinity
5.3.1 Market size, by region, 2016-2026 (USD Million)
5.4 Temperature
5.4.1 Market size, by region, 2016-2026 (USD Million)
5.5 Others
5.5.1 Market size, by region, 2016-2026 (USD Million)
Chapter 6 Digital Soil Monitoring Market, By End-Use
6.1 End-Use Outlook
6.2 Agriculture
6.2.1 Market size, by region, 2016-2026 (USD Million)
6.3 Non-agriculture
6.3.1 Market size, by region, 2016-2026 (USD Million)
Chapter 7 Digital Soil Monitoring Market, By System
7.1 System Outlook
7.2 Sensing & imagery
7.2.1 Market size, by region, 2016-2026 (USD Million)
7.3 Ground based sensing
7.3.1 Market size, by region, 2016-2026 (USD Million)
7.4 Robotic & telematics
7.4.1 Market size, by region, 2016-2026 (USD Million)
Chapter 8 Digital Soil Monitoring Market, By Region
8.1 Regional outlook
8.2 North America
8.2.1 Market size, by country 2016-2026 (USD Million)
8.2.2 Market size, by technology, 2016-2026 (USD Million)
8.2.3 Market size, by application, 2016-2026 (USD Million)
8.2.4 Market size, by end-use, 2016-2026 (USD Million)
8.2.5 Market size, by system, 2016-2026 (USD Million)
8.2.6 U.S.
8.2.6.1 Market size, by technology, 2016-2026 (USD Million)
8.2.6.2 Market size, by application, 2016-2026 (USD Million)
8.2.6.3 Market size, by end-use, 2016-2026 (USD Million)
8.2.6.4 Market size, by system, 2016-2026 (USD Million)
8.2.7 Canada
8.2.7.1 Market size, by technology, 2016-2026 (USD Million)
8.2.7.2 Market size, by application, 2016-2026 (USD Million)
8.2.7.3 Market size, by end-use, 2016-2026 (USD Million)
8.2.7.4 Market size, by system, 2016-2026 (USD Million)
8.3 Europe
8.3.1 Market size, by country 2016-2026 (USD Million)
8.3.2 Market size, by technology, 2016-2026 (USD Million)
8.3.3 Market size, by application, 2016-2026 (USD Million)
8.3.4 Market size, by end-use, 2016-2026 (USD Million)
8.3.5 Market size, by system, 2016-2026 (USD Million)
8.3.6 Germany
8.2.6.1 Market size, by technology, 2016-2026 (USD Million)
8.2.6.2 Market size, by application, 2016-2026 (USD Million)
8.2.6.3 Market size, by end-use, 2016-2026 (USD Million)
8.2.6.4 Market size, by system, 2016-2026 (USD Million)
8.3.7 UK
8.3.7.1 Market size, by technology, 2016-2026 (USD Million)
8.3.7.2 Market size, by application, 2016-2026 (USD Million)
8.3.7.3 Market size, by end-use, 2016-2026 (USD Million)
8.3.7.4 Market size, by system, 2016-2026 (USD Million)
8.3.8 France
8.3.8.1 Market size, by technology, 2016-2026 (USD Million)
8.3.8.2 Market size, by application, 2016-2026 (USD Million)
8.3.8.3 Market size, by end-use, 2016-2026 (USD Million)
8.3.8.4 Market size, by system, 2016-2026 (USD Million)
8.3.9 Italy
8.3.9.1 Market size, by technology, 2016-2026 (USD Million)
8.3.9.2 Market size, by application, 2016-2026 (USD Million)
8.3.9.3 Market size, by end-use, 2016-2026 (USD Million)
8.3.9.4 Market size, by system, 2016-2026 (USD Million)
8.3.10 Spain
8.3.10.1 Market size, by technology, 2016-2026 (USD Million)
8.3.10.2 Market size, by application, 2016-2026 (USD Million)
8.3.10.3 Market size, by end-use, 2016-2026 (USD Million)
8.3.10.4 Market size, by system, 2016-2026 (USD Million)
8.3.11 Russia
8.3.11.1 Market size, by technology, 2016-2026 (USD Million)
8.3.11.2 Market size, by application, 2016-2026 (USD Million)
8.3.11.3 Market size, by end-use, 2016-2026 (USD Million)
8.3.11.4 Market size, by system, 2016-2026 (USD Million)
8.4 Asia Pacific
8.4.1 Market size, by country 2016-2026 (USD Million)
8.4.2 Market size, by technology, 2016-2026 (USD Million)
8.4.3 Market size, by application, 2016-2026 (USD Million)
8.4.4 Market size, by end-use, 2016-2026 (USD Million)
8.4.5 Market size, by system, 2016-2026 (USD Million)
8.4.6 China
8.4.6.1 Market size, by technology, 2016-2026 (USD Million)
8.4.6.2 Market size, by application, 2016-2026 (USD Million)
8.4.6.3 Market size, by end-use, 2016-2026 (USD Million)
8.4.6.4 Market size, by system, 2016-2026 (USD Million)
8.4.7 India
8.4.7.1 Market size, by technology, 2016-2026 (USD Million)
8.4.7.2 Market size, by application, 2016-2026 (USD Million)
8.4.7.3 Market size, by end-use, 2016-2026 (USD Million)
8.4.7.4 Market size, by system, 2016-2026 (USD Million)
8.4.8 Japan
8.4.8.1 Market size, by technology, 2016-2026 (USD Million)
8.4.8.2 Market size, by application, 2016-2026 (USD Million)
8.4.8.3 Market size, by end-use, 2016-2026 (USD Million)
8.4.8.4 Market size, by system, 2016-2026 (USD Million)
8.4.9 Australia
8.4.9.1 Market size, by technology, 2016-2026 (USD Million)
8.4.9.2 Market size, by application, 2016-2026 (USD Million)
8.4.9.3 Market size, by end-use, 2016-2026 (USD Million)
8.4.9.4 Market size, by system, 2016-2026 (USD Million)
8.4.10 South Korea
8.4.10.1 Market size, by technology, 2016-2026 (USD Million)
8.4.10.2 Market size, by application, 2016-2026 (USD Million)
8.4.10.3 Market size, by end-use, 2016-2026 (USD Million)
8.4.10.4 Market size, by system, 2016-2026 (USD Million)
8.5 Latin America
8.5.1 Market size, by country 2016-2026 (USD Million)
8.5.2 Market size, by technology, 2016-2026 (USD Million)
8.5.3 Market size, by application, 2016-2026 (USD Million)
8.5.4 Market size, by end-use, 2016-2026 (USD Million)
8.5.5 Market size, by system, 2016-2026 (USD Million)
8.5.6 Brazil
8.5.6.1 Market size, by technology, 2016-2026 (USD Million)
8.5.6.2 Market size, by application, 2016-2026 (USD Million)
8.5.6.3 Market size, by end-use, 2016-2026 (USD Million)
8.5.6.4 Market size, by system, 2016-2026 (USD Million)
8.5.7 Mexico
8.5.7.1 Market size, by technology, 2016-2026 (USD Million)
8.5.7.2 Market size, by application, 2016-2026 (USD Million)
8.5.7.3 Market size, by end-use, 2016-2026 (USD Million)
8.5.7.4 Market size, by system, 2016-2026 (USD Million)
8.5.8 Argentina
8.5.8.1 Market size, by technology, 2016-2026 (USD Million)
8.5.8.2 Market size, by application, 2016-2026 (USD Million)
8.5.8.3 Market size, by end-use, 2016-2026 (USD Million)
8.5.8.4 Market size, by system, 2016-2026 (USD Million)
8.6 MEA
8.6.1 Market size, by country 2016-2026 (USD Million)
8.6.2 Market size, by technology, 2016-2026 (USD Million)
8.6.3 Market size, by application, 2016-2026 (USD Million)
8.6.4 Market size, by end-use, 2016-2026 (USD Million)
8.6.5 Market size, by system, 2016-2026 (USD Million)
8.6.6 Saudi Arabia
8.6.6.1 Market size, by technology, 2016-2026 (USD Million)
8.6.6.2 Market size, by application, 2016-2026 (USD Million)
8.6.6.3 Market size, by end-use, 2016-2026 (USD Million)
8.6.6.4 Market size, by system, 2016-2026 (USD Million)
8.6.7 UAE
8.6.7.1 Market size, by technology, 2016-2026 (USD Million)
8.6.7.2 Market size, by application, 2016-2026 (USD Million)
8.6.7.3 Market size, by end-use, 2016-2026 (USD Million)
8.6.7.4 Market size, by system, 2016-2026 (USD Million)
8.6.8 South Africa
8.6.8.1 Market size, by technology, 2016-2026 (USD Million)
8.6.8.2 Market size, by application, 2016-2026 (USD Million)
8.6.8.3 Market size, by end-use, 2016-2026 (USD Million)
8.6.8.4 Market size, by system, 2016-2026 (USD Million)
Chapter 9 Company Landscape
9.1 Competitive analysis, 2020
9.2 Stevens Water Monitoring Systems
9.2.1 Company overview
9.2.2 Financial analysis
9.2.3 Strategic positioning
9.2.4 Info graphic analysis
9.3 SGS Group
9.3.1 Company overview
9.3.2 Financial analysis
9.3.3 Strategic positioning
9.3.4 Info graphic analysis
9.4 Meter Group
9.4.1 Company overview
9.4.2 Financial analysis
9.4.3 Strategic positioning
9.4.4 Info graphic analysis
9.5 Element Materials Technology
9.5.1 Company overview
9.5.2 Financial analysis
9.5.3 Strategic positioning
9.5.4 Info graphic analysis
9.6 The Toro Company
9.6.1 Company overview
9.6.2 Financial analysis
9.6.3 Strategic positioning
9.6.4 Info graphic analysis
9.7 Campbell Scientific
9.7.1 Company overview
9.7.2 Financial analysis
9.7.3 Strategic positioning
9.7.4 Info graphic analysis
9.8 Sentek Technologies
9.8.1 Company overview
9.8.2 Financial analysis
9.8.3 Strategic positioning
9.8.4 Info graphic analysis
9.9 Spectrum Technologies
9.9.1 Company overview
9.9.2 Financial analysis
9.9.3 Strategic positioning
9.9.4 Info graphic analysis
9.10 Irrometer Company
9.10.1 Company overview
9.10.2 Financial analysis
9.10.3 Strategic positioning
9.10.4 Info graphic analysis
9.11 Cropx Technologies
9.11.1 Company overview
9.11.2 Financial analysis
9.11.3 Strategic positioning
9.11.4 Info graphic analysis
9.12 Acclima
9.12.1 Company overview
9.12.2 Financial analysis
9.12.3 Strategic positioning
9.12.4 Info graphic analysis
9.13 Aquacheck
9.13.1 Company overview
9.13.2 Financial analysis
9.13.3 Strategic positioning
9.13.4 Info graphic analysis
9.14 Baseline
9.14.1 Company overview
9.14.2 Financial analysis
9.14.3 Strategic positioning
9.14.4 Info graphic analysis
9.15 Delta-T Devices
9.15.1 Company overview
9.15.2 Financial analysis
9.15.3 Strategic positioning
9.15.4 Info graphic analysis
9.16 Imko Micromodultechnik
9.16.1 Company overview
9.16.2 Financial analysis
9.16.3 Strategic positioning
9.16.4 Info graphic analysis
9.17 E.S.I. Environmental Sensors
9.17.1 Company overview
9.17.2 Financial analysis
9.17.3 Strategic positioning
9.17.4 Info graphic analysis
9.18 Vegetronix
9.18.1 Company overview
9.18.2 Financial analysis
9.18.3 Strategic positioning
9.18.4 Info graphic analysis
9.19 Aquaspy
9.19.1 Company overview
9.19.2 Financial analysis
9.19.3 Strategic positioning
9.19.4 Info graphic analysis
9.20 Soil Scout
9.20.1 Company overview
9.20.2 Financial analysis
9.20.3 Strategic positioning
9.20.4 Info graphic analysis
9.21 Caipos
9.21.1 Company overview
9.21.2 Financial analysis
9.21.3 Strategic positioning
9.21.4 Info graphic analysis
9.22 Aquamonix
9.22.1 Company overview
9.22.2 Financial analysis
9.22.3 Strategic positioning
9.22.4 Info graphic analysis
9.23 Ranch Systems, LLC
9.23.1 Company overview
9.23.2 Financial analysis
9.23.3 Strategic positioning
9.23.4 Info graphic analysis
9.24 Tagit Technologies
9.24.1 Company overview
9.24.2 Financial analysis
9.24.3 Strategic positioning
9.24.4 Info graphic analysis
9.25 Edaphic Sceintificmos
9.25.1 Company overview
9.25.2 Financial analysis
9.25.3 Strategic positioning
9.25.4 Info graphic analysis
The Global Digital Soil Monitoring Market has been studied from the year 2019 till 2026. However, the CAGR provided in the report is from the year 2021 to 2026. The research methodology involved three stages: Desk research, Primary research, and Analysis & Output from the entire research process.

The desk research involved a robust background study which meant referring to paid and unpaid databases to understand the market dynamics; mapping contracts from press releases; identifying the key players in the market, studying their product portfolio, competition level, annual reports/SEC filings & investor presentations; and learning the demand and supply-side analysis for the Digital Soil Monitoring Market.

The primary research activity included telephonic conversations with more than 50 tier 1 industry consultants, distributors, and end-use product manufacturers.

Finally, based on the above thorough research process, an in-depth analysis was carried out considering the following aspects: market attractiveness, current & future market trends, market share analysis, SWOT analysis of the company and customer analytics.


This FREE sample includes market data points, ranging from trend analyses to market estimates & forecasts. See for yourself.
Or view our licence options:
Tailor made solutions just for you
80% of our clients seek made-to-order reports. How do you want us to tailor yours?
OUR CLIENTS


