This report was recently updated on August 27 2025 with the latest and most recent
market numbers
Global E-vehicle Market for Last Mile Delivery Size, Trends & Analysis - Forecasts to 2028 By Delivery Type (Courier and Package Delivery Services, Food Delivery Services, and Retail Delivery), By Vehicle Type (Light-duty and Medium & Heavy-duty), By Business Type (Business-to-consumer (B2C) and Business-to-business (B2B)), and By Region (North America, Asia Pacific, Central and South America, Europe, and Middle East and Africa), Competitive Landscape, Company Market Share Analysis, and End User Analysis
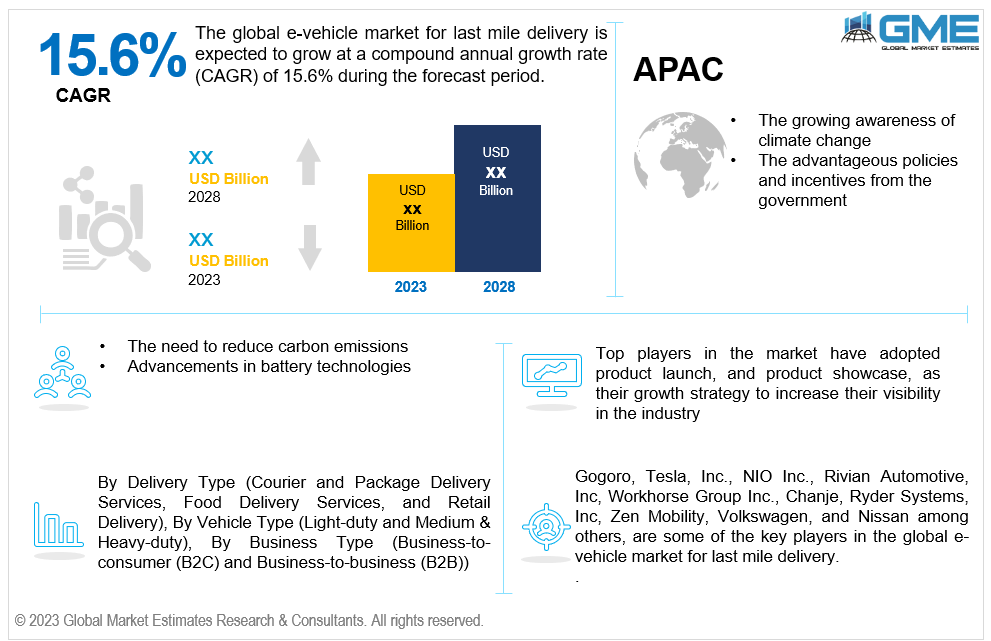
The global e-vehicle market for last mile delivery is estimated to exhibit a CAGR of 15.6% from 2023 to 2028.
The primary drivers of market growth are the growing awareness of climate change and the advantageous policies and incentives from the government. Governments frequently offer financial incentives to promote using electric cars for last-mile deliveries. Tax credits, rebates, grants, and subsidies are a few examples of these incentives. Due to these financial advantages, companies find e-vehicles more appealing since they lower the upfront cost of ownership. Governments in many regions provide e-vehicle owners with reduced or free registration costs, reduced tolls, and discounted power prices. This can lower the running costs of e-vehicles used for last-mile deliveries considerably, increasing their long-term cost-effectiveness. For instance, the Advanced Technology Vehicles Manufacturing Loan Program (2020) of the U.S. Department of Energy (DOE) provides direct loans to qualified manufacturers for up to 30% of the cost of retooling, growing, or setting up manufacturing facilities in the United States that produce qualified advanced technology vehicles.
The need to reduce carbon emissions and advancements in battery technologies are expected to support the market growth throughout the forecast period. There is growing pressure on enterprises to lower their carbon footprint as concerns about environmental sustainability and climate change continue to mount. An essential component in the supply chain, last-mile deliveries sometimes include a large number of greenhouse gas-emitting vehicles. Companies can drastically cut their carbon emissions and help create a cleaner, more sustainable environment by switching to electric vehicles (EVs). Moreover, electric cars use less energy than their counterparts with internal combustion engines. Due to this efficiency, when the power needed to charge the cars comes from cleaner and renewable sources, there is a reduction in energy consumption and carbon emissions. For instance, according to research from the European Environment Agency, transport accounted for about 25% of the EU's total CO2 emissions in 2019, with road transport accounting for 71.7% of those emissions.
The expansion of charging infrastructure and the integration of advanced technology features, such as telematics, route optimization, and vehicle tracking systems are propelling the market growth. A robust charging infrastructure enables companies to get the most out of their electric delivery cars. Without worrying about running out of power, e-vehicles can be operated for longer shifts or periods, increasing operating efficiency and decreasing downtime. Moreover, infrastructure for charging can be customized to meet the demands of certain companies. Companies can utilize public charging networks or construct charging stations at their depots, which provides flexibility and scalability for last-mile delivery operations.
Investment in e-vehicles for last-mile delivery has surged as environmental sustainability and lowering carbon emissions become more pressing considerations. Governments and customers are pushing for greener and more sustainable transportation options, which opens up opportunities for the global e-vehicle industry for last-mile delivery. Moreover, e-vehicle manufacturers are developing a wide range of models, including e-cargo bikes, electric vans, and compact electric trucks, offering last-mile delivery companies various options based on their specific needs.
However, the limited range of e-vehicles and longer charging time hinder market growth.
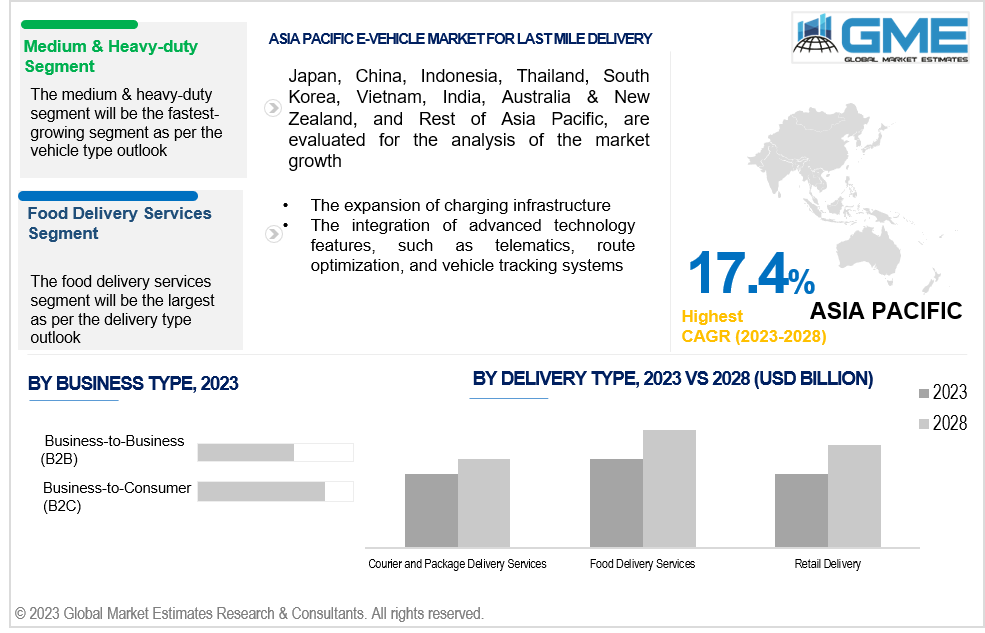
The food delivery services segment is expected to hold the largest share of the market. Food delivery services sometimes require multiple daily deliveries and frequent trips to deliver clients' requests. Since electric vehicles have less environmental effects and lower running costs than typical gas-powered vehicles, they are a good fit for this kind of operation. Due to their shorter driving lengths and ability to electrify the delivery fleet, e-vehicles are well suited for the densely populated and metropolitan regions where many food delivery companies are predominantly located. E-vehicles can deliver goods more quickly and efficiently via crowded metropolitan streets.
The retail delivery segment is expected to be the fastest-growing segment in the market from 2023-2028. Retailers of all sizes, including niche shops, smaller companies, and major chains, are included in the retail delivery segment. Due to the uniqueness of the retail industry, a wide range of companies are looking at e-vehicle solutions to suit their delivery requirements. Moreover, the need for last-mile delivery services has grown due to the rapid growth of e-commerce. Efficient last-mile delivery solutions are becoming more and more necessary as customers purchase more and more online and retailers face pressure to offer faster and more convenient delivery choices.
The light-duty segment is expected to hold the largest share of the market. In cities, last-mile deliveries are best served by light-duty electric vehicles like e-bikes, compact electric automobiles, and scooters. Short-distance deliveries in densely populated city centers are made more efficient by their ability to maneuver through small streets and heavy traffic. Moreover, light-duty electric vehicles now have better range, performance, and charging infrastructure due to advancements in battery technology and vehicle design, which makes them more reliable and useful for last-mile deliveries.
The medium & heavy-duty segment is anticipated to be the fastest-growing segment in the market from 2023-2028. Medium & heavy-duty electric vehicles can transport greater payloads than light-duty vehicles. As a result, they can move more cargo over longer distances, making them a desirable option for deliveries that go beyond the literal last mile.
The business-to-consumer (B2C) segment is expected to hold the largest share of the market. B2C deliveries entail distributing goods to a large number of distinct residences and locations, which can be scattered over suburban and metropolitan regions. Electric vehicles are ideally adapted to handle these various delivery locations.
The business-to-business (B2B) segment is anticipated to be the fastest-growing segment in the market from 2023-2028. Compared to B2C deliveries, B2B deliveries usually include larger and heavier items. For B2B logistics, electric trucks with greater payload capabilities are crucial as they can handle these higher quantities more effectively.
North America is expected to be the largest region in the global market. The number of packages and commodities being delivered to consumers' doorsteps has increased dramatically due to the phenomenal expansion witnessed by the North American e-commerce industry. There has never been a greater need for last-mile delivery services. For instance, a Digital Commerce 360 review of U.S. Department of Commerce data indicates that U.S. e-commerce sales reached USD 1.03 trillion in 2022. For the first time, e-commerce revenue has exceeded USD 1 trillion. It surpassed the USD 960.44 billion of 2021 by a significant amount.
Asia Pacific is anticipated to witness rapid growth during the forecast period. The adoption of electric cars is being encouraged by several governments in the Asia Pacific region through a range of policies and incentives, including expenditures in infrastructure for charging. Public charging stations are frequently established as part of government-backed programs, which facilitate the integration of electric cars into last-mile delivery fleets for enterprises. For instance, the China Electric Vehicle Charging Infrastructure Promotion Alliance, or EVCIPA, stated in September 2023 that over 61,000 new public charging stations had been installed in the nation in August 2023.
Gogoro, Tesla, Inc., NIO Inc., Rivian Automotive, Inc, Workhorse Group Inc., Chanje, Ryder Systems, Inc, Zen Mobility, Volkswagen, and Nissan among others, are some of the key players operating in the global e-vehicle market for last mile delivery.
Please note: This is not an exhaustive list of companies profiled in the report.
In 2023, a memorandum of understanding (MoU) was signed by Gogoro Inc., a global technology leader in battery-swapping ecosystems that provide sustainable mobility solutions for cities, with Hindustan Petroleum Corporation Ltd. (HPCL), a significant Indian oil business with over 21,000 retail locations.
In 2023, Rivian Automotive, Inc. declared that other companies will be able to buy its specially created Rivian Commercial Van. By electrifying their delivery fleets with cutting-edge vehicles, companies globally will have additional opportunities to significantly reduce CO2 emissions.
1 STRATEGIC INSIGHTS ON NEW REVENUE POCKETS
1.1 Strategic Opportunity & Attractiveness Analysis
1.1.1 Hot Revenue Pockets
1.1.2 Market Attractiveness Score
1.1.3 Revenue Impacting Opportunity
1.1.4 High Growing Region/Country
1.1.5 Competitor Analysis
1.1.6 Consumer Analysis
1.2 Global Market Estimates' View
1.3 Strategic Insights across Business Functions
1.3.1 For Chief Executive Officers
1.3.2 For Chief Marketing Officers
1.3.3 For Chief Strategy Officers
1.4 Evaluate the Potential of your Existing Business Lines vs. New Lines to Enter Into
2 TECHNOLOGICAL TRENDS
2.1 Technological Adoption Rate
2.2 Current Trend Impact Analysis
2.3 Future Trend Impact Analysis
3 GLOBAL E-VEHICLE MARKET FOR LAST MILE DELIVERY OUTLOOK
3.1 Market Pyramid Analysis
3.1.1 Introduction
3.1.2 Adjacent Market Opportunities
3.1.3 Ancillary Market Opportunities
3.2 Demand Side Analysis
3.2.1 Market Drivers: Impact Analysis
3.2.2 Market Restraints: Impact Analysis
3.2.3 Market Opportunities: Impact Analysis
3.2.4 Market Challenges: Impact Analysis
3.3 Supply Side Analysis
3.3.1 Porter’s Five Forces Analysis
3.3.1.1 Threat of New Entrants
3.3.1.2 Threat of New Substitutes
3.3.1.3 Bargaining Power of Suppliers
3.3.1.4 Bargaining Power of Buyers
3.3.1.5 Intensity of Competitive Rivalry
3.3.2 SWOT Analysis; By Factor (Political & Legal, Economic, and Technological)
3.3.2.1 Political Landscape
3.3.2.2 Economic Landscape
3.3.2.3 Social Landscape
3.3.2.4 Technology Landscape
3.3.3 Value Chain Analysis
3.3.4 Trend Analysis
3.3.5 Gap Analysis
3.3.6 Cost Analysis
4 GLOBAL E-VEHICLE MARKET FOR LAST MILE DELIVERY, BY DELIVERY TYPE
4.1 Introduction
4.2 E-vehicle Market for Last Mile Delivery: Delivery Type Scope Key Takeaways
4.3 Revenue Growth Analysis, 2022 & 2028
4.4 Courier and Package Delivery Services
4.4.1 Courier and Package Delivery Services Market Estimates and Forecast, 2020-2028 (USD Million)
4.5 Food Delivery Services
4.5.1 Food Delivery Services Market Estimates and Forecast, 2020-2028 (USD Million)
4.6 Retail Delivery
4.6.1 Retail Delivery Market Estimates and Forecast, 2020-2028 (USD Million)
5 GLOBAL E-VEHICLE MARKET FOR LAST MILE DELIVERY, BY VEHICLE TYPE
5.1 Introduction
5.2 E-vehicle Market for Last Mile Delivery: Vehicle Type Scope Key Takeaways
5.3 Revenue Growth Analysis, 2022 & 2028
5.4 Light-duty
5.4.1 Light-duty Market Estimates and Forecast, 2020-2028 (USD Million)
5.5 Medium & Heavy-duty
5.5.1 Medium & Heavy-duty Market Estimates and Forecast, 2020-2028 (USD Million)
6 GLOBAL E-VEHICLE MARKET FOR LAST MILE DELIVERY, BY BUSINESS TYPE
6.1 Introduction
6.2 E-vehicle Market for Last Mile Delivery: Business Type Scope Key Takeaways
6.3 Revenue Growth Analysis, 2022 & 2028
6.4 Business-to-Consumer (B2C)
6.4.1 Business-to-Consumer (B2C) Market Estimates and Forecast, 2020-2028 (USD Million)
6.5 Business-to-Business (B2B)
6.5.1 Business-to-Business (B2B) Market Estimates and Forecast, 2020-2028 (USD Million)
7 GLOBAL E-VEHICLE MARKET FOR LAST MILE DELIVERY, BY REGION
7.1 Introduction
7.2 North America E-vehicle Market for Last Mile Delivery Estimates and Forecast, 2020-2028 (USD Million)
7.2.1 By Delivery Type
7.2.2 By Vehicle Type
7.2.3 By Business Type
7.2.4 By Country
7.2.4.1 U.S. E-vehicle Market for Last Mile Delivery Estimates and Forecast, 2020-2028 (USD Million)
7.2.4.1.1 By Delivery Type
7.2.4.1.2 By Vehicle Type
7.2.4.1.3 By Business Type
7.2.4.2 Canada E-vehicle Market for Last Mile Delivery Estimates and Forecast, 2020-2028 (USD Million)
7.2.4.2.1 By Delivery Type
7.2.4.2.2 By Vehicle Type
7.2.4.2.3 By Business Type
7.2.4.3 Mexico E-vehicle Market for Last Mile Delivery Estimates and Forecast, 2020-2028 (USD Million)
7.2.4.3.1 By Delivery Type
7.2.4.3.2 By Vehicle Type
7.2.4.3.3 By Business Type
7.3 Europe E-vehicle Market for Last Mile Delivery Estimates and Forecast, 2020-2028 (USD Million)
7.3.1 By Delivery Type
7.3.2 By Vehicle Type
7.3.3 By Business Type
7.3.4 By Country
7.3.4.1 Germany E-vehicle Market for Last Mile Delivery Estimates and Forecast, 2020-2028 (USD Million)
7.3.4.1.1 By Delivery Type
7.3.4.1.2 By Vehicle Type
7.3.4.1.3 By Business Type
7.3.4.2 U.K. E-vehicle Market for Last Mile Delivery Estimates and Forecast, 2020-2028 (USD Million)
7.3.4.2.1 By Delivery Type
7.3.4.2.2 By Vehicle Type
7.3.4.2.3 By Business Type
7.3.4.3 France E-vehicle Market for Last Mile Delivery Estimates and Forecast, 2020-2028 (USD Million)
7.3.4.3.1 By Delivery Type
7.3.4.3.2 By Vehicle Type
7.3.4.3.3 By Business Type
7.3.4.4 Italy E-vehicle Market for Last Mile Delivery Estimates and Forecast, 2020-2028 (USD Million)
7.3.4.4.1 By Delivery Type
7.3.4.4.2 By Vehicle Type
7.2.4.4.3 By Business Type
7.3.4.5 Spain E-vehicle Market for Last Mile Delivery Estimates and Forecast, 2020-2028 (USD Million)
7.3.4.5.1 By Delivery Type
7.3.4.5.2 By Vehicle Type
7.2.4.5.3 By Business Type
7.3.4.6 Netherlands E-vehicle Market for Last Mile Delivery Estimates and Forecast, 2020-2028 (USD Million)
7.3.4.6.1 By Delivery Type
7.3.4.6.2 By Vehicle Type
7.2.4.6.3 By Business Type
7.3.4.7 Rest of Europe E-vehicle Market for Last Mile Delivery Estimates and Forecast, 2020-2028 (USD Million)
7.3.4.7.1 By Delivery Type
7.3.4.7.2 By Vehicle Type
7.2.4.7.3 By Business Type
7.4 Asia Pacific E-vehicle Market for Last Mile Delivery Estimates and Forecast, 2020-2028 (USD Million)
7.4.1 By Delivery Type
7.4.2 By Vehicle Type
7.4.3 By Business Type
7.4.4 By Country
7.4.4.1 China E-vehicle Market for Last Mile Delivery Estimates and Forecast, 2020-2028 (USD Million)
7.4.4.1.1 By Delivery Type
7.4.4.1.2 By Vehicle Type
7.4.4.1.3 By Business Type
7.4.4.2 Japan E-vehicle Market for Last Mile Delivery Estimates and Forecast, 2020-2028 (USD Million)
7.4.4.2.1 By Delivery Type
7.4.4.2.2 By Vehicle Type
7.4.4.2.3 By Business Type
7.4.4.3 India E-vehicle Market for Last Mile Delivery Estimates and Forecast, 2020-2028 (USD Million)
7.4.4.3.1 By Delivery Type
7.4.4.3.2 By Vehicle Type
7.4.4.3.3 By Business Type
7.4.4.4 South Korea E-vehicle Market for Last Mile Delivery Estimates and Forecast, 2020-2028 (USD Million)
7.4.4.4.1 By Delivery Type
7.4.4.4.2 By Vehicle Type
7.4.4.4.3 By Business Type
7.4.4.5 Singapore E-vehicle Market for Last Mile Delivery Estimates and Forecast, 2020-2028 (USD Million)
7.4.4.5.1 By Delivery Type
7.4.4.5.2 By Vehicle Type
7.4.4.5.3 By Business Type
7.4.4.6 Malaysia E-vehicle Market for Last Mile Delivery Estimates and Forecast, 2020-2028 (USD Million)
7.4.4.6.1 By Delivery Type
7.4.4.6.2 By Vehicle Type
7.4.4.6.3 By Business Type
7.4.4.7 Thailand E-vehicle Market for Last Mile Delivery Estimates and Forecast, 2020-2028 (USD Million)
7.4.4.7.1 By Delivery Type
7.4.4.7.2 By Vehicle Type
7.4.4.7.3 By Business Type
7.4.4.8 Indonesia E-vehicle Market for Last Mile Delivery Estimates and Forecast, 2020-2028 (USD Million)
7.4.4.8.1 By Delivery Type
7.4.4.8.2 By Vehicle Type
7.4.4.8.3 By Business Type
7.4.4.9 Vietnam E-vehicle Market for Last Mile Delivery Estimates and Forecast, 2020-2028 (USD Million)
7.4.4.9.1 By Delivery Type
7.4.4.9.2 By Vehicle Type
7.4.4.9.3 By Business Type
7.4.4.10 Taiwan E-vehicle Market for Last Mile Delivery Estimates and Forecast, 2020-2028 (USD Million)
7.4.4.10.1 By Delivery Type
7.4.4.10.2 By Vehicle Type
7.4.4.10.3 By Business Type
7.4.4.11 Rest of Asia Pacific E-vehicle Market for Last Mile Delivery Estimates and Forecast, 2020-2028 (USD Million)
7.4.4.11.1 By Delivery Type
7.4.4.11.2 By Vehicle Type
7.4.4.11.3 By Business Type
7.5 Middle East and Africa E-vehicle Market for Last Mile Delivery Estimates and Forecast, 2020-2028 (USD Million)
7.5.1 By Delivery Type
7.5.2 By Vehicle Type
7.5.3 By Business Type
7.5.4 By Country
7.5.4.1 Saudi Arabia E-vehicle Market for Last Mile Delivery Estimates and Forecast, 2020-2028 (USD Million)
7.5.4.1.1 By Delivery Type
7.5.4.1.2 By Vehicle Type
7.5.4.1.3 By Business Type
7.5.4.2 U.A.E. E-vehicle Market for Last Mile Delivery Estimates and Forecast, 2020-2028 (USD Million)
7.5.4.2.1 By Delivery Type
7.5.4.2.2 By Vehicle Type
7.5.4.2.3 By Business Type
7.5.4.3 Israel E-vehicle Market for Last Mile Delivery Estimates and Forecast, 2020-2028 (USD Million)
7.5.4.3.1 By Delivery Type
7.5.4.3.2 By Vehicle Type
7.5.4.3.3 By Business Type
7.5.4.4 South Africa E-vehicle Market for Last Mile Delivery Estimates and Forecast, 2020-2028 (USD Million)
7.5.4.4.1 By Delivery Type
7.5.4.4.2 By Vehicle Type
7.5.4.4.3 By Business Type
7.5.4.5 Rest of Middle East and Africa E-vehicle Market for Last Mile Delivery Estimates and Forecast, 2020-2028 (USD Million)
7.5.4.5.1 By Delivery Type
7.5.4.5.2 By Vehicle Type
7.5.4.5.2 By Business Type
7.6 Central & South America E-vehicle Market for Last Mile Delivery Estimates and Forecast, 2020-2028 (USD Million)
7.6.1 By Delivery Type
7.6.2 By Vehicle Type
7.6.3 By Business Type
7.6.4 By Country
7.6.4.1 Brazil E-vehicle Market for Last Mile Delivery Estimates and Forecast, 2020-2028 (USD Million)
7.6.4.1.1 By Delivery Type
7.6.4.1.2 By Vehicle Type
7.6.4.1.3 By Business Type
7.6.4.2 Argentina Eaporative Air Cooler Market Estimates and Forecast, 2020-2028 (USD Million)
7.6.4.2.1 By Delivery Type
7.6.4.2.2 By Vehicle Type
7.6.4.2.3 By Business Type
7.6.4.3 Chile E-vehicle Market for Last Mile Delivery Estimates and Forecast, 2020-2028 (USD Million)
7.6.4.3.1 By Delivery Type
7.6.4.3.2 By Vehicle Type
7.6.4.3.3 By Business Type
7.6.4.4 Rest of Central & South America E-vehicle Market for Last Mile Delivery Estimates and Forecast, 2020-2028 (USD Million)
7.6.4.4.1 By Delivery Type
7.6.4.4.2 By Vehicle Type
7.6.4.4.3 By Business Type
8 COMPETITIVE LANDCAPE
8.1 Company Market Share Analysis
8.2 Four Quadrant Positioning Matrix
8.2.1 Market Leaders
8.2.2 Market Visionaries
8.2.3 Market Challengers
8.2.4 Niche Market Players
8.3 Vendor Landscape
8.3.1 North America
8.3.2 Europe
8.3.3 Asia Pacific
8.3.4 Rest of the World
8.4 Company Profiles
8.4.1 Gogoro
8.4.1.1 Business Description & Financial Analysis
8.4.1.2 SWOT Analysis
8.4.1.3 Products & Services Offered
8.4.1.4 Strategic Alliances between Business Partners
8.4.2 TESLA, INC.
8.4.2.1 Business Description & Financial Analysis
8.4.2.2 SWOT Analysis
8.4.2.3 Products & Services Offered
8.4.2.4 Strategic Alliances between Business Partners
8.4.3 NIO Inc.
8.4.3.1 Business Description & Financial Analysis
8.4.3.2 SWOT Analysis
8.4.3.3 Products & Services Offered
8.4.3.4 Strategic Alliances between Business Partners
8.4.4 Rivian Automotive, Inc
8.4.4.1 Business Description & Financial Analysis
8.4.4.2 SWOT Analysis
8.4.4.3 Products & Services Offered
8.4.4.4 Strategic Alliances between Business Partners
8.4.5 Workhorse Group Inc.
8.4.5.1 Business Description & Financial Analysis
8.4.5.2 SWOT Analysis
8.4.5.3 Products & Services Offered
8.4.5.4 Strategic Alliances between Business Partners
8.4.6 CHANJE
8.4.6.1 Business Description & Financial Analysis
8.4.6.2 SWOT Analysis
8.4.6.3 Products & Services Offered
8.4.6.4 Strategic Alliances between Business Partners
8.4.7 Ryder Systems, Inc.
8.4.7.1 Business Description & Financial Analysis
8.4.7.2 SWOT Analysis
8.4.7.3 Products & Services Offered
8.4.8.4 Strategic Alliances between Business Partners
8.4.8 Ryder Systems, Inc.
8.4.8.1 Business Description & Financial Analysis
8.4.8.2 SWOT Analysis
8.4.8.3 Products & Services Offered
8.4.8.4 Strategic Alliances between Business Partners
8.4.9 Zen Mobility
8.4.9.1 Business Description & Financial Analysis
8.4.9.2 SWOT Analysis
8.4.9.3 Products & Services Offered
8.4.9.4 Strategic Alliances between Business Partners
8.4.10 Volkswagen
8.4.10.1 Business Description & Financial Analysis
8.4.10.2 SWOT Analysis
8.4.10.3 Products & Services Offered
8.4.10.4 Strategic Alliances between Business Partners
8.4.11 Other Companies
8.4.11.1 Business Description & Financial Analysis
8.4.11.2 SWOT Analysis
8.4.11.3 Products & Services Offered
8.4.11.4 Strategic Alliances between Business Partners
9 RESEARCH METHODOLOGY
9.1 Market Introduction
9.1.1 Market Definition
9.1.2 Market Scope & Segmentation
9.2 Information Procurement
9.2.1 Secondary Research
9.2.1.1 Purchased Databases
9.2.1.2 GMEs Internal Data Repository
9.2.1.3 Secondary Resources & Third Party Perspectives
9.2.1.4 Company Information Sources
9.2.2 Primary Research
9.2.2.1 Various Types of Respondents for Primary Interviews
9.2.2.2 Number of Interviews Conducted throughout the Research Process
9.2.2.3 Primary Stakeholders
9.2.2.4 Discussion Guide for Primary Participants
9.2.3 Expert Panels
9.2.3.1 Expert Panels Across 30+ Industry
9.2.4 Paid Local Experts
9.2.4.1 Paid Local Experts Across 30+ Industry Across each Region
9.3 Market Estimation
9.3.1 Top-Down Approach
9.3.1.1 Macro-Economic Indicators Considered
9.3.1.2 Micro-Economic Indicators Considered
9.3.2 Bottom Up Approach
9.3.2.1 Company Share Analysis Approach
9.3.2.2 Estimation of Potential Product Sales
9.4 Data Triangulation
9.4.1 Data Collection
9.4.2 Time Series, Cross Sectional & Panel Data Analysis
9.4.3 Cluster Analysis
9.5 Analysis and Output
9.5.1 Inhouse AI Based Real Time Analytics Tool
9.5.2 Output From Desk & Primary Research
9.6 Research Assumptions & Limitations
9.7.1 Research Assumptions
9.7.2 Research Limitations
LIST OF TABLES
1 Global E-vehicle Market for Last Mile Delivery, By Delivery Type, 2020-2028 (USD Million)
2 Courier and Package Delivery Services Market, By Region, 2020-2028 (USD Million)
3 Food Delivery Services Market, By Region, 2020-2028 (USD Million)
4 Retail Delivery Market, By Region, 2020-2028 (USD Million)
5 Global E-vehicle Market for Last Mile Delivery, By Vehicle Type, 2020-2028 (USD Million)
6 Light-duty Market, By Region, 2020-2028 (USD Million)
7 Medium & Heavy-duty Market, By Region, 2020-2028 (USD Million)
8 Global E-vehicle Market for Last Mile Delivery, By Business Type, 2020-2028 (USD Million)
9 Business-to-Consumer (B2C) Market, By Region, 2020-2028 (USD Million)
10 Business-to-Business (B2B) Market, By Region, 2020-2028 (USD Million)
11 Marketplaces Market, By Region, 2020-2028 (USD Million)
12 Regional Analysis, 2020-2028 (USD Million)
13 North America E-vehicle Market for Last Mile Delivery, By Delivery Type, 2020-2028 (USD Million)
14 North America E-vehicle Market for Last Mile Delivery, By Vehicle Type, 2020-2028 (USD Million)
15 North America E-vehicle Market for Last Mile Delivery, By Business Type, 2020-2028 (USD Million)
16 North America E-vehicle Market for Last Mile Delivery, By Country, 2020-2028 (USD Million)
17 U.S E-vehicle Market for Last Mile Delivery, By Delivery Type, 2020-2028 (USD Million)
18 U.S E-vehicle Market for Last Mile Delivery, By Vehicle Type, 2020-2028 (USD Million)
19 U.S E-vehicle Market for Last Mile Delivery, By Business Type, 2020-2028 (USD Million)
20 Canada E-vehicle Market for Last Mile Delivery, By Delivery Type, 2020-2028 (USD Million)
21 Canada E-vehicle Market for Last Mile Delivery, By Vehicle Type, 2020-2028 (USD Million)
22 Canada E-vehicle Market for Last Mile Delivery, By Business Type, 2020-2028 (USD Million)
23 Mexico E-vehicle Market for Last Mile Delivery, By Delivery Type, 2020-2028 (USD Million)
24 Mexico E-vehicle Market for Last Mile Delivery, By Vehicle Type, 2020-2028 (USD Million)
25 Mexico E-vehicle Market for Last Mile Delivery, By Business Type, 2020-2028 (USD Million)
26 Europe E-vehicle Market for Last Mile Delivery, By Delivery Type, 2020-2028 (USD Million)
27 Europe E-vehicle Market for Last Mile Delivery, By Vehicle Type, 2020-2028 (USD Million)
28 Europe E-vehicle Market for Last Mile Delivery, By Business Type, 2020-2028 (USD Million)
29 Germany E-vehicle Market for Last Mile Delivery, By Delivery Type, 2020-2028 (USD Million)
30 Germany E-vehicle Market for Last Mile Delivery, By Vehicle Type, 2020-2028 (USD Million)
31 Germany E-vehicle Market for Last Mile Delivery, By Business Type, 2020-2028 (USD Million)
32 UK E-vehicle Market for Last Mile Delivery, By Delivery Type, 2020-2028 (USD Million)
33 UK E-vehicle Market for Last Mile Delivery, By Vehicle Type, 2020-2028 (USD Million)
34 UK E-vehicle Market for Last Mile Delivery, By Business Type, 2020-2028 (USD Million)
35 France E-vehicle Market for Last Mile Delivery, By Delivery Type, 2020-2028 (USD Million)
36 France E-vehicle Market for Last Mile Delivery, By Vehicle Type, 2020-2028 (USD Million)
37 France E-vehicle Market for Last Mile Delivery, By Business Type, 2020-2028 (USD Million)
38 Italy E-vehicle Market for Last Mile Delivery, By Delivery Type, 2020-2028 (USD Million)
39 Italy E-vehicle Market for Last Mile Delivery, By T Vehicle Type Type, 2020-2028 (USD Million)
40 Italy E-vehicle Market for Last Mile Delivery, By Business Type, 2020-2028 (USD Million)
41 Spain E-vehicle Market for Last Mile Delivery, By Delivery Type, 2020-2028 (USD Million)
42 Spain E-vehicle Market for Last Mile Delivery, By Vehicle Type, 2020-2028 (USD Million)
43 Spain E-vehicle Market for Last Mile Delivery, By Business Type, 2020-2028 (USD Million)
44 Netherlands E-vehicle Market for Last Mile Delivery, By Delivery Type, 2020-2028 (USD Million)
45 Netherlands E-vehicle Market for Last Mile Delivery, By Vehicle Type, 2020-2028 (USD Million)
46 Netherlands E-vehicle Market for Last Mile Delivery, By Business Type, 2020-2028 (USD Million)
47 Rest Of Europe E-vehicle Market for Last Mile Delivery, By Delivery Type, 2020-2028 (USD Million)
48 Rest Of Europe E-vehicle Market for Last Mile Delivery, By Vehicle Type, 2020-2028 (USD Million)
49 Rest of Europe E-vehicle Market for Last Mile Delivery, By Business Type, 2020-2028 (USD Million)
50 Asia Pacific E-vehicle Market for Last Mile Delivery, By Delivery Type, 2020-2028 (USD Million)
51 Asia Pacific E-vehicle Market for Last Mile Delivery, By Vehicle Type, 2020-2028 (USD Million)
52 Asia Pacific E-vehicle Market for Last Mile Delivery, By Business Type, 2020-2028 (USD Million)
53 Asia Pacific E-vehicle Market for Last Mile Delivery, By Country, 2020-2028 (USD Million)
54 China E-vehicle Market for Last Mile Delivery, By Delivery Type, 2020-2028 (USD Million)
55 China E-vehicle Market for Last Mile Delivery, By Vehicle Type, 2020-2028 (USD Million)
56 China E-vehicle Market for Last Mile Delivery, By Business Type, 2020-2028 (USD Million)
57 India E-vehicle Market for Last Mile Delivery, By Delivery Type, 2020-2028 (USD Million)
58 India E-vehicle Market for Last Mile Delivery, By Vehicle Type, 2020-2028 (USD Million)
59 India E-vehicle Market for Last Mile Delivery, By Business Type, 2020-2028 (USD Million)
60 Japan E-vehicle Market for Last Mile Delivery, By Delivery Type, 2020-2028 (USD Million)
61 Japan E-vehicle Market for Last Mile Delivery, By Vehicle Type, 2020-2028 (USD Million)
62 Japan E-vehicle Market for Last Mile Delivery, By Business Type, 2020-2028 (USD Million)
63 South Korea E-vehicle Market for Last Mile Delivery, By Delivery Type, 2020-2028 (USD Million)
64 South Korea E-vehicle Market for Last Mile Delivery, By Vehicle Type, 2020-2028 (USD Million)
65 South Korea E-vehicle Market for Last Mile Delivery, By Business Type, 2020-2028 (USD Million)
66 malaysia E-vehicle Market for Last Mile Delivery, By Delivery Type, 2020-2028 (USD Million)
67 malaysia E-vehicle Market for Last Mile Delivery, By Vehicle Type, 2020-2028 (USD Million)
68 malaysia E-vehicle Market for Last Mile Delivery, By Business Type, 2020-2028 (USD Million)
69 Thailand E-vehicle Market for Last Mile Delivery, By Delivery Type, 2020-2028 (USD Million)
70 Thailand E-vehicle Market for Last Mile Delivery, By Vehicle Type, 2020-2028 (USD Million)
71 Thailand E-vehicle Market for Last Mile Delivery, By Business Type, 2020-2028 (USD Million)
72 Indonesia E-vehicle Market for Last Mile Delivery, By Delivery Type, 2020-2028 (USD Million)
73 Indonesia E-vehicle Market for Last Mile Delivery, By Vehicle Type, 2020-2028 (USD Million)
74 Indonesia E-vehicle Market for Last Mile Delivery, By Business Type, 2020-2028 (USD Million)
75 Vietnam E-vehicle Market for Last Mile Delivery, By Delivery Type, 2020-2028 (USD Million)
76 Vietnam E-vehicle Market for Last Mile Delivery, By Vehicle Type, 2020-2028 (USD Million)
77 Vietnam E-vehicle Market for Last Mile Delivery, By Business Type, 2020-2028 (USD Million)
78 Taiwan E-vehicle Market for Last Mile Delivery, By Delivery Type, 2020-2028 (USD Million)
79 Taiwan E-vehicle Market for Last Mile Delivery, By Vehicle Type, 2020-2028 (USD Million)
80 Taiwan E-vehicle Market for Last Mile Delivery, By Business Type, 2020-2028 (USD Million)
81 Rest of Asia Pacific E-vehicle Market for Last Mile Delivery, By Delivery Type, 2020-2028 (USD Million)
82 Rest of Asia Pacific E-vehicle Market for Last Mile Delivery, By Vehicle Type, 2020-2028 (USD Million)
83 Rest of Asia Pacific E-vehicle Market for Last Mile Delivery, By Business Type, 2020-2028 (USD Million)
84 Middle East and Africa E-vehicle Market for Last Mile Delivery, By Delivery Type, 2020-2028 (USD Million)
85 Middle East and Africa E-vehicle Market for Last Mile Delivery, By Vehicle Type, 2020-2028 (USD Million)
86 Middle East and Africa E-vehicle Market for Last Mile Delivery, By Business Type, 2020-2028 (USD Million)
87 Middle East and Africa E-vehicle Market for Last Mile Delivery, By Country, 2020-2028 (USD Million)
88 Saudi Arabia E-vehicle Market for Last Mile Delivery, By Delivery Type, 2020-2028 (USD Million)
89 Saudi Arabia E-vehicle Market for Last Mile Delivery, By Vehicle Type, 2020-2028 (USD Million)
90 Saudi Arabia E-vehicle Market for Last Mile Delivery, By Business Type, 2020-2028 (USD Million)
91 UAE E-vehicle Market for Last Mile Delivery, By Delivery Type, 2020-2028 (USD Million)
92 UAE E-vehicle Market for Last Mile Delivery, By Vehicle Type, 2020-2028 (USD Million)
93 UAE E-vehicle Market for Last Mile Delivery, By Business Type, 2020-2028 (USD Million)
94 Israel E-vehicle Market for Last Mile Delivery, By Delivery Type, 2020-2028 (USD Million)
95 Israel E-vehicle Market for Last Mile Delivery, By Vehicle Type, 2020-2028 (USD Million)
96 Israel E-vehicle Market for Last Mile Delivery, By Business Type, 2020-2028 (USD Million)
97 South Africa E-vehicle Market for Last Mile Delivery, By Delivery Type, 2020-2028 (USD Million)
98 South Africa E-vehicle Market for Last Mile Delivery, By Vehicle Type, 2020-2028 (USD Million)
99 South Africa E-vehicle Market for Last Mile Delivery, By Business Type, 2020-2028 (USD Million)
100 Rest of Middle East and Africa E-vehicle Market for Last Mile Delivery, By Delivery Type, 2020-2028 (USD Million)
101 Rest of Middle East and Africa E-vehicle Market for Last Mile Delivery, By Vehicle Type, 2020-2028 (USD Million)
102 Rest of Middle East and Africa E-vehicle Market for Last Mile Delivery, By Business Type, 2020-2028 (USD Million)
103 Central & South America E-vehicle Market for Last Mile Delivery, By Delivery Type, 2020-2028 (USD Million)
104 Central & South America E-vehicle Market for Last Mile Delivery, By Vehicle Type, 2020-2028 (USD Million)
105 Central & South America E-vehicle Market for Last Mile Delivery, By Business Type, 2020-2028 (USD Million)
106 Central & South America E-vehicle Market for Last Mile Delivery, By Country, 2020-2028 (USD Million)
107 Brazil E-vehicle Market for Last Mile Delivery, By Delivery Type, 2020-2028 (USD Million)
108 Brazil E-vehicle Market for Last Mile Delivery, By Vehicle Type, 2020-2028 (USD Million)
109 Brazil E-vehicle Market for Last Mile Delivery, By Business Type, 2020-2028 (USD Million)
110 Argentina E-vehicle Market for Last Mile Delivery, By Delivery Type, 2020-2028 (USD Million)
111 Argentina E-vehicle Market for Last Mile Delivery, By Vehicle Type, 2020-2028 (USD Million)
112 Argentina E-vehicle Market for Last Mile Delivery, By Business Type, 2020-2028 (USD Million)
113 Chile E-vehicle Market for Last Mile Delivery, By Delivery Type, 2020-2028 (USD Million)
114 Chile E-vehicle Market for Last Mile Delivery, By Vehicle Type, 2020-2028 (USD Million)
115 Chile E-vehicle Market for Last Mile Delivery, By Business Type, 2020-2028 (USD Million)
116 Rest of Central and South America E-vehicle Market for Last Mile Delivery, By Delivery Type, 2020-2028 (USD Million)
117 Rest of Central and South America E-vehicle Market for Last Mile Delivery, By Vehicle Type, 2020-2028 (USD Million)
118 Rest of Central and South America E-vehicle Market for Last Mile Delivery, By Business Type, 2020-2028 (USD Million)
119 Gogoro: Products & Services Offering
120 TESLA, INC.: Products & Services Offering
121 NIO Inc.: Products & Services Offering
122 Rivian Automotive, Inc: Products & Services Offering
123 Workhorse Group Inc.: Products & Services Offering
124 CHANJE: Products & Services Offering
125 Ryder Systems, Inc. : Products & Services Offering
126 Ryder Systems, Inc.: Products & Services Offering
127 Zen Mobility, Inc: Products & Services Offering
128 Volkswagen: Products & Services Offering
129 Other Companies: Products & Services Offering
LIST OF FIGURES
1 Global E-vehicle Market for Last Mile Delivery Overview
2 Global E-vehicle Market for Last Mile Delivery Value From 2020-2028 (USD Million)
3 Global E-vehicle Market for Last Mile Delivery Share, By Delivery Type (2022)
4 Global E-vehicle Market for Last Mile Delivery Share, By Vehicle Type (2022)
5 Global E-vehicle Market for Last Mile Delivery Share, By Business Type (2022)
6 Global E-vehicle Market for Last Mile Delivery, By Region (Asia Pacific Market)
7 Technological Trends In Global E-vehicle Market for Last Mile Delivery
8 Four Quadrant Competitor Positioning Matrix
9 Impact Of Macro & Micro Indicators On The Market
10 Impact Of Key Drivers On The Global E-vehicle Market for Last Mile Delivery
11 Impact Of Challenges On The Global E-vehicle Market for Last Mile Delivery
12 Porter’s Five Forces Analysis
13 Global E-vehicle Market for Last Mile Delivery: By Delivery Type Scope Key Takeaways
14 Global E-vehicle Market for Last Mile Delivery, By Delivery Type Segment: Revenue Growth Analysis
15 Courier and Package Delivery Services Market, By Region, 2020-2028 (USD Million)
16 Food Delivery Services Market, By Region, 2020-2028 (USD Million)
17 Retail Delivery Market, By Region, 2020-2028 (USD Million)
18 Global E-vehicle Market for Last Mile Delivery: By Vehicle Type Scope Key Takeaways
19 Global E-vehicle Market for Last Mile Delivery, By Vehicle Type Segment: Revenue Growth Analysis
20 Light-duty Market, By Region, 2020-2028 (USD Million)
21 Medium & Heavy-duty Market, By Region, 2020-2028 (USD Million)
22 Global E-vehicle Market for Last Mile Delivery: By Business Type Scope Key Takeaways
23 Global E-vehicle Market for Last Mile Delivery, By Business Type Segment: Revenue Growth Analysis
24 Business-to-Consumer (B2C) Market, By Region, 2020-2028 (USD Million)
25 Business-to-Business (B2B) Market, By Region, 2020-2028 (USD Million)
26 Marketplaces Market, By Region, 2020-2028 (USD Million)
27 Regional Segment: Revenue Growth Analysis
28 Global E-vehicle Market for Last Mile Delivery: Regional Analysis
29 North America E-vehicle Market for Last Mile Delivery Overview
30 North America E-vehicle Market for Last Mile Delivery, By Delivery Type
31 North America E-vehicle Market for Last Mile Delivery, By Vehicle Type
32 North America E-vehicle Market for Last Mile Delivery, By Business Type
33 North America E-vehicle Market for Last Mile Delivery, By Country
34 U.S. E-vehicle Market for Last Mile Delivery, By Delivery Type
35 U.S. E-vehicle Market for Last Mile Delivery, By Vehicle Type
36 U.S. E-vehicle Market for Last Mile Delivery, By Business Type
37 Canada E-vehicle Market for Last Mile Delivery, By Delivery Type
38 Canada E-vehicle Market for Last Mile Delivery, By Vehicle Type
39 Canada E-vehicle Market for Last Mile Delivery, By Business Type
40 Mexico E-vehicle Market for Last Mile Delivery, By Delivery Type
41 Mexico E-vehicle Market for Last Mile Delivery, By Vehicle Type
42 Mexico E-vehicle Market for Last Mile Delivery, By Business Type
43 Four Quadrant Positioning Matrix
44 Company Market Share Analysis
45 Gogoro: Company Snapshot
46 Gogoro: SWOT Analysis
47 Gogoro: Geographic Presence
48 TESLA, INC.: Company Snapshot
49 TESLA, INC.: SWOT Analysis
50 TESLA, INC.: Geographic Presence
51 NIO Inc.: Company Snapshot
52 NIO Inc.: SWOT Analysis
53 NIO Inc.: Geographic Presence
54 Rivian Automotive, Inc: Company Snapshot
55 Rivian Automotive, Inc: Swot Analysis
56 Rivian Automotive, Inc: Geographic Presence
57 Workhorse Group Inc.: Company Snapshot
58 Workhorse Group Inc.: SWOT Analysis
59 Workhorse Group Inc.: Geographic Presence
60 CHANJE: Company Snapshot
61 CHANJE: SWOT Analysis
62 CHANJE: Geographic Presence
63 Ryder Systems, Inc. : Company Snapshot
64 Ryder Systems, Inc. : SWOT Analysis
65 Ryder Systems, Inc. : Geographic Presence
66 Ryder Systems, Inc.: Company Snapshot
67 Ryder Systems, Inc.: SWOT Analysis
68 Ryder Systems, Inc.: Geographic Presence
69 Zen Mobility, Inc.: Company Snapshot
70 Zen Mobility, Inc.: SWOT Analysis
71 Zen Mobility, Inc.: Geographic Presence
72 Volkswagen: Company Snapshot
73 Volkswagen: SWOT Analysis
74 Volkswagen: Geographic Presence
75 Other Companies: Company Snapshot
76 Other Companies: SWOT Analysis
77 Other Companies: Geographic Presence
The Global E-vehicle Market for Last Mile Delivery has been studied from the year 2019 till 2028. However, the CAGR provided in the report is from the year 2023 to 2028. The research methodology involved three stages: Desk research, Primary research, and Analysis & Output from the entire research process.

The desk research involved a robust background study which meant referring to paid and unpaid databases to understand the market dynamics; mapping contracts from press releases; identifying the key players in the market, studying their product portfolio, competition level, annual reports/SEC filings & investor presentations; and learning the demand and supply-side analysis for the E-vehicle Market for Last Mile Delivery.

The primary research activity included telephonic conversations with more than 50 tier 1 industry consultants, distributors, and end-use product manufacturers.

Finally, based on the above thorough research process, an in-depth analysis was carried out considering the following aspects: market attractiveness, current & future market trends, market share analysis, SWOT analysis of the company and customer analytics.

Frequently Asked Questions

This FREE sample includes market data points, ranging from trend analyses to market estimates & forecasts. See for yourself.
Or view our licence options:
Tailor made solutions just for you
80% of our clients seek made-to-order reports. How do you want us to tailor yours?
OUR CLIENTS


