This report was recently updated on August 27 2025 with the latest and most recent
market numbers
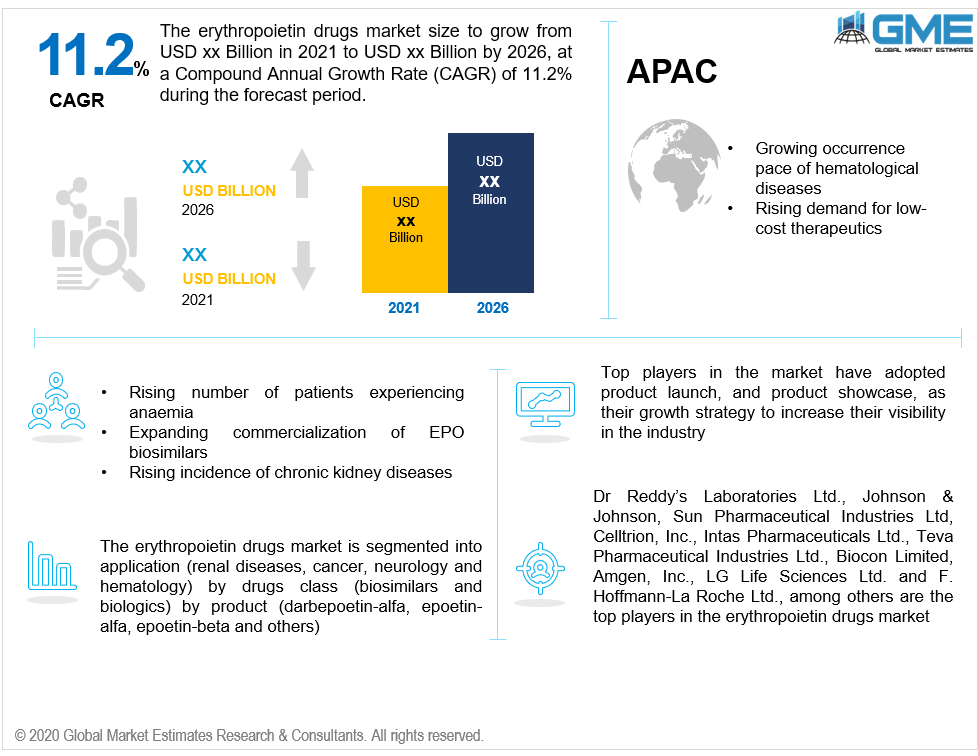
Global Erythropoietin Drugs Market Size, Trends & Analysis - Forecasts to 2026 By Application (Renal Diseases, Cancer, Neurology, Hematology), By Drugs Class (Biosimilars, Biologics), By Product (Darbepoetin-alfa, Epoetin-alfa, Epoetin-beta, Others), By Region (North America, Asia Pacific, CSA, Europe, and the Middle East and Africa); End-User Landscape, Company Market Share Analysis & Competitor Analysis
The hormone erythropoietin (EPO), also known as haemopoietin, is produced endogenously by the kidneys and plays an important role in the generation of red blood cells (RBCs). Red platelets are formed in the bone marrow and aid in the transport of oxygen throughout the body. Erythropoietin drugs are utilized to treat anaemia caused because of chronic kidney infections, HIV, or cancer treatment.
The market for erythropoietin (EPO) drugs is projected to increase over the forecast timeline, attributed to factors such as an increase in the number of patients suffering from anemia, attractive reimbursements, growing commercialization of EPO biosimilars, and the rising incidence of chronic kidney diseases.
Increasing biosimilar R&D investments, a solid product pipeline, and hospital-manufacturer collaborations for the adoption of EPO biosimilars are all major market drivers for the biosimilar segment's growth. The recent introduction of erythropoietin biosimilars in the United States is believed to indicate a change in global EPO medication development from biologics to biosimilars.
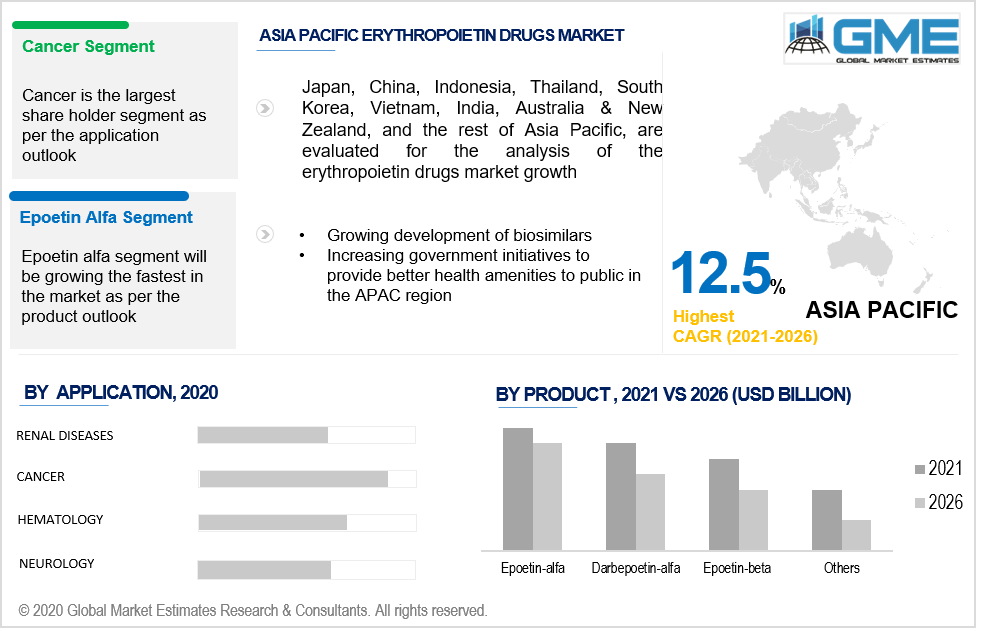
Based on the application the market can be segregated into renal diseases, cancer, neurology, and hematology. Owing to the increasing number of cancer cases around the world, the cancer category is predicted to be the fastest-growing. Chemotherapy for cancer patients entails the administration of medicines that lowers the patient's red blood cells count. As a result, they've become more common in recent years when used alongside chemotherapy. The cancer portion is probably going to develop with a rising CAGR for the anticipated period.
Due to increased R&D initiatives to seek cost-effective and practical treatments for treating illnesses such as hypoxia and anemia of prematurity, the hematology segment is expected to grow steadily throughout the projected period. The use of the right dose of recombinant human erythropoietin can treat preterm anemia and lessen the requirement for numerous blood transfusions in newborns.
Based on the drug class, the market is segmented into biosimilars and biologics. Biosimilars for the treatment of anemia are predicted to gain popularity in the coming years. When compared to biologics, biosimilars are simple to create, cost-effective and take less time to become approved. Throughout the projection period, these associated benefits are likely to boost the segment's growth.
Given the product, the market for erythropoietin drugs market can be divided into darbepoetin-alfa, epoetin-alfa, and epoetin-beta, among others. Epoetin alfa was the prevailing portion in earlier years. It is expected to stay predominant in the predicted period, as far as income is concerned. Epoetin alfa is normally identified with malignant growth chemotherapy and chronic renal failure. The development in this portion is because of the wide scope of acquisitions among medical services experts.
As per the geographical analysis, the market of Erythropoietin Drugs Market can be classified into North America (the US, Canada, and Mexico), Asia Pacific (India, China, Japan, Malaysia, Singapore, and Rest of Asia Pacific), Europe (Germany, United Kingdom, Italy, France, Spain, Netherlands, and Rest of Europe), Middle East & Africa and Central & South America. North America was the predominant locale as far as income is concerned in previous years and is expected to stay prevailing in the predicted period. The development in the locale can be ascribed to the expanding sanctions of erythropoietin drugs, government incentives offered for research on chronic diseases, for example, innovative work awards, drug restrictiveness, tax credit, and fee waivers, among others.
Europe is expected to be the following next in terms of income in the predicted time frame. This development can be ascribed to the expanding predominance of chronic diseases around there. The development of the section is driven by government drives for cancer and other treatment for chronic diseases. Public authorities of different nations in the locale are putting forth attempts to diminish the pace of occurrence of cancer.
Because of the rising frequency of chronic diseases and the strong demand for low-cost therapies, the Asia Pacific EPO sector is expected to develop at the quickest CAGR. Many firms have expressed interest in creating biosimilars in the Asia Pacific, and the region is noted for producing more biosimilars than any other region on the globe. Furthermore, growing government activities in this region to give improved health services to the general people is another factor that influences the market growth.
Dr. Reddy’s Laboratories Ltd., Johnson & Johnson, Sun Pharmaceutical Industries Ltd, Celltrion, Inc., Intas Pharmaceuticals Ltd., Teva Pharmaceutical Industries Ltd., Biocon Limited, Amgen, Inc., LG Life Sciences Ltd., and F. Hoffmann-La Roche Ltd., among others, are the top players in the erythropoietin drugs market.
Please note: This is not an exhaustive list of companies profiled in the report.
Chapter 1 Methodology
1.1 Market Scope & Definitions
1.2 Estimates & Forecast Calculation
1.3 Historical Data Overview and Validation
1.4 Data Sources
1.4.1 Secondary
1.4.2 Primary
Chapter 2 Report Outlook
2.1 Global Erythropoietin Drugs Industry Overview, 2019-2026
2.1.1 Industry Overview
2.1.2 Application Overview
2.1.3 Drug Class Overview
2.1.4 Product Overview
2.1.5 Regional Overview
Chapter 3 Global Erythropoietin Drugs Market Trends
3.1 Market Segmentation
3.2 Industry Background, 2019-2026
3.3 Market Key Trends
3.3.1 Positive Trends
3.3.1.1 Increasing awareness concerning the healthcare
3.3.1.2 Progressions in infrastructure across the globe for the healthcare Industry
3.3.2 Industry Challenges
3.3.2.1 High cost of erythropoietin drugs in developing countries
3.4 Prospective Growth Scenario
3.4.1 Application Growth Scenario
3.4.2 Drug Class Growth Scenario
3.4.3 Product Growth Scenario
3.5 COVID-19 Influence over Industry Growth
3.6 Porter’s Analysis
3.7 PESTEL Analysis
3.8 Value Chain & Supply Chain Analysis
3.9 Regulatory Framework
3.9.1 North America
3.9.2 Europe
3.9.3 APAC
3.9.4 LATAM
3.9.5 MEA
3.10 Technology Overview
3.11 Market Share Analysis, 2020
3.11.1 Company Positioning Overview, 2020
Chapter 4 Global Erythropoietin Drugs Market, By Application
4.1 Application Outlook
4.2 Renal Diseases
4.2.1 Market Size, By Region, 2019-2026 (USD Billion)
4.3 Cancer
4.3.1 Market Size, By Region, 2019-2026 (USD Billion)
4.4 Neurology
4.4.1 Market Size, By Region, 2019-2026 (USD Billion)
4.5 Hematology
4.5.1 Market Size, By Region, 2019-2026 (USD Billion)
Chapter 5 Global Erythropoietin Drugs Market, By Drug Class
5.1 Drug Class Outlook
5.2 Biosimilars
5.2.1 Market Size, By Region, 2019-2026 (USD Billion)
5.3 Biologics
5.3.1 Market Size, By Region, 2019-2026 (USD Billion)
Chapter 6 Erythropoietin Drugs Market, By Product
6.1 Product Outlook
6.2 Darbepoetin-alfa
6.2.1 Market size, By Region, 2019-2026 (USD Billion)
6.3 Epoetin-alfa
6.3.1 Market size, By Region, 2019-2026 (USD Billion)
6.4 Epoetin-beta
6.4.1 Market size, By Region, 2019-2026 (USD Billion)
6.5 Others
6.5.1 Market size, By Region, 2019-2026 (USD Billion)
Chapter 7 Global Erythropoietin Drugs Market, By Region
7.1 Regional outlook
7.2 North America
7.2.1 Market Size, By Country 2019-2026 (USD Billion)
7.2.2 Market Size, By Application, 2019-2026 (USD Billion)
7.2.3 Market Size, By Drug Class, 2019-2026 (USD Billion)
7.2.4 Market Size, By Product, 2019-2026 (USD Billion)
7.2.5 U.S.
7.2.5.1 Market Size, By Application, 2019-2026 (USD Billion)
7.2.5.2 Market Size, By Drug Class, 2019-2026 (USD Billion)
7.2.5.3 Market Size, By Product, 2019-2026 (USD Billion)
7.2.6 Canada
7.2.6.1 Market Size, By Application, 2019-2026 (USD Billion)
7.2.6.2 Market Size, By Drug Class, 2019-2026 (USD Billion)
7.2.6.3 Market Size, By Product, 2019-2026 (USD Billion)
7.3 Europe
7.3.1 Market Size, By Country 2019-2026 (USD Billion)
7.3.2 Market Size, By Application, 2019-2026 (USD Billion)
7.3.3 Market Size, By Drug Class, 2019-2026 (USD Billion)
7.3.4 Market Size, By Product, 2019-2026 (USD Billion)
7.3.5 Germany
7.2.5.1 Market Size, By Application, 2019-2026 (USD Billion)
7.2.5.2 Market Size, By Drug Class, 2019-2026 (USD Billion)
7.2.5.3 Market Size, By Product, 2019-2026 (USD Billion)
7.3.6 UK
7.3.6.1 Market Size, By Application, 2019-2026 (USD Billion)
7.3.6.2 Market Size, By Drug Class, 2019-2026 (USD Billion)
7.3.6.3 Market Size, By Product, 2019-2026 (USD Billion)
7.3.7 France
7.3.7.1 Market Size, By Application, 2019-2026 (USD Billion)
7.3.7.2 Market Size, By Drug Class, 2019-2026 (USD Billion)
7.3.7.3 Market Size, By Product, 2019-2026 (USD Billion)
7.3.8 Italy
7.3.8.1 Market Size, By Application, 2019-2026 (USD Billion)
7.3.8.2 Market Size, By Drug Class, 2019-2026 (USD Billion)
7.3.8.3 Market Size, By Product, 2019-2026 (USD Billion)
7.3.9 Spain
7.3.9.1 Market Size, By Application, 2019-2026 (USD Billion)
7.3.9.2 Market Size, By Drug Class, 2019-2026 (USD Billion)
7.3.9.3 Market Size, By Product, 2019-2026 (USD Billion)
7.3.10 Russia
7.3.10.1 Market Size, By Application, 2019-2026 (USD Billion)
7.3.10.2 Market Size, By Drug Class, 2019-2026 (USD Billion)
7.3.10.3 Market Size, By Product, 2019-2026 (USD Billion)
7.4 Asia Pacific
7.4.1 Market Size, By Country 2019-2026 (USD Billion)
7.4.2 Market Size, By Application, 2019-2026 (USD Billion)
7.4.3 Market Size, By Drug Class, 2019-2026 (USD Billion)
7.4.4 Market Size, By Product, 2019-2026 (USD Billion)
7.4.5 China
7.4.5.1 Market Size, By Application, 2019-2026 (USD Billion)
7.4.5.2 Market Size, By Drug Class, 2019-2026 (USD Billion)
7.4.5.3 Market Size, By Product, 2019-2026 (USD Billion)
7.4.6 India
7.4.6.1 Market Size, By Application, 2019-2026 (USD Billion)
7.4.6.2 Market Size, By Drug Class, 2019-2026 (USD Billion)
7.4.6.3 Market Size, By Product, 2019-2026 (USD Billion)
7.4.7 Japan
7.4.7.1 Market Size, By Application, 2019-2026 (USD Billion)
7.4.7.2 Market Size, By Drug Class, 2019-2026 (USD Billion)
7.4.7.3 Market Size, By Product, 2019-2026 (USD Billion)
7.4.8 Australia
7.4.8.1 Market Size, By Application, 2019-2026 (USD Billion)
7.4.8.2 Market size, By Drug Class, 2019-2026 (USD Billion)
7.4.8.3 Market Size, By Product, 2019-2026 (USD Billion)
7.4.9 South Korea
7.4.9.1 Market Size, By Application, 2019-2026 (USD Billion)
7.4.9.2 Market Size, By Drug Class, 2019-2026 (USD Billion)
7.4.9.3 Market Size, By Product, 2019-2026 (USD Billion)
7.5 Latin America
7.5.1 Market Size, By Country 2019-2026 (USD Billion)
7.5.2 Market Size, By Application, 2019-2026 (USD Billion)
7.5.3 Market Size, By Drug Class, 2019-2026 (USD Billion)
7.5.4 Market Size, By Product, 2019-2026 (USD Billion)
7.5.5 Brazil
7.5.5.1 Market Size, By Application, 2019-2026 (USD Billion)
7.5.5.2 Market Size, By Drug Class, 2019-2026 (USD Billion)
7.5.5.3 Market Size, By Product, 2019-2026 (USD Billion)
7.5.6 Mexico
7.5.6.1 Market Size, By Application, 2019-2026 (USD Billion)
7.5.6.2 Market Size, By Drug Class, 2019-2026 (USD Billion)
7.5.6.3 Market Size, By Product, 2019-2026 (USD Billion)
7.5.7 Argentina
7.5.7.1 Market Size, By Application, 2019-2026 (USD Billion)
7.5.7.2 Market Size, By Drug Class, 2019-2026 (USD Billion)
7.5.7.3 Market Size, By Product, 2019-2026 (USD Billion)
7.6 MEA
7.6.1 Market Size, By Country 2019-2026 (USD Billion)
7.6.2 Market Size, By Application, 2019-2026 (USD Billion)
7.6.3 Market Size, By Drug Class, 2019-2026 (USD Billion)
7.6.4 Market Size, By Product, 2019-2026 (USD Billion)
7.6.5 Saudi Arabia
7.6.5.1 Market Size, By Application, 2019-2026 (USD Billion)
7.6.5.2 Market Size, By Drug Class, 2019-2026 (USD Billion)
7.6.5.3 Market Size, By Product, 2019-2026 (USD Billion)
7.6.6 UAE
7.6.6.1 Market Size, By Application, 2019-2026 (USD Billion)
7.6.6.2 Market Size, By Drug Class, 2019-2026 (USD Billion)
7.6.6.3 Market Size, By Product, 2019-2026 (USD Billion)
7.6.7 South Africa
7.6.7.1 Market Size, By Application, 2019-2026 (USD Billion)
7.6.7.2 Market Size, By Drug Class, 2019-2026 (USD Billion)
7.6.7.3 Market Size, By Product, 2019-2026 (USD Billion)
Chapter 8 Company Landscape
8.1 Competitive Analysis, 2020
8.2 Dr. Reddy’s Laboratories Ltd.
8.2.1 Company Overview
8.2.2 Financial Analysis
8.2.3 Strategic Positioning
8.2.4 Info-Graphic Analysis
8.3 Johnson & Johnson.
8.3.1 Company Overview
8.3.2 Financial Analysis
8.3.3 Strategic Positioning
8.3.4 Info-Graphic Analysis
8.4 Sun Pharmaceutical Industries Ltd
8.4.1 Company Overview
8.4.2 Financial Analysis
8.4.3 Strategic Positioning
8.4.4 Info-Graphic Analysis
8.5 Celltrion, Inc.
8.5.1 Company Overview
8.5.2 Financial Analysis
8.5.3 Strategic Positioning
8.5.4 Info-Graphic Analysis
8.6 Intas Pharmaceuticals Ltd.
8.6.2 Financial Analysis
8.6.3 Strategic Positioning
8.6.4 Info-Graphic Analysis
8.7 Teva Pharmaceutical Industries Ltd.
8.7.1 Company Overview
8.7.2 Financial Analysis
8.7.3 Strategic Positioning
8.7.4 Info-Graphic Analysis
8.8 Biocon Limited
8.8.1 Company Overview
8.8.2 Financial Analysis
8.8.3 Strategic Positioning
8.8.4 Info-Graphic Analysis
8.9 Amgen, Inc.
8.9.2 Financial Analysis
8.9.3 Strategic Positioning
8.9.4 Info-Graphic Analysis
8.10 LG Life Sciences Ltd.
8.9.1 Company Overview
8.9.2 Financial Analysis
8.9.3 Strategic Positioning
8.9.4 Info-Graphic Analysis
8.11 F. Hoffmann-La Roche Ltd.
8.9.1 Company Overview
8.9.2 Financial Analysis
8.9.3 Strategic Positioning
8.9.4 Info-Graphic Analysis
8.12 Other Companies
8.12.1 Company Overview
8.12.2 Financial Analysis
8.12.3 Strategic Positioning
8.12.4 Info-Graphic Analysis
The Global Erythropoietin Drugs Market has been studied from the year 2019 till 2026. However, the CAGR provided in the report is from the year 2021 to 2026. The research methodology involved three stages: Desk research, Primary research, and Analysis & Output from the entire research process.

The desk research involved a robust background study which meant referring to paid and unpaid databases to understand the market dynamics; mapping contracts from press releases; identifying the key players in the market, studying their product portfolio, competition level, annual reports/SEC filings & investor presentations; and learning the demand and supply-side analysis for the Erythropoietin Drugs Market.

The primary research activity included telephonic conversations with more than 50 tier 1 industry consultants, distributors, and end-use product manufacturers.

Finally, based on the above thorough research process, an in-depth analysis was carried out considering the following aspects: market attractiveness, current & future market trends, market share analysis, SWOT analysis of the company and customer analytics.

Frequently Asked Questions

This FREE sample includes market data points, ranging from trend analyses to market estimates & forecasts. See for yourself.
Or view our licence options:
Tailor made solutions just for you
80% of our clients seek made-to-order reports. How do you want us to tailor yours?
OUR CLIENTS


