This report was recently updated on August 19 2025 with the latest and most recent
market numbers
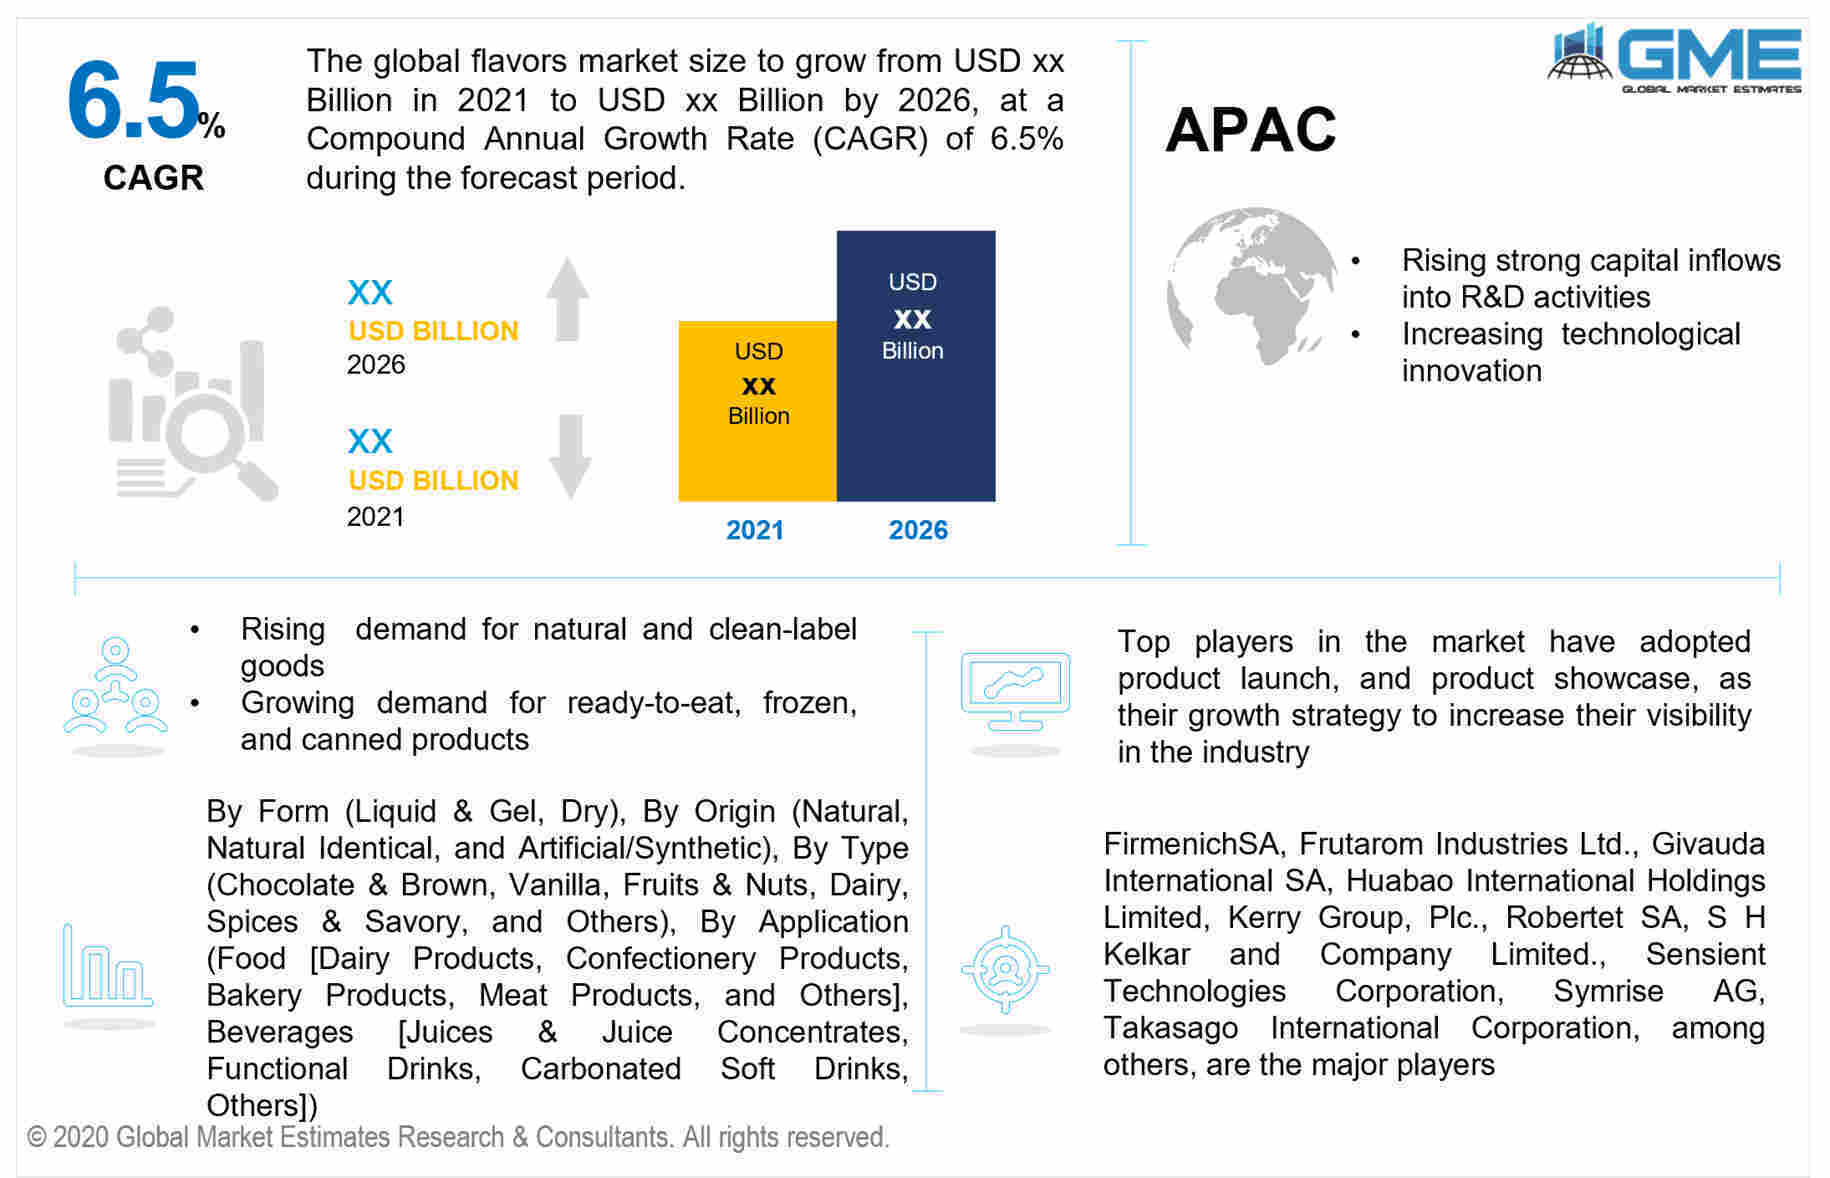
Global Flavors Market Size, Trends & Analysis - Forecasts to 2026 By Form (Liquid & Gel, Dry), By Origin (Natural, Natural Identical, and Artificial/Synthetic), By Type (Chocolate & Brown, Vanilla, Fruits & Nuts, Dairy, Spices & Savory, and Others), By Application (Food [Dairy Products, Confectionery Products, Bakery Products, Meat Products, and Others], Beverages [Juices & Juice Concentrates, Functional Drinks, Carbonated Soft Drinks, Others]), By Region (North America, Asia Pacific, Europe, Latin America, Middle East & Africa); Competitive Landscape, Company Market Share Analysis, and Competitor Analysis
The key drivers which contribute to the flavors market include the rising demand for natural and clean-label goods, growing demand for ready-to-eat, frozen, and canned products, technological innovation, the introduction of new tastes, and strong capital inflows into R&D activities are all contributing to an increase in sales in flavors market. Food flavor demand is rising as disposable income rises, particularly among young and middle-class customers.
Furthermore, the growing number of product innovations by food and beverage manufacturers is assisting in the introduction of new products to attract new and established consumers in the industry. The availability of fake and low-cost food flavoring ingredients, on the other hand, stymies the growth of the meat flavorings industry. The creation of demand for food flavored items of various types is aided by the growth of organized retail chains in developing countries, which are heavily reliant on revenues from various types of food and beverages. This leads to augmented growth in the flavors market.
Another major factor expected to fuel market growth is the growing demand for flavors in the pharmaceutical industry due to the need for flavors to mask the bitterness and smells of medicines. The global food flavors market is being driven by a growing demand for new flavored food items, as well as constant food flavor innovation in response to customer demands based on tastes and preferences.
Each country/region uses different flavors depending on the raw materials available in that specific country or region. As a result of cultural differences and consumer tastes, flavors vary from region to region. This element is expected to generate revenue opportunities for major players by allowing them to develop flavors based on specific tastes and authentic raw materials, as well as broaden their customer base at a rapid rate.
Consumers' rising health considerations about the intake of organic food items are a significant force driving the growth of the global food tastes market. The market's growth will be accelerated by the growing application of food flavors across different eatable products, as well as consumers' increasing acceptance of natural flavors. Various multinational conglomerates are concentrating their efforts on developing exotic and special delicious food flavors, which will entice a vast number of customers to use food flavors to improve the overall taste of their food. Additionally, changing consumer lifestyles, high demand for convenient foodstuffs, and the advent of the novel healthy and appealing package, will all contribute to market development.
Depending on the form, the market is classified as liquid & gel and dry. The market is dominated by food flavors in liquid and gel form. The manufacturers prefer the liquid and gel types because they are easier to mix with the ingredients. It gives the finished product a consistent texture and color. It's much more robust than the dry version, so it's driving the demand.
Depending on the origin, the market is classified as natural, natural identical, and artificial/synthetic. Because of the numerous regional culinary influences, the natural food taste market has the largest market share. Despite manufactured tastes, natural extracts from numerous plants offer the ethnicity of a regional meal. Numerous restaurant businesses are incorporating natural tastes into their menus in order to provide a more realistic experience. Furthermore, the younger generation extensively uses botanicals and creatine supplements in their cooking. This is because people are becoming more conscious of the consequences of synthetic flavorants. Persistent use and ingestion of artificial flavoring compounds cause a variety of health problems. As a result, a variety of manufacturers are involved in the manufacturing of natural food flavors.
Depending on the type, the market is classified as chocolate & brown, vanilla, fruits & nuts, dairy, spices, and others. The fruit and nut category is expected to dominate the market. Fruit tastes are commonly utilized in a variety of processed foods & drinks and employed in pharmaceutical products. These aforesaid aspects are projected to propel the segment's expansion in the worldwide market. Producers of food and beverage tastes are working on increasing manufacturing capacity to assure adequate product provision on a worldwide basis. Furthermore, producers are investing in the research and development of new and novel compositions of natural tastes employing exotic fruits and botanicals, resulting in increased consumption of natural tastes among consumers. This is increasing demand for food flavors and, as a result, promoting expansion in this segment.
Depending on the application, the market is classified as food and beverages. Food includes dairy products, confectionery products, bakery products, meat products, and others. While beverages include juices & juice concentrates, functional drinks, carbonated soft drinks, and others.
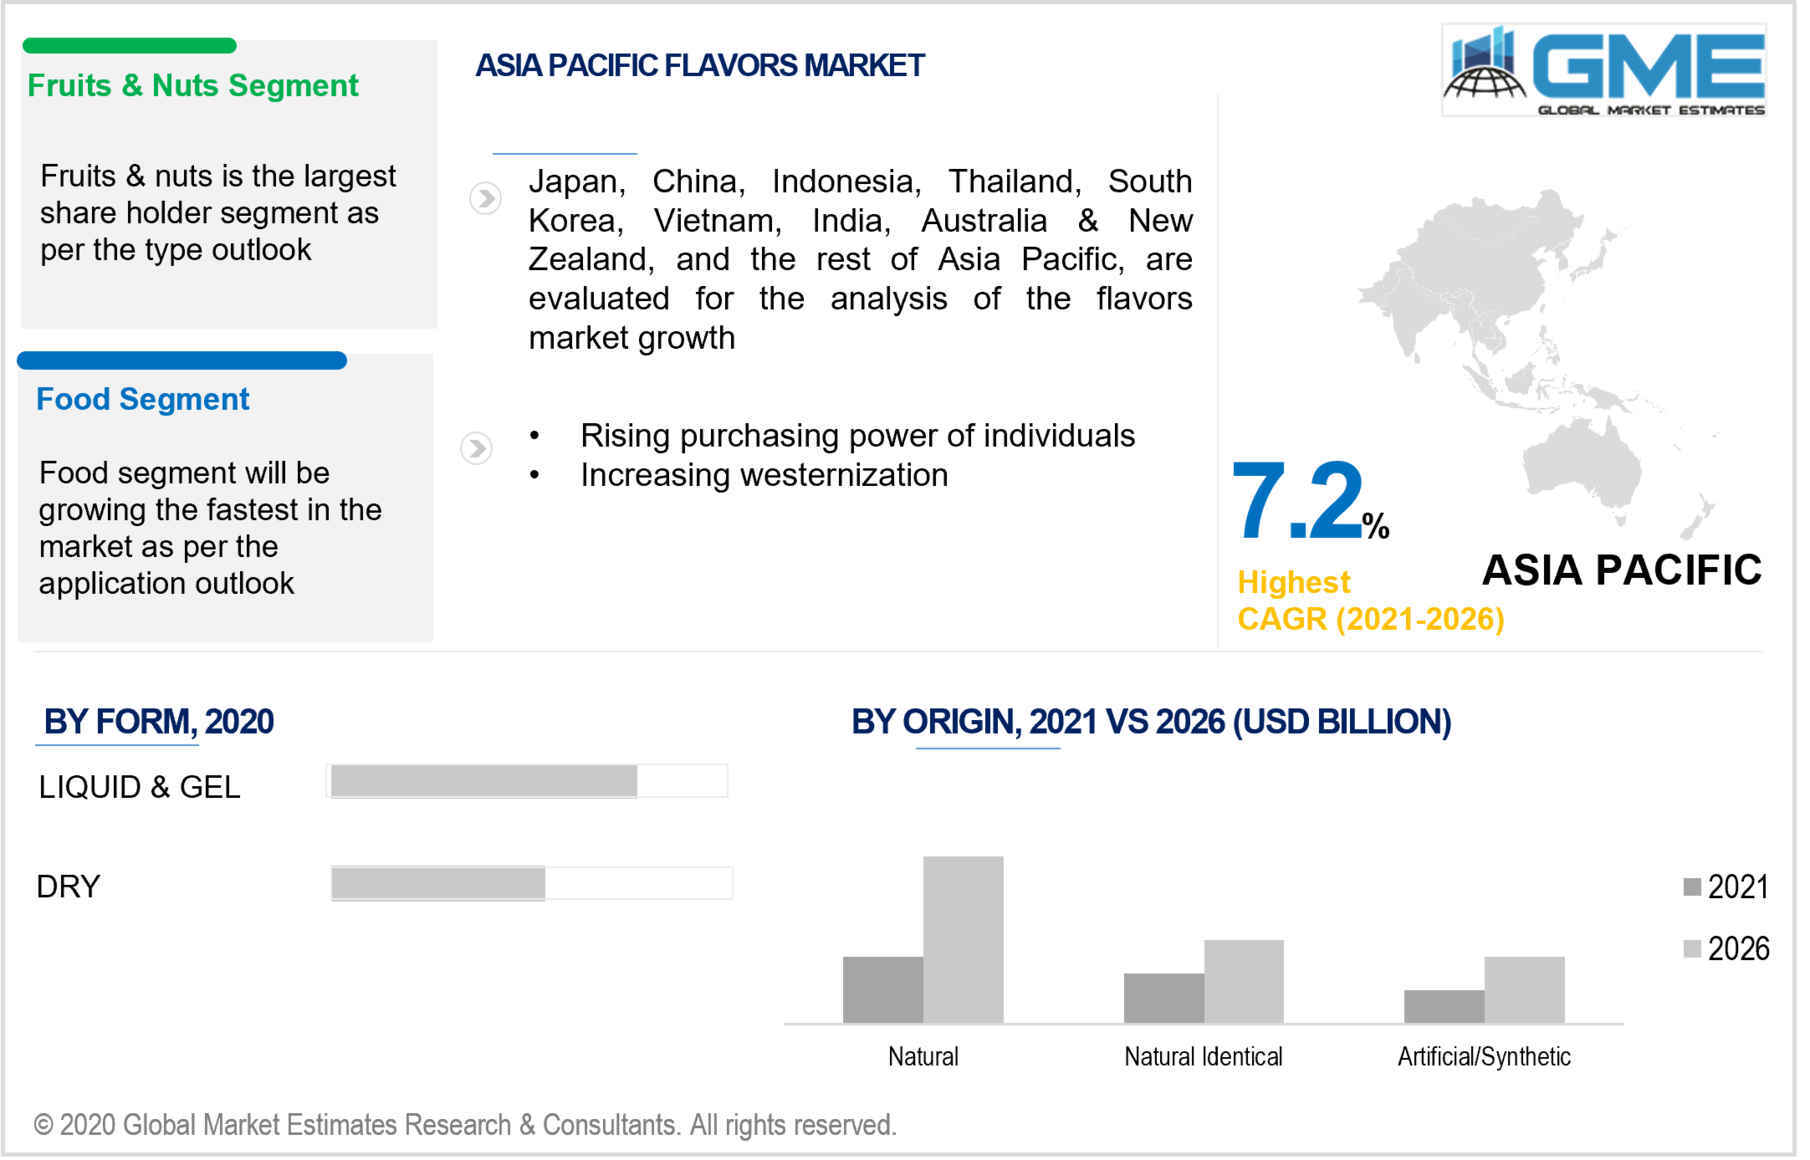
As per the geographical analysis, the market can be classified into North America (the US, Canada, and Mexico), Asia Pacific (India, China, Japan, Malaysia, Singapore, and Rest of Asia Pacific), Europe (Germany, United Kingdom, Italy, France, Spain, Netherlands, and Rest of Europe), Middle East & Africa and Central & South America. The Asia Pacific market probably accounts for a sizable portion of global revenue. Rising westernization and consumer buying power are possible to boost market expansion in the area. Furthermore, increasing production and sales of dairy-based foods in the area are likely to drive market expansion in the Asia Pacific to a great extent. Producers in the area are also offering to foreign markets, including North America and Europe, which will assist Asia Pacific market expansion in the coming years. North America is prophesied to have the second-largest market share in the industry, trailing the Asia Pacific. This is due to the area's intake of numerous regional cuisines. The area's migratory demographic encourages the adoption of its indigenous culinary items, which has resulted in the establishment of numerous foreign culinary services in the area.
FirmenichSA, Frutarom Industries Ltd., Givauda International SA, Huabao International Holdings Limited, Kerry Group, Plc., Robertet SA, S H Kelkar and Company Limited., Sensient Technologies Corporation, Symrise AG, Takasago International Corporation, among others, are the major players.
Please note: This is not an exhaustive list of companies profiled in the report.
Chapter 1 Methodology
1.1 Market Scope & Definitions
1.2 Estimates & Forecast Calculation
1.3 Historical Data Overview And Validation
1.4 Data Sources
1.4.1 Secondary
1.4.2 Primary
Chapter 2 Report Outlook
2.1 Flavors Industry Overview, 2016-2026
2.1.1 Industry Overview
2.1.2 Form Overview
2.1.3 Type Overview
2.1.4 Origin Overview
2.1.5 Application Overview
2.1.6 Regional Overview
Chapter 3 Flavors Market Trends
3.1 Market Segmentation
3.2 Industry Background, 2016-2026
3.3 Market Key Trends
3.3.1 Positive Trends
3.3.1.1 The Increasing Demand for Natural Ingredients in Food Products
3.3.1.2 Increasing Demand For Processed Foods and Beverages
3.3.2 Industry Challenges
3.3.2.1 High Cost Involved in the Production of Natural Flavours
3.4 Prospective Growth Scenario
3.4.1 Form Growth Scenario
3.4.2 Type Growth Scenario
3.4.3 Origin Growth Scenario
3.4.4 Application Growth Scenario
3.5 COVID-19 Influence over Industry Growth
3.6 Porter’s Analysis
3.7 PESTEL Analysis
3.8 Value Chain & Supply Chain Analysis
3.9 Regulatory Framework
3.9.1 North America
3.9.2 Europe
3.9.3 APAC
3.9.4 LATAM
3.9.5 MEA
3.10 Technology Overview
3.11 Market Share Analysis, 2020
3.11.1 Company Positioning Overview, 2020
Chapter 4 Flavors Market, By Form
4.1 Form Outlook
4.2 Liquid & Gel
4.2.1 Market Size, By Region, 2016-2026 (USD Million)
4.3 Dry
4.3.1 Market Size, By Region, 2016-2026 (USD Million)
Chapter 5 Flavors Market, By Type
5.1 Type Outlook
5.2 Chocolate & Brown
5.2.1 Market Size, By Region, 2016-2026 (USD Million)
5.3 Vanilla
5.3.1 Market Size, By Region, 2016-2026 (USD Million)
5.4 Fruits & Nuts
5.4.1 Market Size, By Region, 2016-2026 (USD Million)
5.5 Dairy
5.5.1 Market Size, By Region, 2016-2026 (USD Million)
5.6 Spices & Savory
5.6.1 Market Size, By Region, 2016-2026 (USD Million)
5.7 Others
5.7.1 Market Size, By Region, 2016-2026 (USD Million)
Chapter 6 Flavors Market, By Origin
6.1 Origin Outlook
6.2 Natural
6.2.1 Market Size, By Region, 2016-2026 (USD Million)
6.3 Natural Identical
6.3.1 Market Size, By Region, 2016-2026 (USD Million)
6.4 Artificial/Synthetic
6.4.1 Market Size, By Region, 2016-2026 (USD Million)
Chapter 7 Flavors Market, By Application
7.1 Application Outlook
7.2 Food
5.2.1 Market Size, By Region, 2016-2026 (USD Million)
7.3 Beverages
7.3.1 Market Size, By Region, 2016-2026 (USD Million)
Chapter 8 Flavors Market, By Region
8.1 Regional outlook
8.2 North America
8.2.1 Market Size, By Country, 2016-2026 (USD Million)
8.2.2 Market Size, By Form, 2016-2026 (USD Million)
8.2.3 Market Size, By Type, 2016-2026 (USD Million)
8.2.4 Market Size, By Origin, 2016-2026 (USD Million)
8.2.5 Market Size, By Application, 2016-2026 (USD Million)
8.2.6 U.S.
8.2.6.1 Market Size, By Form, 2016-2026 (USD Million)
8.2.6.2 Market Size, By Type, 2016-2026 (USD Million)
8.2.6.3 Market Size, By Origin, 2016-2026 (USD Million)
8.2.6.4 Market Size, By Application, 2016-2026 (USD Million)
8.2.7 Canada
8.2.7.1 Market Size, By Form, 2016-2026 (USD Million)
8.2.7.2 Market Size, By Type, 2016-2026 (USD Million)
8.2.7.3 Market Size, By Origin, 2016-2026 (USD Million)
8.2.7.4 Market Size, By Application, 2016-2026 (USD Million)
8.3 Europe
8.3.1 Market Size, By Country, 2016-2026 (USD Million)
8.3.2 Market Size, By Form, 2016-2026 (USD Million)
8.3.3 Market Size, By Type, 2016-2026 (USD Million)
8.3.4 Market Size, By Origin, 2016-2026 (USD Million)
8.3.5 Market Size, By Application, 2016-2026 (USD Million)
8.3.6 Germany
8.3.6.1 Market Size, By Form, 2016-2026 (USD Million)
8.3.6.2 Market Size, By Type, 2016-2026 (USD Million)
8.3.6.3 Market Size, By Origin, 2016-2026 (USD Million)
8.3.6.4 Market Size, By Application, 2016-2026 (USD Million)
8.3.7 UK
8.3.7.1 Market Size, By Form, 2016-2026 (USD Million)
8.3.7.2 Market Size, By Type, 2016-2026 (USD Million)
8.3.7.3 Market Size, By Origin, 2016-2026 (USD Million)
8.3.7.4 Market Size, By Application, 2016-2026 (USD Million)
8.3.8 France
8.3.8.1 Market Size, By Form, 2016-2026 (USD Million)
8.3.8.2 Market Size, By Type, 2016-2026 (USD Million)
8.3.8.3 Market Size, By Origin, 2016-2026 (USD Million)
8.3.8.4 Market Size, By Application, 2016-2026 (USD Million)
8.3.9 Italy
8.3.9.1 Market Size, By Form, 2016-2026 (USD Million)
8.3.9.2 Market Size, By Type, 2016-2026 (USD Million)
8.3.9.3 Market Size, By Origin, 2016-2026 (USD Million)
8.3.9.4 Market Size, By Application, 2016-2026 (USD Million)
8.3.10 Spain
8.3.10.1 Market Size, By Form, 2016-2026 (USD Million)
8.3.10.2 Market Size, By Type, 2016-2026 (USD Million)
8.3.10.3 Market Size, By Origin, 2016-2026 (USD Million)
8.3.10.4 Market Size, By Application, 2016-2026 (USD Million)
8.3.11 Russia
8.3.11.1 Market Size, By Form, 2016-2026 (USD Million)
8.3.11.2 Market Size, By Type, 2016-2026 (USD Million)
8.3.11.3 Market Size, By Origin, 2016-2026 (USD Million)
8.3.11.4 Market Size, By Application, 2016-2026 (USD Million)
8.4 Asia Pacific
8.4.1 Market Size, By Country, 2016-2026 (USD Million)
8.4.2 Market Size, By Form, 2016-2026 (USD Million)
8.4.3 Market Size, By Type, 2016-2026 (USD Million)
8.4.4 Market Size, By Origin, 2016-2026 (USD Million)
8.4.5 Market Size, By Application, 2016-2026 (USD Million)
8.4.6 China
8.4.6.1 Market Size, By Form, 2016-2026 (USD Million)
8.4.6.2 Market Size, By Type, 2016-2026 (USD Million)
8.4.6.3 Market Size, By Origin, 2016-2026 (USD Million)
8.4.6.4 Market Size, By Application, 2016-2026 (USD Million)
8.4.7 India
8.4.7.1 Market Size, By Form, 2016-2026 (USD Million)
8.4.7.2 Market Size, By Type, 2016-2026 (USD Million)
8.4.7.3 Market Size, By Origin, 2016-2026 (USD Million)
8.4.7.4 Market Size, By Application, 2016-2026 (USD Million)
8.4.8 Japan
8.4.8.1 Market Size, By Form, 2016-2026 (USD Million)
8.4.8.2 Market Size, By Type, 2016-2026 (USD Million)
8.4.8.3 Market Size, By Origin, 2016-2026 (USD Million)
8.4.8.4 Market Size, By Application, 2016-2026 (USD Million)
8.4.9 Australia
8.4.9.1 Market Size, By Form, 2016-2026 (USD Million)
8.4.9.2 Market size, By Type, 2016-2026 (USD Million)
8.4.9.3 Market size, By Origin, 2016-2026 (USD Million)
8.4.9.4 Market size, By Application, 2016-2026 (USD Million)
8.4.10 South Korea
8.4.10.1 Market Size, By Form, 2016-2026 (USD Million)
8.4.10.2 Market Size, By Type, 2016-2026 (USD Million)
8.4.10.3 Market Size, By Origin, 2016-2026 (USD Million)
8.4.10.4 Market Size, By Application, 2016-2026 (USD Million)
8.5 Latin America
8.5.1 Market Size, By Country, 2016-2026 (USD Million)
8.5.2 Market Size, By Form, 2016-2026 (USD Million)
8.5.3 Market Size, By Type, 2016-2026 (USD Million)
8.5.4 Market Size, By Origin, 2016-2026 (USD Million)
8.5.5 Market Size, By Application, 2016-2026 (USD Million)
8.5.6 Brazil
8.5.6.1 Market Size, By Form, 2016-2026 (USD Million)
8.5.6.2 Market Size, By Type, 2016-2026 (USD Million)
8.5.6.3 Market Size, By Origin, 2016-2026 (USD Million)
8.5.6.4 Market Size, By Application, 2016-2026 (USD Million)
8.5.7 Mexico
8.5.7.1 Market Size, By Form, 2016-2026 (USD Million)
8.5.7.2 Market Size, By Type, 2016-2026 (USD Million)
8.5.7.3 Market Size, By Origin, 2016-2026 (USD Million)
8.5.7.4 Market Size, By Application, 2016-2026 (USD Million)
8.5.8 Argentina
8.5.8.1 Market Size, By Form, 2016-2026 (USD Million)
8.5.8.2 Market Size, By Type, 2016-2026 (USD Million)
8.5.8.3 Market Size, By Origin, 2016-2026 (USD Million)
8.5.8.4 Market Size, By Application, 2016-2026 (USD Million)
8.6 MEA
8.6.1 Market Size, By Country, 2016-2026 (USD Million)
8.6.2 Market Size, By Form, 2016-2026 (USD Million)
8.6.3 Market Size, By Type, 2016-2026 (USD Million)
8.6.4 Market Size, By Origin, 2016-2026 (USD Million)
8.6.5 Market Size, By Application, 2016-2026 (USD Million)
8.6.6 Saudi Arabia
8.6.6.1 Market Size, By Form, 2016-2026 (USD Million)
8.6.6.2 Market Size, By Type, 2016-2026 (USD Million)
8.6.6.3 Market Size, By Origin, 2016-2026 (USD Million)
8.6.6.4 Market Size, By Application, 2016-2026 (USD Million)
8.6.7 UAE
8.6.7.1 Market Size, By Form, 2016-2026 (USD Million)
8.6.7.2 Market Size, By Type, 2016-2026 (USD Million)
8.6.7.3 Market Size, By Origin, 2016-2026 (USD Million)
8.6.7.4 Market Size, By Application, 2016-2026 (USD Million)
8.6.8 South Africa
8.6.8.1 Market Size, By Form, 2016-2026 (USD Million)
8.6.8.2 Market Size, By Type, 2016-2026 (USD Million)
8.6.8.3 Market Size, By Origin, 2016-2026 (USD Million)
8.6.8.4 Market Size, By Application, 2016-2026 (USD Million)
Chapter 9 Company Landscape
9.1 Competitive Analysis, 2020
9.2 FirmenichSA
9.2.1 Company Overview
9.2.2 Financial Analysis
9.2.3 Strategic Positioning
9.2.4 Info Graphic Analysis
9.3 Frutarom Industries Ltd.
9.3.1 Company Overview
9.3.2 Financial Analysis
9.3.3 Strategic Positioning
9.3.4 Info Graphic Analysis
9.4 Givauda International SA
9.4.1 Company Overview
9.4.2 Financial Analysis
9.4.3 Strategic Positioning
9.4.4 Info Graphic Analysis
9.5 Huabao International Holdings Limited
9.5.1 Company Overview
9.5.2 Financial Analysis
9.5.3 Strategic Positioning
9.5.4 Info Graphic Analysis
9.6 Kerry Group, Plc.
9.6.1 Company Overview
9.6.2 Financial Analysis
9.6.3 Strategic Positioning
9.6.4 Info Graphic Analysis
9.7 Robertet SA
9.7.1 Company Overview
9.7.2 Financial Analysis
9.7.3 Strategic Positioning
9.7.4 Info Graphic Analysis
9.8 S H Kelkar and Company Limited.
9.8.1 Company Overview
9.8.2 Financial Analysis
9.8.3 Strategic Positioning
9.8.4 Info Graphic Analysis
9.9 Sensient Technologies Corporation
7.9.1 Company Overview
9.9.2 Financial Analysis
9.9.3 Strategic Positioning
9.9.4 Info Graphic Analysis
9.10 Symrise AG
9.10.1 Company Overview
9.10.2 Financial Analysis
9.10.3 Strategic Positioning
9.10.4 Info Graphic Analysis
9.11 Takasago International Corporation
9.11.1 Company Overview
9.11.2 Financial Analysis
9.11.3 Strategic Positioning
9.11.4 Info Graphic Analysis
9.12 Other Companies
9.12.1 Company Overview
9.12.2 Financial Analysis
9.12.3 Strategic Positioning
9.12.4 Info Graphic Analysis
The Global Flavors Market has been studied from the year 2019 till 2026. However, the CAGR provided in the report is from the year 2021 to 2026. The research methodology involved three stages: Desk research, Primary research, and Analysis & Output from the entire research process.

The desk research involved a robust background study which meant referring to paid and unpaid databases to understand the market dynamics; mapping contracts from press releases; identifying the key players in the market, studying their product portfolio, competition level, annual reports/SEC filings & investor presentations; and learning the demand and supply-side analysis for the Flavors Market.

The primary research activity included telephonic conversations with more than 50 tier 1 industry consultants, distributors, and end-use product manufacturers.

Finally, based on the above thorough research process, an in-depth analysis was carried out considering the following aspects: market attractiveness, current & future market trends, market share analysis, SWOT analysis of the company and customer analytics.

Frequently Asked Questions
![Global Flavors Market Size, Trends & Analysis - Forecasts to 2026 By Form (Liquid & Gel, Dry), By Origin (Natural, Natural Identical, and Artificial/Synthetic), By Type (Chocolate & Brown, Vanilla, Fruits & Nuts, Dairy, Spices & Savory, and Others), By Application (Food [Dairy Products, Confectionery Products, Bakery Products, Meat Products, and Others], Beverages [Juices & Juice Concentrates, Functional Drinks, Carbonated Soft Drinks, Others]), By Region (North America, Asia Pacific, Europe, Latin America, Middle East & Africa); Competitive Landscape, Company Market Share Analysis, and Competitor Analysis](https://www.globalmarketestimates.com/images/cat/Food & Beverages.png)
This FREE sample includes market data points, ranging from trend analyses to market estimates & forecasts. See for yourself.
Or view our licence options:
Tailor made solutions just for you
80% of our clients seek made-to-order reports. How do you want us to tailor yours?
OUR CLIENTS


