This report was recently updated on August 22 2025 with the latest and most recent
market numbers
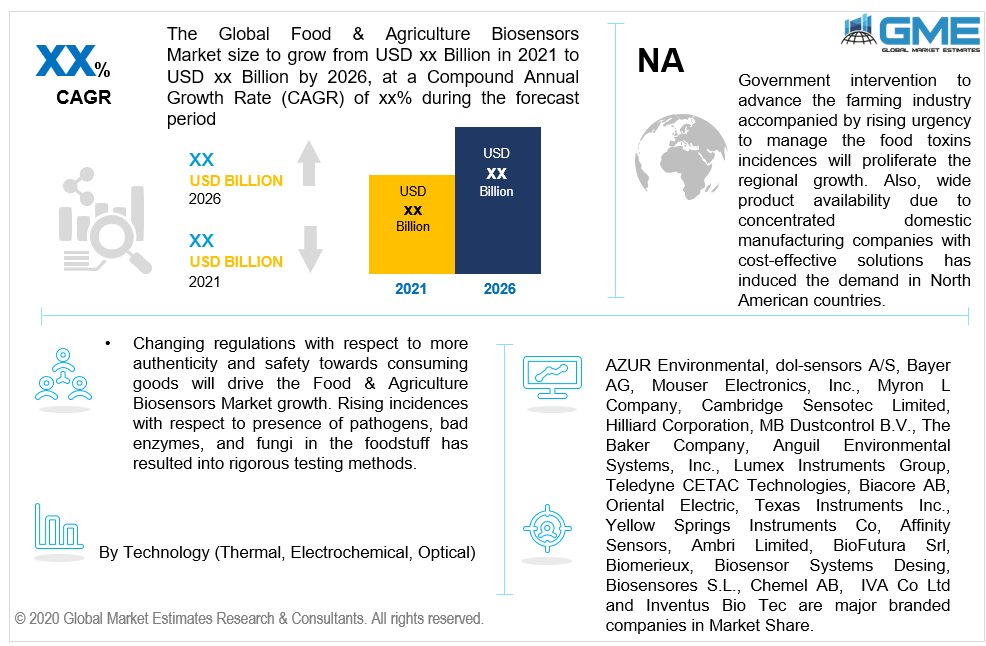
Global Food & Agriculture Biosensors Market Size, Trends & Analysis - Forecasts to 2026 By Technology (Thermal, Electrochemical, Optical), By Application (Food Toxin, Environmental and Agriculture), By Region (North America, Asia Pacific, Europe, Latin America, Middle East & Africa); End-User Landscape, Company Market Share Analysis, and Competitor Analysis
Technological advancement in the food & agriculture sector has opened new avenues in the industry. Providing facilities and innovations such as drones, satellites, and biosensors makes the industry more advanced in nature. Food & Agriculture Biosensors provide various advancements in the respective industry related to pathogen detection, soil quality, and toxin level in the production. This information not only uplifts the market but also provides an analytical viewpoint to deal with future concerns.
The foremost objective is to adopt this equipment is to improve farming activities and methods. These devices help the industry in identifying the cause and affect the behaviour of the production pattern. Long-term sustainability and improving production quality are among the major factors to adopt the Food & Agriculture Biosensors in the respective industry. Ability to read and understand the behavioral pattern will result in providing statistical data which can be helpful in future decision making or performing predictive analysis.
Changing regulations with respect to more authenticity and safety towards consuming goods will drive the Food & Agriculture Biosensors Market growth. Rising incidences with respect to the presence of pathogens, bad enzymes, and fungi in the foodstuff have resulted in rigorous testing methods. Moreover, cases with the presence of heavy metals in the products instigated the rapid development in the food safety testing market.
Under the farming segment, increasing demand for ecological solutions to achieve long-term sustainability will drive the Agriculture Biosensors Demand. These advanced devices and methods allow the farming industry to understand the root cause of a certain crop production behavior which can be soil deficiency, water deficiency, presence of pesticides, or insufficient soil moisture. However, factors such as continuous internet connectivity, lack of technical know-how among farmers, and insufficient funding may hinder the market in developing countries.
Thermal, electrochemical, and optical are three key identified technologies involved in the Food & Agriculture Biosensors Market. Electrochemical technology will lead the industry share during the forecast period. Direct monitoring and more efficient analysis of enzymes and other living cells are key success factors to drive the demand in this segment. The electrochemical technology offers an early disease diagnosis and provides a fast response with a more sensitive and practical approach.
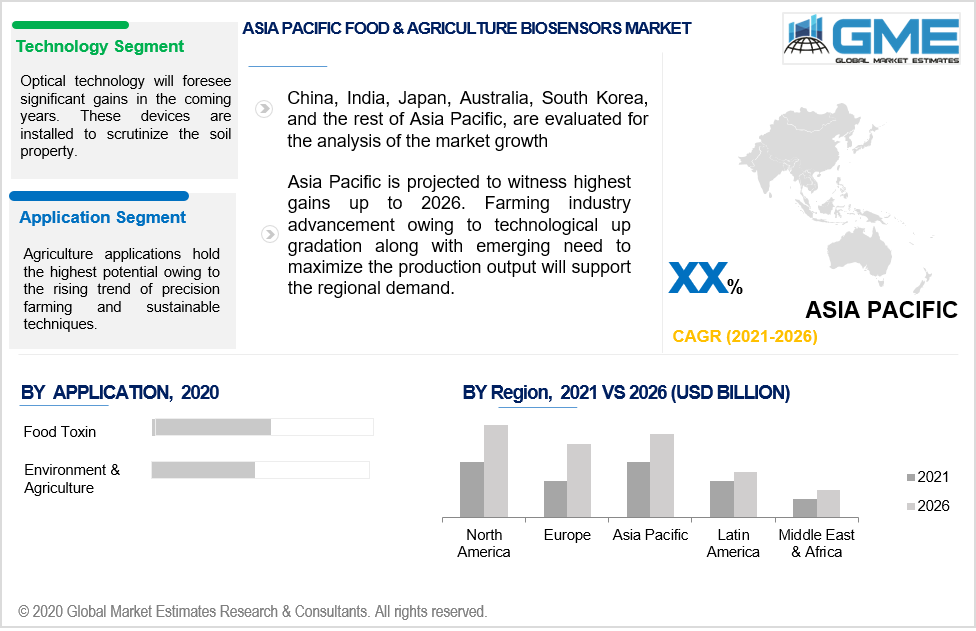
Optical technology will foresee significant gains in the coming years. These devices are installed to scrutinize the soil property. Optical biosensors are installed on drones, satellites, or robots to study and regulate moisture content and organic matter of the soil. Farms need constant monitoring to evade any catastrophe on the farmland. Thus, numerous devices are installed to observe various aspects related to the farm location, humidity, water retention ability, soil conditions, and airflow.
The rising need to identify and rectify the toxins present in food has instigated the demand for biosensors in the food industry. High demand from regulatory bodies to thoroughly check the foodstuff and avoid any kind of toxic substance which can be hazardous to the consumer will drive the market. Deterioration, detection of salmonella, bacteria, fungi, allergens, and heavy metals are major parameters checked through these electronic devices.
Agriculture applications hold the highest potential owing to the rising trend of precision farming and sustainable techniques. Parameters such as moisture resistance, soil quality, humidity, water level, and detection of herbicide & pesticides are checked under these applications. Optimum resource utilization, quality output, energy conservation, and futuristic revolution are key success factors to drive demand in this segment.
North America, led by the U.S. Food & Agriculture Biosensors Market will dominate the regional share during the forecast period. Government intervention to advance the farming industry accompanied by rising urgency to manage the food toxins incidences will proliferate the regional growth. Also, wide product availability due to concentrated domestic manufacturing companies with cost-effective solutions has induced the demand in North American countries.
The Asia Pacific is projected to witness the highest gains up to 2026. Farming industry advancement owing to technological up-gradation along with emerging need to maximize the production output will support the regional demand. China, India, Japan, and Indonesia are among the key lucrative countries.
European market growth is positively affected due to the increasing technological advancement in the farming industry. Farmers are becoming more aware and working towards maximizing the full potential. Moreover, indulgence towards sustainable practice is another reason to adopt these technologies to minimize resource usage and conserve the resources.
AZUR Environmental, dol-sensors A/S, Bayer AG, Mouser Electronics, Inc., Myron L Company, Cambridge Sensotec Limited, Hilliard Corporation, MB Dustcontrol B.V., The Baker Company, Anguil Environmental Systems, Inc., Lumex Instruments Group, Teledyne CETAC Technologies, Biacore AB, Oriental Electric, Texas Instruments Inc., Yellow Springs Instruments Co, Affinity Sensors, Ambri Limited, BioFutura Srl, Biomerieux, Biosensor Systems Desing, Biosensores S.L., Chemel AB, IVA Co Ltd and Inventus Bio Tec are major branded companies in the Food & Agriculture Biosensors Market Share.
Please note: This is not an exhaustive list of companies profiled in the report.
The industry is partially consolidated and competitive due to the existence of a large number of industry players with diversified service offerings and product portfolios. But, product advancement and technological up-gradation will act as a key point of difference in front of customers.
Chapter 1 Methodology
1.1 Market scope & definitions
1.2 Estimates & forecast calculation
1.3 Historical data overview and validation
1.4 Data sources
1.4.1 Secondary
1.4.2 Primary
Chapter 2 Report Outlook
2.1 Food & Agriculture Biosensors Market industry overview, 2016-2026
2.1.1 Industry overview
2.1.2 Technology overview
2.1.3 Application overview
2.1.4 Regional overview
Chapter 3 Food & Agriculture Biosensors Market Trends
3.1 Market segmentation
3.2 Industry background, 2016-2026
3.3 Market key trends
3.3.1 Positive trends
3.3.2 Industry challenges
3.4 Prospective growth scenario
3.4.1 Technology growth scenario
3.4.2 Application growth scenario
3.5 COVID-19 influence over industry growth
3.6 Porter’s analysis
3.7 PESTEL analysis
3.8 Value chain & supply chain analysis
3.9 Regulatory framework
3.9.1 North America
3.9.2 Europe
3.9.3 APAC
3.9.4 LATAM
3.9.5 MEA
3.10 Product innovation
3.11 Market share analysis, 2020
3.11.1 Company positioning overview, 2020
Chapter 4 Food & Agriculture Biosensors Market, By Technology
4.1 Technology Outlook
4.2 Thermal
4.2.1 Market size, by region, 2016-2026 (USD Million)
4.3 Electrochemical
4.3.1 Market size, by region, 2016-2026 (USD Million)
4.4 Optical
4.4.1 Market size, by region, 2016-2026 (USD Million)
4.5 Others
4.5.1 Market size, by region, 2016-2026 (USD Million)
Chapter 5 Food & Agriculture Biosensors Market, By Application
5.1 Application Outlook
5.2 Food Toxins
5.2.1 Market size, by region, 2016-2026 (USD Million)
5.3 Environment & Agriculture
5.3.1 Market size, by region, 2016-2026 (USD Million)
Chapter 6 Food & Agriculture Biosensors Market, By Region
6.1 Regional outlook
6.2 North America
6.2.1 Market size, by country 2016-2026 (USD Million)
6.2.2 Market size, by technology, 2016-2026 (USD Million)
6.2.3 Market size, by application, 2016-2026 (USD Million)
6.2.4 U.S.
6.2.4.1 Market size, by technology, 2016-2026 (USD Million)
6.2.4.2 Market size, by application, 2016-2026 (USD Million)
6.2.5 Canada
6.2.5.1 Market size, by technology, 2016-2026 (USD Million)
6.2.5.2 Market size, by application, 2016-2026 (USD Million)
6.3 Europe
6.3.1 Market size, by country 2016-2026 (USD Million)
6.3.2 Market size, by technology, 2016-2026 (USD Million)
6.3.3 Market size, by application, 2016-2026 (USD Million)
6.3.4 Germany
6.2.4.1 Market size, by technology, 2016-2026 (USD Million)
6.2.4.2 Market size, by application, 2016-2026 (USD Million)
6.3.5 UK
6.3.5.1 Market size, by technology, 2016-2026 (USD Million)
6.3.5.2 Market size, by application, 2016-2026 (USD Million)
6.3.6 France
6.3.6.1 Market size, by technology, 2016-2026 (USD Million)
6.3.6.2 Market size, by application, 2016-2026 (USD Million)
6.3.7 Italy
6.3.7.1 Market size, by technology, 2016-2026 (USD Million)
6.3.7.2 Market size, by application, 2016-2026 (USD Million)
6.3.8 Spain
6.3.8.1 Market size, by technology, 2016-2026 (USD Million)
6.3.8.2 Market size, by application, 2016-2026 (USD Million)
6.3.9 Russia
6.3.9.1 Market size, by technology, 2016-2026 (USD Million)
6.3.9.2 Market size, by application, 2016-2026 (USD Million)
6.4 Asia Pacific
6.4.1 Market size, by country 2016-2026 (USD Million)
6.4.2 Market size, by technology, 2016-2026 (USD Million)
6.4.3 Market size, by application, 2016-2026 (USD Million)
6.4.4 China
6.4.4.1 Market size, by technology, 2016-2026 (USD Million)
6.4.4.2 Market size, by application, 2016-2026 (USD Million)
6.4.5 India
6.4.5.1 Market size, by technology, 2016-2026 (USD Million)
6.4.5.2 Market size, by application, 2016-2026 (USD Million)
6.4.6 Japan
6.4.6.1 Market size, by technology, 2016-2026 (USD Million)
6.4.6.2 Market size, by application, 2016-2026 (USD Million)
6.4.7 Australia
6.4.7.1 Market size, by technology, 2016-2026 (USD Million)
6.4.7.2 Market size, by application, 2016-2026 (USD Million)
6.4.8 South Korea
6.4.8.1 Market size, by technology, 2016-2026 (USD Million)
6.4.8.2 Market size, by application, 2016-2026 (USD Million)
6.5 Latin America
6.5.1 Market size, by country 2016-2026 (USD Million)
6.5.2 Market size, by technology, 2016-2026 (USD Million)
6.5.3 Market size, by application, 2016-2026 (USD Million)
6.5.4 Brazil
6.5.4.1 Market size, by technology, 2016-2026 (USD Million)
6.5.4.2 Market size, by application, 2016-2026 (USD Million)
6.5.5 Mexico
6.5.5.1 Market size, by technology, 2016-2026 (USD Million)
6.5.5.2 Market size, by application, 2016-2026 (USD Million)
6.5.6 Argentina
6.5.6.1 Market size, by technology, 2016-2026 (USD Million)
6.5.6.2 Market size, by application, 2016-2026 (USD Million)
6.6 MEA
6.6.1 Market size, by country 2016-2026 (USD Million)
6.6.2 Market size, by technology, 2016-2026 (USD Million)
6.6.3 Market size, by application, 2016-2026 (USD Million)
6.6.4 Saudi Arabia
6.6.4.1 Market size, by technology, 2016-2026 (USD Million)
6.6.4.2 Market size, by application, 2016-2026 (USD Million)
6.6.5 UAE
6.6.5.1 Market size, by technology, 2016-2026 (USD Million)
6.6.5.2 Market size, by application, 2016-2026 (USD Million)
6.6.6 South Africa
6.6.6.1 Market size, by technology, 2016-2026 (USD Million)
6.6.6.2 Market size, by application, 2016-2026 (USD Million)
Chapter 7 Company Landscape
7.1 Competitive analysis, 2020
7.2 AZUR Environmental
7.2.1 Company overview
7.2.2 Financial analysis
7.2.3 Strategic positioning
7.2.4 Info graphic analysis
7.3 dol-sensors A/
7.3.1 Company overview
7.3.2 Financial analysis
7.3.3 Strategic positioning
7.3.4 Info graphic analysis
7.4 Bayer AG
7.4.1 Company overview
7.4.2 Financial analysis
7.4.3 Strategic positioning
7.4.4 Info graphic analysis
7.5 Cranfield Biotechnology Centre
7.5.1 Company overview
7.5.2 Financial analysis
7.5.3 Strategic positioning
7.5.4 Info graphic analysis
7.6 Mouser Electronics, Inc.
7.6.1 Company overview
7.6.2 Financial analysis
7.6.3 Strategic positioning
7.6.4 Info graphic analysis
7.7 Myron L Company
7.7.1 Company overview
7.7.2 Financial analysis
7.7.3 Strategic positioning
7.7.4 Info graphic analysis
7.8 Cambridge Sensotec Limited
7.8.1 Company overview
7.8.2 Financial analysis
7.8.3 Strategic positioning
7.8.4 Info graphic analysis
7.9 Hilliard Corporation
7.9.1 Company overview
7.9.2 Financial analysis
7.9.3 Strategic positioning
7.9.4 Info graphic analysis
7.10 MB Dustcontrol B.V.
7.10.1 Company overview
7.10.2 Financial analysis
7.10.3 Strategic positioning
7.10.4 Info graphic analysis
7.11 The Baker Company
7.11.1 Company overview
7.11.2 Financial analysis
7.11.3 Strategic positioning
7.11.4 Info graphic analysis
7.12 Anguil Environmental Systems, Inc.
7.12.1 Company overview
7.12.2 Financial analysis
7.12.3 Strategic positioning
7.12.4 Info graphic analysis
7.13 Lumex Instruments Group
7.13.1 Company overview
7.13.2 Financial analysis
7.13.3 Strategic positioning
7.13.4 Info graphic analysis
7.14 Teledyne CETAC Technologies
7.14.1 Company overview
7.14.2 Financial analysis
7.14.3 Strategic positioning
7.14.4 Info graphic analysis
7.15 Biacore AB
7.15.1 Company overview
7.15.2 Financial analysis
7.15.3 Strategic positioning
7.15.4 Info graphic analysis
7.16 Oriental electric
7.16.1 Company overview
7.16.2 Financial analysis
7.16.3 Strategic positioning
7.16.4 Info graphic analysis
7.17 Texas Instruments Inc.
7.17.1 Company overview
7.17.2 Financial analysis
7.17.3 Strategic positioning
7.17.4 Info graphic analysis
7.18 Yellow Springs Instruments Co
7.18.1 Company overview
7.18.2 Financial analysis
7.18.3 Strategic positioning
7.18.4 Info graphic analysis
7.19 Affinity Sensors
7.19.1 Company overview
7.19.2 Financial analysis
7.19.3 Strategic positioning
7.19.4 Info graphic analysis
7.20 Ambri Limited
7.20.1 Company overview
7.20.2 Financial analysis
7.20.3 Strategic positioning
7.20.4 Info graphic analysis
7.21 BioFutura Srl
7.21.1 Company overview
7.21.2 Financial analysis
7.21.3 Strategic positioning
7.21.4 Info graphic analysis
7.22 Biomerieux
7.22.1 Company overview
7.22.2 Financial analysis
7.22.3 Strategic positioning
7.22.4 Info graphic analysis
7.23 Biosensores S.L.
7.23.1 Company overview
7.23.2 Financial analysis
7.23.3 Strategic positioning
7.23.4 Info graphic analysis
7.24 Chemel AB
7.24.1 Company overview
7.24.2 Financial analysis
7.24.3 Strategic positioning
7.24.4 Info graphic analysis
7.25 IVA Co Ltd
7.25.1 Company overview
7.25.2 Financial analysis
7.25.3 Strategic positioning
7.25.4 Info graphic analysis
7.26 Inventus Bio Tec
7.26.1 Company overview
7.26.2 Financial analysis
7.26.3 Strategic positioning
7.26.4 Info graphic analysis
The Global Food & Agriculture Biosensors Market has been studied from the year 2019 till 2026. However, the CAGR provided in the report is from the year 2021 to 2026. The research methodology involved three stages: Desk research, Primary research, and Analysis & Output from the entire research process.

The desk research involved a robust background study which meant referring to paid and unpaid databases to understand the market dynamics; mapping contracts from press releases; identifying the key players in the market, studying their product portfolio, competition level, annual reports/SEC filings & investor presentations; and learning the demand and supply-side analysis for the Food & Agriculture Biosensors Market.

The primary research activity included telephonic conversations with more than 50 tier 1 industry consultants, distributors, and end-use product manufacturers.

Finally, based on the above thorough research process, an in-depth analysis was carried out considering the following aspects: market attractiveness, current & future market trends, market share analysis, SWOT analysis of the company and customer analytics.


This FREE sample includes market data points, ranging from trend analyses to market estimates & forecasts. See for yourself.
Or view our licence options:
Tailor made solutions just for you
80% of our clients seek made-to-order reports. How do you want us to tailor yours?
OUR CLIENTS


