This report was recently updated on August 26 2025 with the latest and most recent
market numbers
Global Geranylgeraniol Market Size, Trends & Analysis - Forecasts to 2026 By Form (Liquid, Powder), By Source (Naturally Synthesised, Chemically Synthesised), By Application (Cosmetic, Healthcare, Food, Others), By Region (North America, Asia Pacific, Europe, Latin America, Middle East & Africa); End-User Landscape, Company Market Share Analysis, and Competitor Analysis
Rising demand for healthy aging products to deal with health problems such as skeletal muscle protein, hormone regulation, and bone health will drive the geranylgeraniol demand during the forecast period. As the human body’s geranylgeraniol production drops with aging which will result in early aging problems. Thus, the introduction of these nutrient supplements will help in maintaining a healthy lifestyle.
Geranylgeraniol is a vital building block in producing the vitamin k2, testosterone, and coenzymes which starts declining with aging. Therefore, consumption of supplements, medicines or any other product containing these compounds will help in restoring the body’s nutrient balance.
The shift in preference towards health supplements and other aging products will influence the global geranylgeraniol market growth. Health crises such as the Covid-19 pandemic have also induced demand for products that help in maintaining the body's metabolic system. Now it has become essential to add these substitutes to lead a healthy lifestyle.
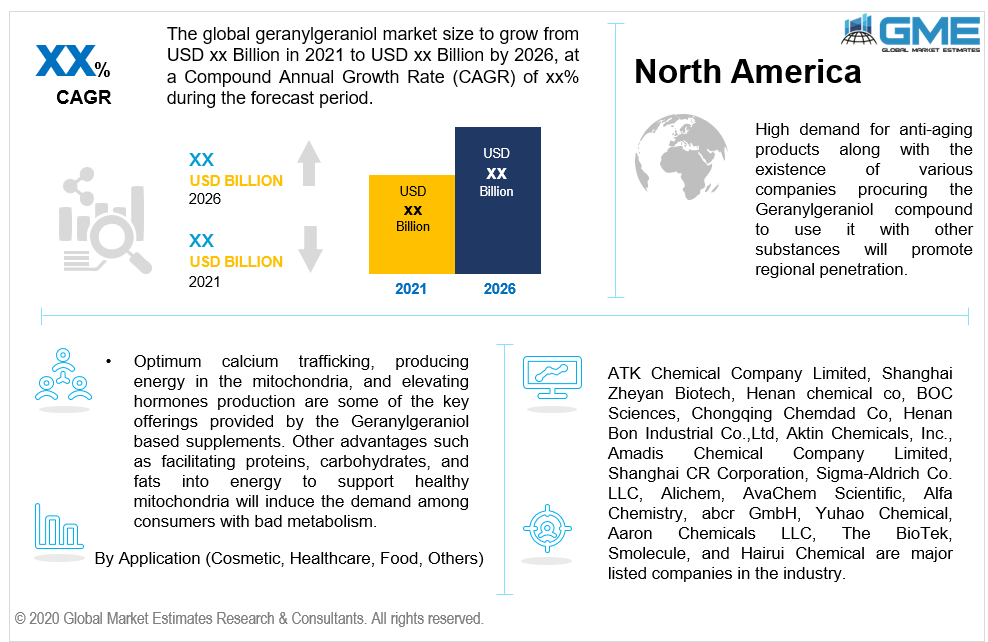
Optimum calcium trafficking, producing energy in the mitochondria, and elevating hormone production are some of the key offerings provided by the geranylgeraniol-based supplements. Other advantages such as facilitating proteins, carbohydrates, and fats into energy to support healthy mitochondria will induce the demand among consumers with bad metabolism.
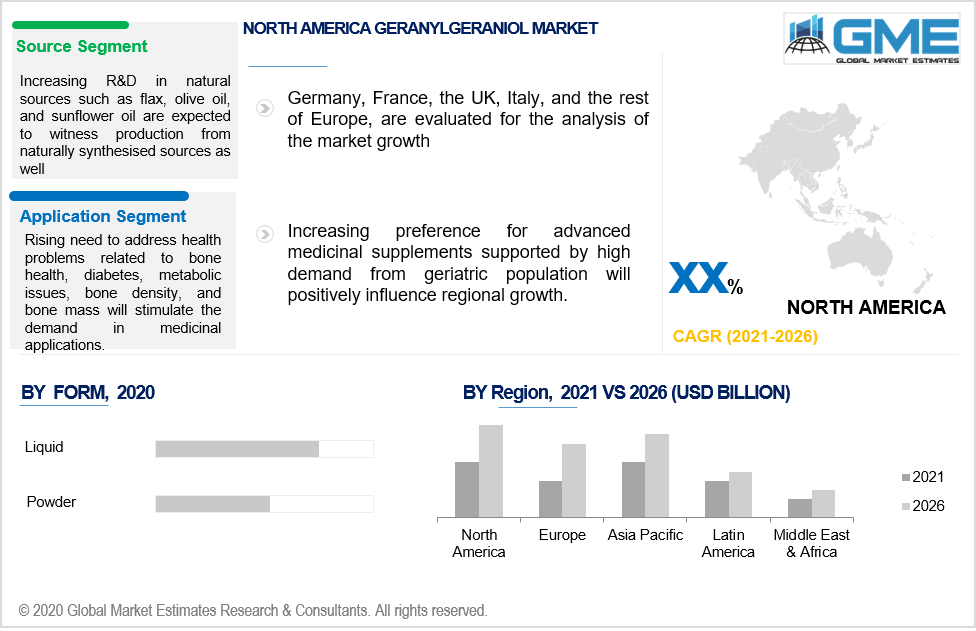
Powder and liquid are major supplied forms involved in the geranylgeraniol market. Liquid forms are the widely acceptable material form in cosmetic and medicinal applications. High suitability and compatibility to blend with other chemical compounds are key supporting factors to drive demand in this segment.
Under the geranylgeraniol source segment, the market is divided into naturally synthesized and chemically synthesized. The latter one is projected to lead the source segment owing to a wide variety of substances to extract geranylgeraniol at a large scale with economical pricing. However, increasing R&D in natural sources such as flax, olive oil, and sunflower oil are expected to witness production from naturally synthesized sources as well.
By application, the industry is segmented into cosmetics, medicinal, and food. Medicinal applications will witness the highest growth in the coming years. The rising need to address health problems related to bone health, diabetes, metabolic issues, bone density, and bone mass will stimulate the geranylgeraniol demand in medicinal applications.
The other promising application is the cosmetic industry which will face high penetration in the coming years. The material is widely used in the production of cosmetic products related to acne, aging, and psoriasis. Other applications such as fragrance are also gaining attention in the industry. Various prospects are being discovered for blending the geranylgeraniol with other nutrients for diversified applications.
The Asia Pacific region is expected to witness the highest gains during the forecast period. The presence of a large number of manufacturers along with increasing investment in the cosmetic industry will influence the regional industry growth. The shift in preference towards sustainably sourced products in food and medicine owing to the Covid-19 pandemic impact will offer lucrative opportunities in the coming years. China, India, Japan, and South Korea are expected to contribute the maximum revenue.
North America Geranylgeraniol Market will foresee significant growth up to 2026. High demand for anti-aging products along with the existence of various companies procuring the geranylgeraniol compound to use with other substances will promote regional penetration. Increasing demand for health supplements blended with other vitamins and minerals has influenced the penetration. Increasing consumer knowledge accompanied by affordability will result in high product penetration during the forecast period.
Europe, led by Germany and the UK holds strong potential in the industry. Increasing preference for advanced medicinal supplements supported by high demand from the geriatric population will positively influence regional growth.
ATK Chemical Company Limited, Shanghai Zheyan Biotech, Henan chemical co, BOC Sciences, Chongqing Chemdad Co, Henan Bon Industrial Co.,Ltd, Aktin Chemicals, Inc., Amadis Chemical Company Limited, Shanghai CR Corporation, Sigma-Aldrich Co. LLC, Alichem, AvaChem Scientific, Alfa Chemistry, abcr GmbH, Yuhao Chemical, Aaron Chemicals LLC, The BioTek, Smolecule, and Hairui Chemical are major listed companies in the industry.
Please note: This is not an exhaustive list of companies profiled in the report.
Global Geranylgeraniol Company Market Share is in its nascent stage and fragmented in nature. Consistent product innovation and application development makes the market more dynamic. End-use companies offering final products are consistently entering the market to provide numerous products in the field of cosmetics, medicines, and food.
Other notable players include Wilshire Technologies, Ambeed, Acorn PharmaTech, AbaChemScene, Sinfoo Biotech, Ambinter, BOC Sciences, Glentham Life Sciences Ltd., ZINC, AK Scientific, Inc., Acadechem, Biosynth Carbosynth, Key Organics/BIONET, AKos Consulting & Solutions and PetroEuroAsia.
Chapter 1 Methodology
1.1 Market scope & definitions
1.2 Estimates & forecast calculation
1.3 Historical data overview and validation
1.4 Data sources
1.4.1 Secondary
1.4.2 Primary
Chapter 2 Report Outlook
2.1 Geranylgeraniol industry overview, 2016-2026
2.1.1 Industry overview
2.1.2 Form overview
2.1.3 Source overview
2.1.4 Application overview
2.1.5 Regional overview
Chapter 3 Geranylgeraniol Market Trends
3.1 Market segmentation
3.2 Industry background, 2016-2026
3.3 Market key trends
3.3.1 Positive trends
3.3.2 Industry challenges
3.4 Prospective growth scenario
3.4.1 Type growth scenario
3.4.2 Application growth scenario
3.5 COVID-19 influence over industry growth
3.6 Porter’s analysis
3.7 PESTEL analysis
3.8 Value chain & supply chain analysis
3.9 Regulatory framework
3.9.1 North America
3.9.2 Europe
3.9.3 APAC
3.9.4 LATAM
3.9.5 MEA
3.10 Technology overview
3.11 Market share analysis, 2020
3.11.1 Company positioning overview, 2020
Chapter 4 Geranylgeraniol Market, By Form
4.1 Form Outlook
4.2 Liquid
4.2.1 Market size, by region, 2016-2026 (USD Million)
4.3 Powder
4.3.1 Market size, by region, 2016-2026 (USD Million)
Chapter 5 Geranylgeraniol Market, By Source
5.1 Source Outlook
5.2 Naturally Synthesised
5.2.1 Market size, by region, 2016-2026 (USD Million)
5.3 Chemically Synthesised
5.3.1 Market size, by region, 2016-2026 (USD Million)
Chapter 6 Geranylgeraniol Market, By Application
6.1 Application Outlook
6.2 Cosmetic
6.2.1 Market size, by region, 2016-2026 (USD Million)
6.3 Medicinal
6.3.1 Market size, by region, 2016-2026 (USD Million)
6.4 Food
6.4.1 Market size, by region, 2016-2026 (USD Million)
6.5 Others
6.5.1 Market size, by region, 2016-2026 (USD Million)
Chapter 7 Geranylgeraniol Market, By Region
7.1 Regional outlook
7.2 North America
7.2.1 Market size, by country 2016-2026 (USD Million)
7.2.2 Market size, by form, 2016-2026 (USD Million)
7.2.3 Market size, by source, 2016-2026 (USD Million)
7.2.4 Market size, by application, 2016-2026 (USD Million)
7.2.5 U.S.
7.2.5.1 Market size, by form, 2016-2026 (USD Million)
7.2.5.2 Market size, by source, 2016-2026 (USD Million)
7.2.5.3 Market size, by application, 2016-2026 (USD Million)
7.2.6 Canada
7.2.6.1 Market size, by form, 2016-2026 (USD Million)
7.2.6.2 Market size, by source, 2016-2026 (USD Million)
7.2.6.3 Market size, by application, 2016-2026 (USD Million)
7.3 Europe
7.3.1 Market size, by country 2016-2026 (USD Million)
7.3.2 Market size, by form, 2016-2026 (USD Million)
7.3.3 Market size, by source, 2016-2026 (USD Million)
7.3.4 Market size, by application, 2016-2026 (USD Million)
7.3.5 Germany
7.2.5.1 Market size, by form, 2016-2026 (USD Million)
7.2.5.2 Market size, by source, 2016-2026 (USD Million)
7.2.5.3 Market size, by application, 2016-2026 (USD Million)
7.3.6 UK
7.3.6.1 Market size, by form, 2016-2026 (USD Million)
7.3.6.2 Market size, by source, 2016-2026 (USD Million)
7.3.6.3 Market size, by application, 2016-2026 (USD Million)
7.3.7 France
7.3.7.1 Market size, by form, 2016-2026 (USD Million)
7.3.7.2 Market size, by source, 2016-2026 (USD Million)
7.3.7.3 Market size, by application, 2016-2026 (USD Million)
7.3.8 Italy
7.3.8.1 Market size, by form, 2016-2026 (USD Million)
7.3.8.2 Market size, by source, 2016-2026 (USD Million)
7.3.8.3 Market size, by application, 2016-2026 (USD Million)
7.3.9 Spain
7.3.9.1 Market size, by form, 2016-2026 (USD Million)
7.3.9.2 Market size, by source, 2016-2026 (USD Million)
7.3.9.3 Market size, by application, 2016-2026 (USD Million)
7.3.10 Russia
7.3.10.1 Market size, by form, 2016-2026 (USD Million)
7.3.10.2 Market size, by source, 2016-2026 (USD Million)
7.3.10.3 Market size, by application, 2016-2026 (USD Million)
7.4 Asia Pacific
7.4.1 Market size, by country 2016-2026 (USD Million)
7.4.2 Market size, by form, 2016-2026 (USD Million)
7.4.3 Market size, by source, 2016-2026 (USD Million)
7.4.4 Market size, by application, 2016-2026 (USD Million)
7.4.5 China
7.4.5.1 Market size, by form, 2016-2026 (USD Million)
7.4.5.2 Market size, by source, 2016-2026 (USD Million)
7.4.5.3 Market size, by application, 2016-2026 (USD Million)
7.4.6 India
7.4.6.1 Market size, by form, 2016-2026 (USD Million)
7.4.6.2 Market size, by source, 2016-2026 (USD Million)
7.4.6.3 Market size, by application, 2016-2026 (USD Million)
7.4.7 Japan
7.4.7.1 Market size, by form, 2016-2026 (USD Million)
7.4.7.2 Market size, by source, 2016-2026 (USD Million)
7.4.7.3 Market size, by application, 2016-2026 (USD Million)
7.4.8 Australia
7.4.8.1 Market size, by form, 2016-2026 (USD Million)
7.4.8.2 Market size, by source, 2016-2026 (USD Million)
7.4.8.3 Market size, by application, 2016-2026 (USD Million)
7.4.9 South Korea
7.4.9.1 Market size, by form, 2016-2026 (USD Million)
7.4.9.2 Market size, by source, 2016-2026 (USD Million)
7.4.9.3 Market size, by application, 2016-2026 (USD Million)
7.5 Latin America
7.5.1 Market size, by country 2016-2026 (USD Million)
7.5.2 Market size, by form, 2016-2026 (USD Million)
7.5.3 Market size, by source, 2016-2026 (USD Million)
7.5.4 Market size, by application, 2016-2026 (USD Million)
7.5.5 Brazil
7.5.5.1 Market size, by form, 2016-2026 (USD Million)
7.5.5.2 Market size, by source, 2016-2026 (USD Million)
7.5.5.3 Market size, by application, 2016-2026 (USD Million)
7.5.6 Mexico
7.5.6.1 Market size, by form, 2016-2026 (USD Million)
7.5.6.2 Market size, by source, 2016-2026 (USD Million)
7.5.6.3 Market size, by application, 2016-2026 (USD Million)
7.5.7 Argentina
7.5.7.1 Market size, by form, 2016-2026 (USD Million)
7.5.7.2 Market size, by source, 2016-2026 (USD Million)
7.5.7.3 Market size, by application, 2016-2026 (USD Million)
7.6 MEA
7.6.1 Market size, by country 2016-2026 (USD Million)
7.6.2 Market size, by form, 2016-2026 (USD Million)
7.6.3 Market size, by source, 2016-2026 (USD Million)
7.6.4 Market size, by application, 2016-2026 (USD Million)
7.6.5 Saudi Arabia
7.6.5.1 Market size, by form, 2016-2026 (USD Million)
7.6.5.2 Market size, by source, 2016-2026 (USD Million)
7.6.5.3 Market size, by application, 2016-2026 (USD Million)
7.6.6 UAE
7.6.6.1 Market size, by form, 2016-2026 (USD Million)
7.6.6.2 Market size, by source, 2016-2026 (USD Million)
7.6.6.3 Market size, by application, 2016-2026 (USD Million)
7.6.7 South Africa
7.6.7.1 Market size, by form, 2016-2026 (USD Million)
7.6.7.2 Market size, by source, 2016-2026 (USD Million)
7.6.7.3 Market size, by application, 2016-2026 (USD Million)
Chapter 8 Company Landscape
8.1 Competitive analysis, 2020
8.2 ATK CHEMICAL COMPANY LIMITED
8.2.1 Company overview
8.2.2 Financial analysis
8.2.3 Strategic positioning
8.2.4 Info graphic analysis
8.3 Shanghai Zheyan Biotech
8.3.1 Company overview
8.3.2 Financial analysis
8.3.3 Strategic positioning
8.3.4 Info graphic analysis
8.4 Henan chemical co
8.4.1 Company overview
8.4.2 Financial analysis
8.4.3 Strategic positioning
8.4.4 Info graphic analysis
8.5 BOC Sciences
8.5.1 Company overview
8.5.2 Financial analysis
8.5.3 Strategic positioning
8.5.4 Info graphic analysis
8.6 Chongqing Chemdad Co
8.6.1 Company overview
8.6.2 Financial analysis
8.6.3 Strategic positioning
8.6.4 Info graphic analysis
8.7 Henan Bon Industrial Co.,Ltd
8.7.1 Company overview
8.7.2 Financial analysis
8.7.3 Strategic positioning
8.7.4 Info graphic analysis
8.8 Aktin Chemicals, Inc.
8.8.1 Company overview
8.8.2 Financial analysis
8.8.3 Strategic positioning
8.8.4 Info graphic analysis
8.9 Amadis Chemical Company Limited
8.9.1 Company overview
8.9.2 Financial analysis
8.9.3 Strategic positioning
8.9.4 Info graphic analysis
8.10 Shanghai CR Corporation
8.10.1 Company overview
8.10.2 Financial analysis
8.10.3 Strategic positioning
8.10.4 Info graphic analysis
8.11 Sigma-Aldrich Co. LLC
8.11.1 Company overview
8.11.2 Financial analysis
8.11.3 Strategic positioning
8.11.4 Info graphic analysis
8.12 Alichem
8.12.1 Company overview
8.12.2 Financial analysis
8.12.3 Strategic positioning
8.12.4 Info graphic analysis
8.13 AvaChem Scientific
8.13.1 Company overview
8.13.2 Financial analysis
8.13.3 Strategic positioning
8.13.4 Info graphic analysis
8.14 Alfa Chemistry
8.14.1 Company overview
8.14.2 Financial analysis
8.14.3 Strategic positioning
8.14.4 Info graphic analysis
8.15 abcr GmbH
8.15.1 Company overview
8.15.2 Financial analysis
8.15.3 Strategic positioning
8.15.4 Info graphic analysis
8.16 Yuhao Chemical
8.16.1 Company overview
8.16.2 Financial analysis
8.16.3 Strategic positioning
8.16.4 Info graphic analysis
8.17 Aaron Chemicals LLC
8.17.1 Company overview
8.17.2 Financial analysis
8.17.3 Strategic positioning
8.17.4 Info graphic analysis
8.18 THE BioTek
8.18.1 Company overview
8.18.2 Financial analysis
8.18.3 Strategic positioning
8.18.4 Info graphic analysis
8.19 Smolecule
8.19.1 Company overview
8.19.2 Financial analysis
8.19.3 Strategic positioning
8.19.4 Info graphic analysis
8.20 Hairui Chemical
8.20.1 Company overview
8.20.2 Financial analysis
8.20.3 Strategic positioning
8.20.4 Info graphic analysis
8.21 Wilshire Technologies
8.21.1 Company overview
8.21.2 Financial analysis
8.21.3 Strategic positioning
8.21.4 Info graphic analysis
8.22 Ambeed
8.22.1 Company overview
8.22.2 Financial analysis
8.22.3 Strategic positioning
8.22.4 Info graphic analysis
8.23 Acorn PharmaTech
8.23.1 Company overview
8.23.2 Financial analysis
8.23.3 Strategic positioning
8.23.4 Info graphic analysis
8.24 AbaChemScene
8.24.1 Company overview
8.24.2 Financial analysis
8.24.3 Strategic positioning
8.24.4 Info graphic analysis
8.25 Sinfoo Biotech
8.25.1 Company overview
8.25.2 Financial analysis
8.25.3 Strategic positioning
8.25.4 Info graphic analysis
8.26 Ambinter
8.26.1 Company overview
8.26.2 Financial analysis
8.26.3 Strategic positioning
8.26.4 Info graphic analysis
8.27 BOC Sciences
8.27.1 Company overview
8.27.2 Financial analysis
8.27.3 Strategic positioning
8.27.4 Info graphic analysis
8.28 Glentham Life Sciences Ltd.
8.28.1 Company overview
8.28.2 Financial analysis
8.28.3 Strategic positioning
8.28.4 Info graphic analysis
8.29 ZINC
8.29.1 Company overview
8.29.2 Financial analysis
8.29.3 Strategic positioning
8.29.4 Info graphic analysis
8.30 AK Scientific, Inc.
8.30.1 Company overview
8.30.2 Financial analysis
8.30.3 Strategic positioning
8.30.4 Info graphic analysis
8.31 Acadechem
8.31.1 Company overview
8.31.2 Financial analysis
8.31.3 Strategic positioning
8.31.4 Info graphic analysis
8.32 Biosynth Carbosynth
8.32.1 Company overview
8.32.2 Financial analysis
8.32.3 Strategic positioning
8.32.4 Info graphic analysis
8.33 Key Organics/BIONET
8.33.1 Company overview
8.33.2 Financial analysis
8.33.3 Strategic positioning
8.33.4 Info graphic analysis
8.34 AKos Consulting & Solutions
8.34.1 Company overview
8.34.2 Financial analysis
8.34.3 Strategic positioning
8.34.4 Info graphic analysis
8.35 MuseChem
8.35.1 Company overview
8.35.2 Financial analysis
8.35.3 Strategic positioning
8.35.4 Info graphic analysis
8.36 BioChemPartner
8.36.1 Company overview
8.36.2 Financial analysis
8.36.3 Strategic positioning
8.36.4 Info graphic analysis
8.37 MolPort
8.37.1 Company overview
8.37.2 Financial analysis
8.37.3 Strategic positioning
8.37.4 Info graphic analysis
8.38 BLD Pharm
8.38.1 Company overview
8.38.2 Financial analysis
8.38.3 Strategic positioning
8.38.4 Info graphic analysis
8.39 eNovation Chemicals
8.39.1 Company overview
8.39.2 Financial analysis
8.39.3 Strategic positioning
8.39.4 Info graphic analysis
8.40 AA BLOCKS
8.40.1 Company overview
8.40.2 Financial analysis
8.40.3 Strategic positioning
8.40.4 Info graphic analysis
8.41 PetroEuroAsia
8.40.1 Company overview
8.40.2 Financial analysis
8.40.3 Strategic positioning
8.40.4 Info graphic analysis
The Global Geranylgeraniol Market has been studied from the year 2019 till 2026. However, the CAGR provided in the report is from the year 2021 to 2026. The research methodology involved three stages: Desk research, Primary research, and Analysis & Output from the entire research process.

The desk research involved a robust background study which meant referring to paid and unpaid databases to understand the market dynamics; mapping contracts from press releases; identifying the key players in the market, studying their product portfolio, competition level, annual reports/SEC filings & investor presentations; and learning the demand and supply-side analysis for the Geranylgeraniol Market.

The primary research activity included telephonic conversations with more than 50 tier 1 industry consultants, distributors, and end-use product manufacturers.

Finally, based on the above thorough research process, an in-depth analysis was carried out considering the following aspects: market attractiveness, current & future market trends, market share analysis, SWOT analysis of the company and customer analytics.


This FREE sample includes market data points, ranging from trend analyses to market estimates & forecasts. See for yourself.
Or view our licence options:
Tailor made solutions just for you
80% of our clients seek made-to-order reports. How do you want us to tailor yours?
OUR CLIENTS


