This report was recently updated on August 21 2025 with the latest and most recent
market numbers
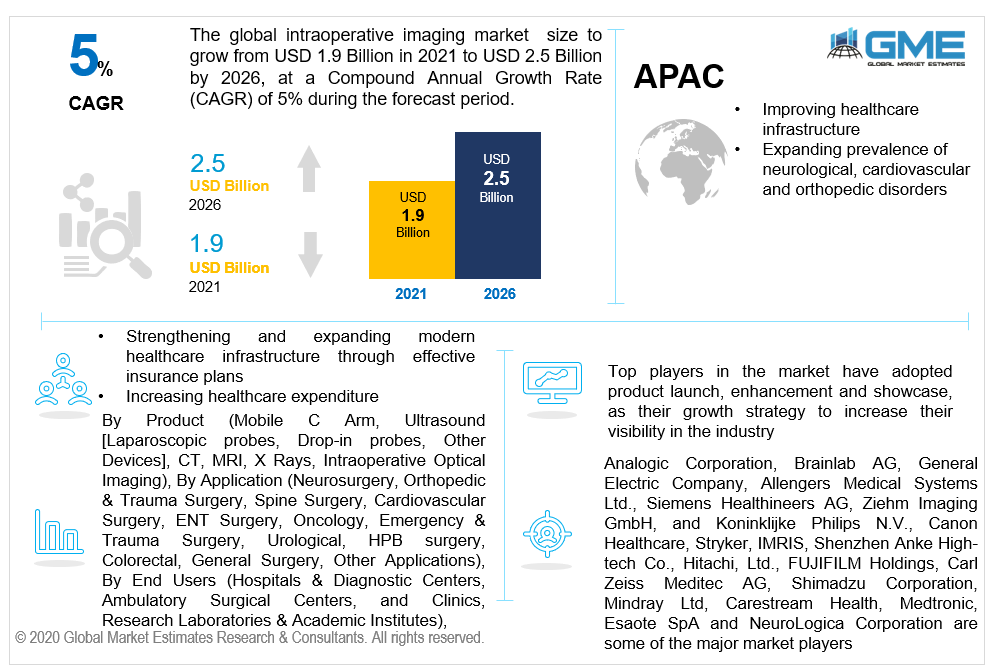
Global Intraoperative Imaging Market Size, Trends, and Analysis- Forecasts to 2026 By Product (Mobile C Arm, Ultrasound [Laparoscopic Probes, Drop-in Probes, Other Devices], CT, MRI, X Rays, Intraoperative Optical Imaging), By Application (Neurosurgery, Orthopedic & Trauma Surgery, Spine Surgery, Cardiovascular Surgery, ENT Surgery, Oncology, Emergency & Trauma Surgery, Urological, HPB surgery, Colorectal, General Surgery, Other Applications), By End Users (Hospitals & Diagnostic Centers, Ambulatory Surgical Centers & Clinics, Research Laboratories & Academic Institutes), By Region (North America, Europe, Asia Pacific, MEA, and CSA); End-User Landscape, Company Market Share Analysis, and Competitor Analysis.
The global intraoperative imaging market is estimated to be valued at USD 1900 million in 2021 and is projected to reach USD 2500 million by 2026 at a CAGR of 5%. The upsurge in the volume of complicated operations conducted throughout the world, as well as the requirement for imaging systems that give high-resolution real-time pictures to improve monitoring during operations, are the primary drivers supporting the expansion of the market. The expanding implementation of updated imaging systems by end-users, including hospitals, assists in cumulative procedure expenses by minimizing the necessities for follow-up processes and the costs correlated with them, as well as correlating research demonstrating that intraoperative MRI aided OR aids in strengthening aggregate healthcare outcomes and curbing hospital stay and ablation frequency, are driving the market. The broad spectrum of applications spanning numerous surgical procedures, including cerebral aneurysms, biopsy removal, spinal implants, catheter-based treatments, and tumor surgery, among many others, influence the market. Consequently, the skyrocketing preponderance of orthopedic, neurological, and cardiovascular abnormalities, a preference for minimally invasive surgeries, a strong clamor for sophisticated intraoperative imaging for the medication of such medical illnesses, improved healthcare infrastructure, increased awareness, and an increment in healthcare capital spending all have a constructive impact on the market. Secondly, technical advancements in infrastructure and growing nations provide profitable opportunities for market participants over the forecast period.
The increased price of such equipment, on the other hand, is projected to stymie the market's advancement. Sustainability challenges for new competitors and small firms are expected to confront the market over the forecast period. The technological adaptations carried out within this sector have progressed drastically within the last decade. According to International Agency for Research on Cancer (IARC) and WHO, the database shows that every year around 17 million new cases arrive worldwide for tumors and around 9.6 million people are reported of deaths due to cancer. Globally these estimates have only been observed showing an increasing trend for over a decade. Intraoperative imaging or iMRI has certainly helped reduce these cases to a large extent through its ability to facilitate surgeons with images giving clarity of the situation and of the procedures that are being undertaken.
Mobile C-arm is highly used in many hospitals and operation centers globally. A mobile c-arm is a device that is equipped with various connecters which can intensify the scanning ability of the device as well as connect the source and detector to an x-ray together. These mobile c-arm devices facilitate precision in carrying out operational procedures. The ability of the mobile c-arm to intensify the normal x-ray and give precise images makes it easy for the operators to carry out scans and treat their patients.
Increasing research and studies on subjects like cerebral and peripheral cortexes, cardiac techniques, procedures used in orthopedic operations, have attributed to increased demand for mobile c-arm. These kinds of studies have become easy owing to the flexible features of mobile c-arm devices. C-arms are majorly used in such imaging during surgeries and other sensitive operations.
This imaging is being used in a wide range of applications like neurosurgery, orthopedic & trauma surgery, spine surgery, cardiovascular surgery, ENT surgery, oncology, emergency & trauma surgery, urological, HPB surgery, colorectal, and general surgery. However, among these, neurosurgery has been the area where such imaging has been used for the longest time compared to other applications. These imagining devices are being used in Neurosurgery since the early 1990s in various brain surgeries and tumor detections. Neurosurgeons have been able to up their performances in carrying out surgical procedures since the application of such imaging into their regular workings. These devices have complex characteristics and features that are yet to be utilized to the best possible ability. However, neurosurgeons have been very proficient in applying and exploring these developments. These imaging tools also act as navigation tools to detect various kinds of spine injury or issues in the brain, nervous systems, or indifferent cortexes.
These imaging devices are used in various verticals, like hospitals & diagnostic centers, ambulatory surgical centers and clinics, and research laboratories & academic institutes. According to WHO, in 2012, approximately 350-400 million operations were carried out in hospitals & Diagnostic Centers, and the number was suspected to increase in coming years. Hospitals & Diagnostic Centers are the primary places where such imaging devices are used to undertake various types of surgeries. These hospitals perform various procedures under the guidance of well-known professionals and surgeons, who require such advanced tools and devices to successfully carry out the operations. Operations like brain surgery, spine surgery, implants, tumor, cancer, and others require detailed analysis which is economical for the huge hospitals and diagnostic centers to undertake.
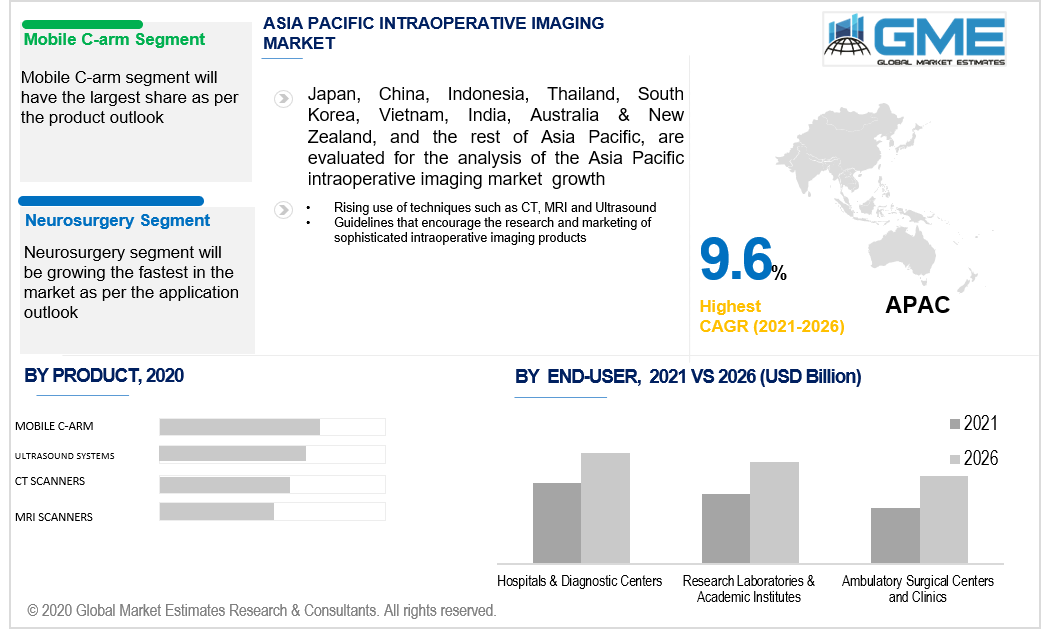
North America has its dominance over the market. North American countries like the US and Canada have had a deep-rooted hold on this market for many decades, attributed to the advanced healthcare sector and developing technological applications. Along with advancements in clinical operations and technology, this region is also reported to be showcasing developing infrastructural structures in the healthcare sector. On a side note, the Asia-Pacific region is one of the fastest-growing regions with respect to adapting to such imaging devices. India was reported to be the very first country to adopt 3T intraoperative MRI in its hospitals and diagnostic centers. Countries like India are also reported to have 40 to 50 thousand brain tumor cases every year. Increasing cases like these in the APAC region are attributed to higher rates of adaptation of such imaging devices to treat patients efficiently. Countries like China and Japan are huge developing economies with the utmost need for advanced healthcare infrastructure. APAC countries are also known for their expertise in neurosurgery and other operations, which ask for more developed imaging devices.
Analogic Corporation, Brainlab AG, General Electric Company, Allengers Medical Systems Ltd., Siemens Healthineers AG, Ziehm Imaging GmbH, Koninklijke Philips N.V., Canon Healthcare, Stryker, IMRIS, Shenzhen Anke High-tech Co., Hitachi, Ltd., FUJIFILM Holdings, Carl Zeiss Meditec AG, Shimadzu Corporation, Mindray Ltd, Carestream Health, Medtronic, Esaote SpA and NeuroLogica Corporation are some of the major market players.
Please note: This is not an exhaustive list of companies profiled in the report.
Chapter 1 Methodology
1.1 Market Scope & Definitions
1.2 Estimates & Forecast Calculation
1.3 Historical Data Overview and Validation
1.4 Data Sources
1.4.1 Secondary
1.4.2 Primary
Chapter 2 Report Outlook
2.1 Intraoperative Imaging Industry Overview, 2016-2026
2.1.1 Industry Overview
2.1.2 Product Overview
2.1.3 End Users Overview
2.1.4 Application Overview
2.1.5 Regional Overview
Chapter 3 Intraoperative Imaging Market Trends
3.1 Market Segmentation
3.2 Industry Background, 2016-2026
3.3 Market Key Trends
3.3.1 Positive Trends
3.3.1.1 Growing Preference for Minimal Invasive Surgeries with Image-Guided Intervention Procedures
3.3.1.2 Increasing Capital Investments by Government
3.3.2 Industry Challenges
3.3.2.1 High Cost of Intraoperative Imaging
3.4 Prospective Growth Scenario
3.4.1 Product Growth Scenario
3.4.2 End Users Growth Scenario
3.4.3 Application Growth Scenario
3.5 COVID-19 Influence over Industry Growth
3.6 Porter’s Analysis
3.7 PESTEL Analysis
3.8 Value Chain & Supply Chain Analysis
3.9 Regulatory Framework
3.9.1 North America
3.9.2 Europe
3.9.3 APAC
3.9.4 LATAM
3.9.5 MEA
3.10 Technology Overview
3.11 Market Share Analysis, 2020
3.11.1 Company Positioning Overview, 2020
Chapter 4 Intraoperative Imaging Market, By Product
4.1 Product Outlook
4.2 Mobile C Arm
4.2.1 Market Size, By Region, 2016-2026 (USD Million)
4.3 Ultrasound
4.3.1 Market Size, By Region, 2016-2026 (USD Million)
4.3.1.1 Laparoscopic Probes
4.3.1.1.1 Market Size, By Region, 2016-2026 (USD Million)
4.3.1.2 Drop-in Probes
4.3.1.2.1 Market Size, By Region, 2016-2026 (USD Million)
4.3.1.3 Other Devices
4.3.1.3.1 Market Size, By Region, 2016-2026 (USD Million)
4.4 CT
4.4.1 Market Size, By Region, 2016-2026 (USD Million)
4.5 MRI
4.5.1 Market Size, By Region, 2016-2026 (USD Million)
4.6 X Rays
4.6.1 Market Size, By Region, 2016-2026 (USD Million)
4.7 Intraoperative
4.7.1 Market Size, By Region, 2016-2026 (USD Million)
4.8 Optical Imaging
4.8.1 Market Size, By Region, 2016-2026 (USD Million)
Chapter 5 Intraoperative Imaging Market, By Application
5.1 Application Outlook
5.2 Neurosurgery
5.2.1 Market Size, By Region, 2016-2026 (USD Million)
5.3 Orthopedic & Trauma Surgery
5.3.1 Market Size, By Region, 2016-2026 (USD Million)
5.4 Spine Surgery
5.4.1 Market Size, By Region, 2016-2026 (USD Million)
5.5 Cardiovascular Surgery
5.5.1 Market Size, By Region, 2016-2026 (USD Million)
5.6 ENT Surgery
5.6.1 Market Size, By Region, 2016-2026 (USD Million)
5.7 Oncology
5.7.1 Market Size, By Region, 2016-2026 (USD Million)
5.8 Emergency & Trauma Surgery
5.8.1 Market Size, By Region, 2016-2026 (USD Million)
5.9 Urological
5.9.1 Market Size, By Region, 2016-2026 (USD Million)
5.10 HPB surgery
5.10.1 Market Size, By Region, 2016-2026 (USD Million)
5.11 Colorectal
5.11.1 Market Size, By Region, 2016-2026 (USD Million)
5.12 General Surgery
5.12.1 Market Size, By Region, 2016-2026 (USD Million)
5.13 Other Applications
5.13.1 Market Size, By Region, 2016-2026 (USD Million)
Chapter 6 Intraoperative Imaging Market, By End Users
6.1 End Users Outlook
6.2 Hospitals & Diagnostic Centers
6.2.1 Market size, By Region, 2016-2026 (USD Million)
6.3 Ambulatory Surgical Centers & Clinics
6.3.1 Market size, By Region, 2016-2026 (USD Million)
6.4 Research Laboratories & Academic Institutes
6.4.1 Market size, By Region, 2016-2026 (USD Million)
Chapter 7 Intraoperative Imaging Market, By Region
7.1 Regional outlook
7.2 North America
7.2.1 Market Size, By Country 2016-2026 (USD Million)
7.2.2 Market Size, By Product, 2016-2026 (USD Million)
7.2.3 Market Size, By End Users, 2016-2026 (USD Million)
7.2.4 Market Size, By Application, 2016-2026 (USD Million)
7.2.5 U.S.
7.2.5.1 Market Size, By Product, 2016-2026 (USD Million)
7.2.5.2 Market Size, By End Users, 2016-2026 (USD Million)
7.2.5.3 Market Size, By Application, 2016-2026 (USD Million)
7.2.6 Canada
7.2.6.1 Market Size, By Product, 2016-2026 (USD Million)
7.2.6.2 Market Size, By End Users, 2016-2026 (USD Million)
7.2.6.3 Market Size, By Application, 2016-2026 (USD Million)
7.3 Europe
7.3.1 Market Size, By Country 2016-2026 (USD Million)
7.3.2 Market Size, By Product, 2016-2026 (USD Million)
7.3.3 Market Size, By End Users, 2016-2026 (USD Million)
7.3.4 Market Size, By Application, 2016-2026 (USD Million)
7.3.5 Germany
7.2.5.1 Market Size, By Product, 2016-2026 (USD Million)
7.2.5.2 Market Size, By End Users, 2016-2026 (USD Million)
7.2.5.3 Market Size, By Application, 2016-2026 (USD Million)
7.3.6 UK
7.3.6.1 Market Size, By Product, 2016-2026 (USD Million)
7.3.6.2 Market Size, By End Users, 2016-2026 (USD Million)
7.3.6.3 Market Size, By Application, 2016-2026 (USD Million)
7.3.7 France
7.3.7.1 Market Size, By Product, 2016-2026 (USD Million)
7.3.7.2 Market Size, By End Users, 2016-2026 (USD Million)
7.3.7.3 Market Size, By Application, 2016-2026 (USD Million)
7.3.8 Italy
7.3.8.1 Market Size, By Product, 2016-2026 (USD Million)
7.3.8.2 Market Size, By End Users, 2016-2026 (USD Million)
7.3.8.3 Market Size, By Application, 2016-2026 (USD Million)
7.3.9 Spain
7.3.9.1 Market Size, By Product, 2016-2026 (USD Million)
7.3.9.2 Market Size, By End Users, 2016-2026 (USD Million)
7.3.9.3 Market Size, By Application, 2016-2026 (USD Million)
7.3.10 Russia
7.3.10.1 Market Size, By Product, 2016-2026 (USD Million)
7.3.10.2 Market Size, By End Users, 2016-2026 (USD Million)
7.3.10.3 Market Size, By Application, 2016-2026 (USD Million)
7.4 Asia Pacific
7.4.1 Market Size, By Country 2016-2026 (USD Million)
7.4.2 Market Size, By Product, 2016-2026 (USD Million)
7.4.3 Market Size, By End Users, 2016-2026 (USD Million)
7.4.4 Market Size, By Application, 2016-2026 (USD Million)
7.4.5 China
7.4.5.1 Market Size, By Product, 2016-2026 (USD Million)
7.4.5.2 Market Size, By End Users, 2016-2026 (USD Million)
7.4.5.3 Market Size, By Application, 2016-2026 (USD Million)
7.4.6 India
7.4.6.1 Market Size, By Product, 2016-2026 (USD Million)
7.4.6.2 Market Size, By End Users, 2016-2026 (USD Million)
7.4.6.3 Market Size, By Application, 2016-2026 (USD Million)
7.4.7 Japan
7.4.7.1 Market Size, By Product, 2016-2026 (USD Million)
7.4.7.2 Market Size, By End Users, 2016-2026 (USD Million)
7.4.7.3 Market Size, By Application, 2016-2026 (USD Million)
7.4.8 Australia
7.4.8.1 Market Size, By Product, 2016-2026 (USD Million)
7.4.8.2 Market size, By End Users, 2016-2026 (USD Million)
7.4.8.3 Market Size, By Application, 2016-2026 (USD Million)
7.4.9 South Korea
7.4.9.1 Market Size, By Product, 2016-2026 (USD Million)
7.4.9.2 Market Size, By End Users, 2016-2026 (USD Million)
7.4.9.3 Market Size, By Application, 2016-2026 (USD Million)
7.5 Latin America
7.5.1 Market Size, By Country 2016-2026 (USD Million)
7.5.2 Market Size, By Product, 2016-2026 (USD Million)
7.5.3 Market Size, By End Users, 2016-2026 (USD Million)
7.5.4 Market Size, By Application, 2016-2026 (USD Million)
7.5.5 Brazil
7.5.5.1 Market Size, By Product, 2016-2026 (USD Million)
7.5.5.2 Market Size, By End Users, 2016-2026 (USD Million)
7.5.5.3 Market Size, By Application, 2016-2026 (USD Million)
7.5.6 Mexico
7.5.6.1 Market Size, By Product, 2016-2026 (USD Million)
7.5.6.2 Market Size, By End Users, 2016-2026 (USD Million)
7.5.6.3 Market Size, By Application, 2016-2026 (USD Million)
7.5.7 Argentina
7.5.7.1 Market Size, By Product, 2016-2026 (USD Million)
7.5.7.2 Market Size, By End Users, 2016-2026 (USD Million)
7.5.7.3 Market Size, By Application, 2016-2026 (USD Million)
7.6 MEA
7.6.1 Market Size, By Country 2016-2026 (USD Million)
7.6.2 Market Size, By Product, 2016-2026 (USD Million)
7.6.3 Market Size, By End Users, 2016-2026 (USD Million)
7.6.4 Market Size, By Application, 2016-2026 (USD Million)
7.6.5 Saudi Arabia
7.6.5.1 Market Size, By Product, 2016-2026 (USD Million)
7.6.5.2 Market Size, By End Users, 2016-2026 (USD Million)
7.6.5.3 Market Size, By Application, 2016-2026 (USD Million)
7.6.6 UAE
7.6.6.1 Market Size, By Product, 2016-2026 (USD Million)
7.6.6.2 Market Size, By End Users, 2016-2026 (USD Million)
7.6.6.3 Market Size, By Application, 2016-2026 (USD Million)
7.6.7 South Africa
7.6.7.1 Market Size, By Product, 2016-2026 (USD Million)
7.6.7.2 Market Size, By End Users, 2016-2026 (USD Million)
7.6.7.3 Market Size, By Application, 2016-2026 (USD Million)
Chapter 8 Company Landscape
8.1 Competitive Analysis, 2020
8.2 Analogic Corporation
8.2.1 Company Overview
8.2.2 Financial Analysis
8.2.3 Strategic Positioning
8.2.4 Info Graphic Analysis
8.3 Brainlab AG
8.3.1 Company Overview
8.3.2 Financial Analysis
8.3.3 Strategic Positioning
8.3.4 Info Graphic Analysis
8.4 General Electric Company
8.4.1 Company Overview
8.4.2 Financial Analysis
8.4.3 Strategic Positioning
8.4.4 Info Graphic Analysis
8.5 Allengers Medical Systems Ltd.
8.5.1 Company Overview
8.5.2 Financial Analysis
8.5.3 Strategic Positioning
8.5.4 Info Graphic Analysis
8.6 Siemens Healthineers AG
8.6.2 Financial Analysis
8.6.3 Strategic Positioning
8.6.4 Info Graphic Analysis
8.7 Ziehm Imaging GmbH
8.7.1 Company Overview
8.7.2 Financial Analysis
8.7.3 Strategic Positioning
8.7.4 Info Graphic Analysis
8.8 Koninklijke Philips N.V.
8.8.1 Company Overview
8.8.2 Financial Analysis
8.8.3 Strategic Positioning
8.8.4 Info Graphic Analysis
8.9 Canon Healthcare
8.9.1 Company Overview
8.9.2 Financial Analysis
8.9.3 Strategic Positioning
8.9.4 Info Graphic Analysis
8.10 Stryker
8.10.1 Company Overview
8.10.2 Financial Analysis
8.10.3 Strategic Positioning
8.10.4 Info Graphic Analysis
8.11 IMRIS
8.11.1 Company Overview
8.11.2 Financial Analysis
8.11.3 Strategic Positioning
8.11.4 Info Graphic Analysis
8.12 Shenzhen Anke High-tech Co.
8.12.1 Company Overview
8.12.2 Financial Analysis
8.12.3 Strategic Positioning
8.12.4 Info Graphic Analysis
8.13 Hitachi, Ltd.
8.13.1 Company Overview
8.13.2 Financial Analysis
8.13.3 Strategic Positioning
8.13.4 Info Graphic Analysis
8.14 FUJIFILM Holdings
8.14.1 Company Overview
8.14.2 Financial Analysis
8.14.3 Strategic Positioning
8.14.4 Info Graphic Analysis
8.15 Carl Zeiss Meditec AG
8.15.1 Company Overview
8.15.2 Financial Analysis
8.15.3 Strategic Positioning
8.15.4 Info Graphic Analysis
8.16 Shimadzu Corporation
8.16.1 Company Overview
8.16.2 Financial Analysis
8.16.3 Strategic Positioning
8.16.4 Info Graphic Analysis
8.17 Mindray Ltd
8.17.1 Company Overview
8.17.2 Financial Analysis
8.17.3 Strategic Positioning
8.17.4 Info Graphic Analysis
8.18 Carestream Health
8.18.1 Company Overview
8.18.2 Financial Analysis
8.18.3 Strategic Positioning
8.18.4 Info Graphic Analysis
8.19 Medtronic
8.19.1 Company Overview
8.19.2 Financial Analysis
8.19.3 Strategic Positioning
8.19.4 Info Graphic Analysis
8.20 Esaote SpA
8.20.1 Company Overview
8.20.2 Financial Analysis
8.20.3 Strategic Positioning
8.20.4 Info Graphic Analysis
8.21 NeuroLogica Corporation
8.21.1 Company Overview
8.21.2 Financial Analysis
8.21.3 Strategic Positioning
8.21.4 Info Graphic Analysis
8.22 Other Companies
8.22.1 Company Overview
8.22.2 Financial Analysis
8.22.3 Strategic Positioning
8.22.4 Info Graphic Analysis
The Global Intraoperative Imaging Market has been studied from the year 2019 till 2026. However, the CAGR provided in the report is from the year 2021 to 2026. The research methodology involved three stages: Desk research, Primary research, and Analysis & Output from the entire research process.

The desk research involved a robust background study which meant referring to paid and unpaid databases to understand the market dynamics; mapping contracts from press releases; identifying the key players in the market, studying their product portfolio, competition level, annual reports/SEC filings & investor presentations; and learning the demand and supply-side analysis for the Intraoperative Imaging Market.

The primary research activity included telephonic conversations with more than 50 tier 1 industry consultants, distributors, and end-use product manufacturers.

Finally, based on the above thorough research process, an in-depth analysis was carried out considering the following aspects: market attractiveness, current & future market trends, market share analysis, SWOT analysis of the company and customer analytics.

Frequently Asked Questions
![Global Intraoperative Imaging Market Size, Trends, and Analysis- Forecasts to 2026 By Product (Mobile C Arm, Ultrasound [Laparoscopic Probes, Drop-in Probes, Other Devices], CT, MRI, X Rays, Intraoperative Optical Imaging), By Application (Neurosurgery, Orthopedic & Trauma Surgery, Spine Surgery, Cardiovascular Surgery, ENT Surgery, Oncology, Emergency & Trauma Surgery, Urological, HPB surgery, Colorectal, General Surgery, Other Applications), By End Users (Hospitals & Diagnostic Centers, Ambulatory Surgical Centers & Clinics, Research Laboratories & Academic Institutes), By Region (North America, Europe, Asia Pacific, MEA, and CSA); End-User Landscape, Company Market Share Analysis, and Competitor Analysis.](https://www.globalmarketestimates.com/images/cat/Healthcare.png)
This FREE sample includes market data points, ranging from trend analyses to market estimates & forecasts. See for yourself.
Or view our licence options:
Tailor made solutions just for you
80% of our clients seek made-to-order reports. How do you want us to tailor yours?
OUR CLIENTS


