This report was recently updated on July 7 2025 with the latest and most recent
market numbers
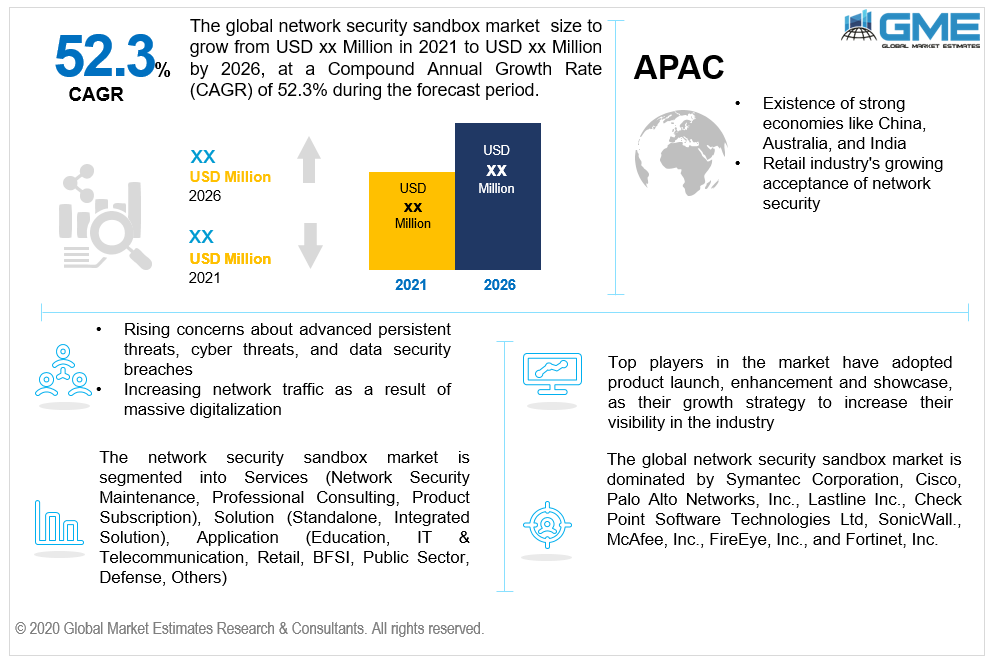
Global Network Security Sandbox Market Size, Trends, and Analysis- Forecasts To 2026 By Services (Network Security Maintenance, Professional Consulting, Product Subscription), By Solution (Standalone, Integrated Solution), By Application (Education, IT & Telecommunication, Retail, BFSI, Public Sector, Defense, Others), By Region (North America, Asia Pacific, CSA, Europe, and the Middle East and Africa); End-User Landscape, Company Market Share Analysis & Competitor Analysis
A sandbox is a network security mechanism that creates a discrete, limited area in which some functions are disabled. If unauthenticated applications or untested programming from third-party sites are used, a sandbox is often used. Testing is often done in a sandbox. A network security sandbox can also be used as a testing or staging server. The overall purpose of a network security sandbox is to have enough access to allow careful testing while avoiding exposing sensitive networks to highly flawed code. A network security sandbox is an automated study of the system in which a potentially doubtful application is run, interpreted, noted, and analysed. A network security sandbox is a protected environment in which programs can be executed in a safe manner. The network security sandbox gives programs as many permissions as they require. The global network security sandbox market is anticipated to expand due to rising concerns among various companies regarding advanced persistent threats, cyber threats, and data security breaches. The global network protection sandbox industry is projected to expand as security platform suppliers provide more network security sandboxes in their security systems. Sandboxing features have been added to a wide range of threat detection software by manufacturers as an advancement in existing products such as unified threat management, web-secure gateways, and next-generation firewalls, which are intended to aid target market growth. Increasing network traffic as a result of massive digitalization across multiple sectors, as well as advancements in sandboxes including malware detection, forensics, and incident response, is anticipated to be yet another driver in the global network security sandbox industry's perpetuating development. Enterprises employ a variety of advanced security strategies and methods to safeguard IT networks, as well as secure apps and business-sensitive data. Cyber hackers, on the other hand, are working on advanced technology for gaining access to an organization's resources. To attack an organization's infrastructure, they use multisector and multi-stage attack strategies. Hacking may be used for nefarious purposes, such as disrupting other people's enterprise applications, or for monetary gain. Modern hacker teams are heavily invested in the use of advanced hacker techniques that are difficult to spot over an extended period of time. The increased sophistication of threats would necessitate advanced safety mechanisms to propel the sandboxing industry further. Sandboxing technology is commonly used to track and prevent malware, and hackers are trying to figure out how to train their malware to remain inactive in the sandbox. As a result, sandbox evading malware would be able to bypass defences and run malicious code without being detected by existing cybersecurity technologies. When sandboxing becomes more widely used as a malware identification and protection tool, cybercriminals will devise different ways to circumvent it. There are modern malware strains that can detect while they are in a sandbox. Such malware infections do not execute their malicious code until they exit the sandbox.
By 2026, the network security sandbox industry is expected to be dominated by the product subscription category. Key players in the network security sandbox industry provide a beta version of their offerings to show administrators the full value of using trial and error techniques to test the services. In the United States, businesses are adopting a recent practice of scheduling a regular billing interval cycle. The network security sandboxing players give their clients the ability to address any questions or issues that could occur during the subscription period, which may be a driving force for the implementation of trail services. During the forecast period, professional consulting is expected to rise at the highest CAGR. Professional consulting firms assist a company in identifying and overcoming possible threats to its financial records and personal information. Because of the well-qualified analysts in the security operation center, which reduces the danger from the warnings, professional consultancy services in North America are stifling demand in the network security sandbox industry.
The Integrated Solution segment is anticipated to expand at the fastest CAGR during the forecast period. The widespread use of cloud computing has fuelled demand for an integrated network security solution among businesses. Proactive network security applications are created by combining anti-malware device gateways and cloud infrastructure with innovations such as vulnerability monitoring, network activity analysis, and machine learning. The increased need to protect IT networks from advanced cyber-attacks such as ransomware, malware, and zero-day attacks is the cause for the rise in development. The use of virtual servers and cloud technologies has strengthened the need for businesses to implement a unified network security solution. The need for a more comprehensive and interoperable network security infrastructure is propelling the integrated network security solution industry forward.
During the forecast period, the Retail segment is projected to expand at a faster CAGR. Consumer products and services are sold through a variety of distributors in the retail industry. Owing to the potential pay-outs and high amount of financial transactions by master card, credit cards, and VISA, this segment is among the most cost-conscious industries and is the most vulnerable vertical for cyber-attacks. The retail industry is the most appealing target for hackers due to the vast amount of personal data of the consumers. As a result, the implementation of intrusion prevention programs in the retail industry is growing. Accelerating technology also offers retailers the highest possible digital interaction directly with the stores.
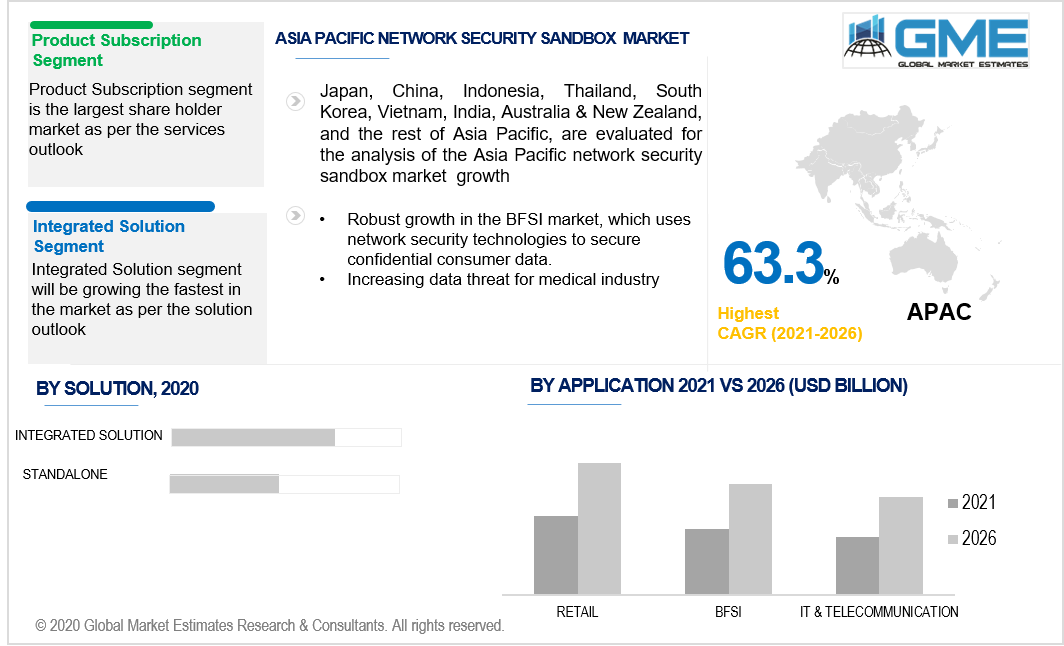
The global network security sandbox industry is presently dominated by North America. It is projected to remain the leading market due to rising GDP and steady growth in the financial and retail industries. Furthermore, companies that use advanced threat detection technology to secure confidential external information have experienced rapid regional expansion. Advanced IT infrastructure and advanced threat detection technologies are available for the security of sensitive data amongst various sectors in this region. In advanced nations like Canada and the United States, there is a heavy focus on developments arising from research and development (R&D) as well as security technologies. Because of the existence of strong economies like China, Australia, and India, Asia Pacific is expected to be a rapidly growing region. The retail industry's growing acceptance of network security is driving regional development. Furthermore, the market is anticipated to be driven by the robust growth in the BFSI market, which uses network security technologies to secure confidential consumer data.
The global network security sandbox market is dominated by Symantec Corporation, Cisco, Palo Alto Networks, Inc., Lastline Inc., Check Point Software Technologies Ltd, SonicWall., McAfee, Inc., FireEye, Inc., and Fortinet, Inc.
Please note: This is not an exhaustive list of companies profiled in the report.
Palo Alto Networks purchased LightCyber in February 2017, bringing LightCyber's fully automated and behavioral analytics platform, which can detect threats based on network behavioral anomalies, into Palo Alto Networks' suite of security solutions.
Chapter 1 Methodology
1.1 Market Scope & Definitions
1.2 Estimates & Forecast Calculation
1.3 Historical Data Overview and Validation
1.4 Data Sources
1.4.1 Secondary
1.4.2 Primary
Chapter 2 Report Outlook
2.1 Network Security Sandbox Industry Overview, 2016-2026
2.1.1 Industry Overview
2.1.2 Service Overview
2.1.3 Application Overview
2.1.4 Solution Overview
2.1.6 Regional Overview
Chapter 3 Network Security Sandbox Market Trends
3.1 Market Segmentation
3.2 Industry Background, 2016-2026
3.3 Market Key Trends
3.3.1 Positive Trends
3.3.1.1 Rising concerns among various companies regarding advanced persistent threats, and cyber threats
3.3.2 Industry Challenges
3.3.2.1 Lack of adequate infrastructure in developing nations
3.4 Prospective Growth Scenario
3.4.1 Service Growth Scenario
3.4.2 Application Growth Scenario
3.4.3 Solution Growth Scenario
3.5 COVID-19 Influence over Industry Growth
3.6 Porter’s Analysis
3.7 PESTEL Analysis
3.8 Value Chain & Supply Chain Analysis
3.9 Regulatory Framework
3.9.1 North America
3.9.2 Europe
3.9.3 APAC
3.9.4 LATAM
3.9.5 MEA
3.10 Solution Overview
3.11 Market Share Analysis, 2020
3.11.1 Company Positioning Overview, 2020
Chapter 4 Network Security Sandbox Market, By Service
4.1 Service Outlook
4.2 Network Security Maintenance
4.2.1 Market Size, By Region, 2016-2026 (USD Million)
4.3 Professional Consulting
4.3.1 Market Size, By Region, 2016-2026 (USD Million)
4.4 Product Subscription
4.4.1 Market Size, By Region, 2016-2026 (USD Million)
Chapter 5 Network Security Sandbox Market, By Application
5.1 Application Outlook
5.2 Education
5.2.1 Market Size, By Region, 2016-2026 (USD Million)
5.3 IT & Telecommunication
5.3.1 Market Size, By Region, 2016-2026 (USD Million)
5.4 Retail
5.4.1 Market Size, By Region, 2016-2026 (USD Million)
5.5 Public Sector
5.5.1 Market Size, By Region, 2016-2026 (USD Million)
5.6 BFSI
5.6.1 Market Size, By Region, 2016-2026 (USD Million)
5.7 Defense
5.7.1 Market Size, By Region, 2016-2026 (USD Million)
Chapter 6 Network Security Sandbox Market, By Solution
6.1 Standalone Solution
6.1.1 Market Size, By Region, 2016-2026 (USD Million)
6.2 Integrated Solution
6.2.1 Market Size, By Region, 2016-2026 (USD Million)
Chapter 7 Network Security Sandbox Market, By Region
7.1 Regional outlook
7.2 North America
7.2.1 Market Size, By Country 2016-2026 (USD Million)
7.2.2 Market Size, By Service, 2016-2026 (USD Million)
7.2.3 Market Size, By Application, 2016-2026 (USD Million)
7.2.4 Market Size, By Solution, 2016-2026 (USD Million)
7.2.6 U.S.
7.2.6.1 Market Size, By Service, 2016-2026 (USD Million)
7.2.4.2 Market Size, By Application, 2016-2026 (USD Million)
7.2.4.3 Market Size, By Solution, 2016-2026 (USD Million)
7.2.7 Canada
7.2.7.1 Market Size, By Service, 2016-2026 (USD Million)
7.2.7.2 Market Size, By Application, 2016-2026 (USD Million)
7.2.7.3 Market Size, By Solution, 2016-2026 (USD Million)
7.3 Europe
7.3.1 Market Size, By Country 2016-2026 (USD Million)
7.3.2 Market Size, By Service, 2016-2026 (USD Million)
7.3.3 Market Size, By Application, 2016-2026 (USD Million)
7.3.4 Market Size, By Solution, 2016-2026 (USD Million)
7.3.6 Germany
7.3.6.1 Market Size, By Service, 2016-2026 (USD Million)
7.3.6.2 Market Size, By Application, 2016-2026 (USD Million)
7.3.6.3 Market Size, By Solution, 2016-2026 (USD Million)
7.3.7 UK
7.3.7.1 Market Size, By Service, 2016-2026 (USD Million)
7.3.7.2 Market Size, By Application, 2016-2026 (USD Million)
7.3.7.3 Market Size, By Solution, 2016-2026 (USD Million)
7.3.8 France
7.3.7.1 Market Size, By Service, 2016-2026 (USD Million)
7.3.7.2 Market Size, By Application, 2016-2026 (USD Million)
7.3.7.3 Market Size, By Solution, 2016-2026 (USD Million)
7.3.9 Italy
7.3.9.1 Market Size, By Service, 2016-2026 (USD Million)
7.3.9.2 Market Size, By Application, 2016-2026 (USD Million)
7.3.9.3 Market Size, By Solution, 2016-2026 (USD Million)
7.3.10 Spain
7.3.10.1 Market Size, By Service, 2016-2026 (USD Million)
7.3.10.2 Market Size, By Application, 2016-2026 (USD Million)
7.3.10.3 Market Size, By Solution, 2016-2026 (USD Million)
7.3.11 Russia
7.3.11.1 Market Size, By Service, 2016-2026 (USD Million)
7.3.11.2 Market Size, By Application, 2016-2026 (USD Million)
7.3.11.3 Market Size, By Solution, 2016-2026 (USD Million)
7.4 Asia Pacific
7.4.1 Market Size, By Country 2016-2026 (USD Million)
7.4.2 Market Size, By Service, 2016-2026 (USD Million)
7.4.3 Market Size, By Application, 2016-2026 (USD Million)
7.4.4 Market Size, By Solution, 2016-2026 (USD Million)
7.4.6 China
7.4.6.1 Market Size, By Service, 2016-2026 (USD Million)
7.4.6.2 Market Size, By Application, 2016-2026 (USD Million)
7.4.6.3 Market Size, By Solution, 2016-2026 (USD Million)
7.4.7 India
7.4.7.1 Market Size, By Service, 2016-2026 (USD Million)
7.4.7.2 Market Size, By Application, 2016-2026 (USD Million)
7.4.7.3 Market Size, By Solution, 2016-2026 (USD Million)
7.4.8 Japan
7.4.7.1 Market Size, By Service, 2016-2026 (USD Million)
7.4.7.2 Market Size, By Application, 2016-2026 (USD Million)
7.4.7.3 Market Size, By Solution, 2016-2026 (USD Million)
7.4.9 Australia
7.4.9.1 Market Size, By Service, 2016-2026 (USD Million)
7.4.9.2 Market size, By Application, 2016-2026 (USD Million)
7.4.9.3 Market Size, By Solution, 2016-2026 (USD Million)
7.4.10 South Korea
7.4.10.1 Market Size, By Service, 2016-2026 (USD Million)
7.4.10.2 Market Size, By Application, 2016-2026 (USD Million)
7.4.10.3 Market Size, By Solution, 2016-2026 (USD Million)
7.5 Latin America
7.5.1 Market Size, By Country 2016-2026 (USD Million)
7.5.2 Market Size, By Service, 2016-2026 (USD Million)
7.5.3 Market Size, By Application, 2016-2026 (USD Million)
7.5.4 Market Size, By Solution, 2016-2026 (USD Million)
7.5.6 Brazil
7.5.6.1 Market Size, By Service, 2016-2026 (USD Million)
7.5.6.2 Market Size, By Application, 2016-2026 (USD Million)
7.5.6.3 Market Size, By Solution, 2016-2026 (USD Million)
7.5.7 Mexico
7.5.7.1 Market Size, By Service, 2016-2026 (USD Million)
7.5.7.2 Market Size, By Application, 2016-2026 (USD Million)
7.5.7.3 Market Size, By Solution, 2016-2026 (USD Million)
7.5.8 Argentina
7.5.7.1 Market Size, By Service, 2016-2026 (USD Million)
7.5.7.2 Market Size, By Application, 2016-2026 (USD Million)
7.5.7.3 Market Size, By Solution, 2016-2026 (USD Million)
7.6 MEA
7.6.1 Market Size, By Country 2016-2026 (USD Million)
7.6.2 Market Size, By Service, 2016-2026 (USD Million)
7.6.3 Market Size, By Application, 2016-2026 (USD Million)
7.6.4 Market Size, By Solution, 2016-2026 (USD Million)
7.6.6 Saudi Arabia
7.6.6.1 Market Size, By Service, 2016-2026 (USD Million)
7.6.6.2 Market Size, By Application, 2016-2026 (USD Million)
7.6.6.3 Market Size, By Solution, 2016-2026 (USD Million)
7.6.7 UAE
7.6.7.1 Market Size, By Service, 2016-2026 (USD Million)
7.6.7.2 Market Size, By Application, 2016-2026 (USD Million)
7.6.7.3 Market Size, By Solution, 2016-2026 (USD Million)
7.6.8 South Africa
7.6.7.1 Market Size, By Service, 2016-2026 (USD Million)
7.6.7.2 Market Size, By Application, 2016-2026 (USD Million)
7.6.7.3 Market Size, By Solution, 2016-2026 (USD Million)
Chapter 8 Company Landscape
8.1 Competitive Analysis, 2020
8.2 Symantec Corporation
8.2.1 Company Overview
8.2.2 Financial Analysis
8.2.3 Strategic Positioning
8.2.4 Info Graphic Analysis
8.3 Cisco
8.3.1 Company Overview
8.3.2 Financial Analysis
8.3.3 Strategic Positioning
8.3.4 Info Graphic Analysis
8.4 Palo Alto Networks, Inc.
8.4.1 Company Overview
8.4.2 Financial Analysis
8.4.3 Strategic Positioning
8.4.4 Info Graphic Analysis
8.5 Lastline Inc.
8.5.1 Company Overview
8.5.2 Financial Analysis
8.5.3 Strategic Positioning
8.5.4 Info Graphic Analysis
8.6 Check Point Software Technologies Ltd
8.6.1 Company Overview
8.6.2 Financial Analysis
8.6.3 Strategic Positioning
8.6.4 Info Graphic Analysis
8.7 SonicWall
8.7.1 Company Overview
8.7.2 Financial Analysis
8.7.3 Strategic Positioning
8.7.4 Info Graphic Analysis
8.8 McAfee, Inc.
8.8.1 Company Overview
8.8.2 Financial Analysis
8.8.3 Strategic Positioning
8.8.4 Info Graphic Analysis
8.9 FireEye, Inc.
8.8.1 Company Overview
8.8.2 Financial Analysis
8.8.3 Strategic Positioning
8.8.4 Info Graphic Analysis
8.10 Fortinet, Inc
8.10.1 Company Overview
8.10.2 Financial Analysis
8.10.3 Strategic Positioning
8.10.4 Info Graphic Analysis
8.11 Other Companies
8.11.1 Company Overview
8.11.2 Financial Analysis
8.11.3 Strategic Positioning
8.11.4 Info Graphic Analysis
The Global Network Security Sandbox Market has been studied from the year 2019 till 2026. However, the CAGR provided in the report is from the year 2021 to 2026. The research methodology involved three stages: Desk research, Primary research, and Analysis & Output from the entire research process.

The desk research involved a robust background study which meant referring to paid and unpaid databases to understand the market dynamics; mapping contracts from press releases; identifying the key players in the market, studying their product portfolio, competition level, annual reports/SEC filings & investor presentations; and learning the demand and supply-side analysis for the Network Security Sandbox Market.

The primary research activity included telephonic conversations with more than 50 tier 1 industry consultants, distributors, and end-use product manufacturers.

Finally, based on the above thorough research process, an in-depth analysis was carried out considering the following aspects: market attractiveness, current & future market trends, market share analysis, SWOT analysis of the company and customer analytics.

Frequently Asked Questions

This FREE sample includes market data points, ranging from trend analyses to market estimates & forecasts. See for yourself.
Or view our licence options:
Tailor made solutions just for you
80% of our clients seek made-to-order reports. How do you want us to tailor yours?
OUR CLIENTS


