This report was recently updated on August 9 2025 with the latest and most recent
market numbers
Global Offshore IT Services Market Size, Trends, and Analysis - Forecasts To 2026 By Type of Services (Quality Control, Cyber Security, Development & Operation Services, IT Relocation, Software Development [Custom Application Development, Web Application Development, Mobile Application Development], Staff Augmentation, Solution Architecture, Big Data & Analytics, and Others), By Industries Served (BFSI, Healthcare, Education, Travel and Hospitality, Telecom, Retail & E-Commerce, Logistics, Media & Entertainment, and Others), By Number of Development Centers (2 to 5 Centers, 5 to 7 Centers, and 8 Centers and above), By Region (North America, Asia Pacific, CSA, Europe, and the Middle East and Africa); End-User Landscape, Company Market Share Analysis & Competitor Analysis
The global offshore IT services market is primarily driven by a growth in the number of startups, non-tech businesses & IT companies seeking professional expertise from sources other than their workforce. Expansion in the use of modern technologies to administer, test, develop, deploy, debug, and configure a company's computing hardware and software on a constant schedule is further leading to high demand for the offshore IT services market. Additionally, an increase in emphasis on time-saving prospects with the help of an IT-functional professional or team that offers insightful ideas on a routine topic and gives the answer in a short period are boosting the global offshore IT services market.
Furthermore, the surge in the volume of startups is leading to the offshore IT services market gaining traction because with limited budget fresh talent including developers, engineers, designers from an outsourcing company could be hired as per the project requirements. Globally, in the IT companies, there is a growing need for budget-saving, economical approach on on-boarding specialized employees & devices for a unique IT project, and minimization of additional IT benefits typically utilized to retain the workforce. This is the major factor responsible for the development of the offshore IT services market.
Global offshore IT services further aids in working efficiently even with the time-zone differences with the acquired specialist or a consultant as per the project scope. Also, it circumvents lengthy hiring procedures, helps in compelled meticulous software development & planning, delivers after-project support, and enhanced overall IT services accuracy which leads to the spike in the volume of companies relying on offshore IT services. Moreover, the growing necessity to sustain a virtualized IT environment and cybersecurity is a primary driver of the offshore IT services business. Increased migration and digitalization to the cloud framework are also fueling global demand for the offshore IT services paradigm. Globally, offshore IT services are working as per the IT industry standards of ISO 9001 for Quality Management and ISO 27001 for Information Security Standard which boosts the overall brand image of the offshore IT services firm and leads to an uptick in demand for such services.
The advancement of the Industrial Internet of Things (IIoT) throughout the Industry 4.0 platform is predicted to drive demand for IT operations inside the heterogeneous information technology-managed ecosystem. Organizations are outsourcing these IT functions in order to stay up with market changes while lowering administrative costs and lead time. Nonetheless, the global market's pace of growth is slowing due to an increase in the proportion of firms' Global In-house Centers (GICs) and due to rising security & privacy issues.
The increased demand for modern technology entailed high competency from all sizes and domains of businesses for custom software development, software outsourcing services, software product development, web application development, cloud migration services, mobile app development, software testing services, and many more are expected to open up new prospects for the global offshore IT services market. Moreover, offshoring information technology activities to developing countries for cost savings, currency volatility reduction, and compliance with offset responsibilities have been driving the global offshore IT services market.
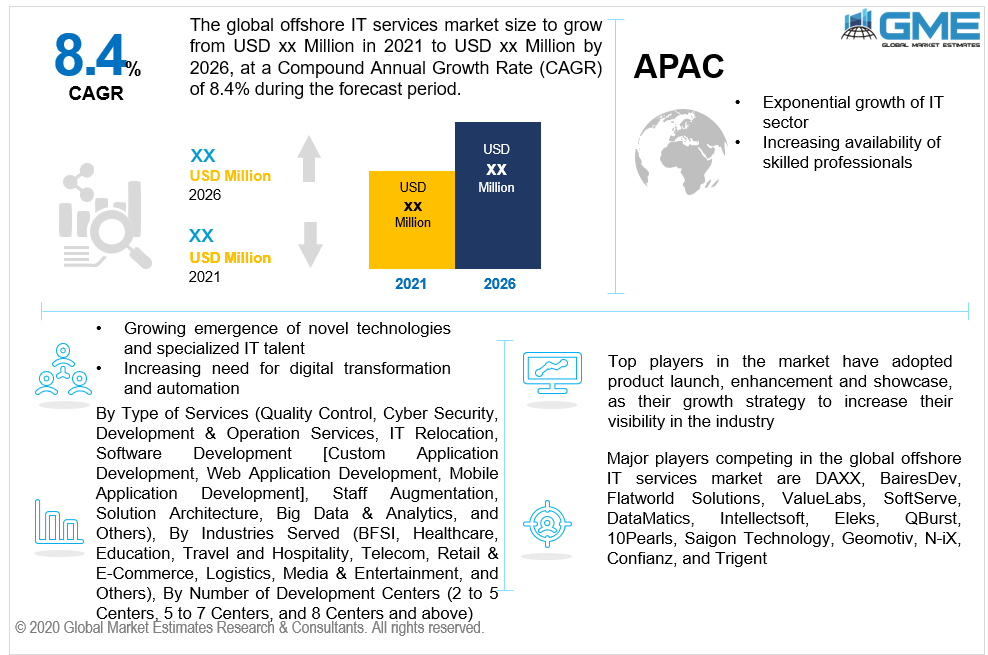
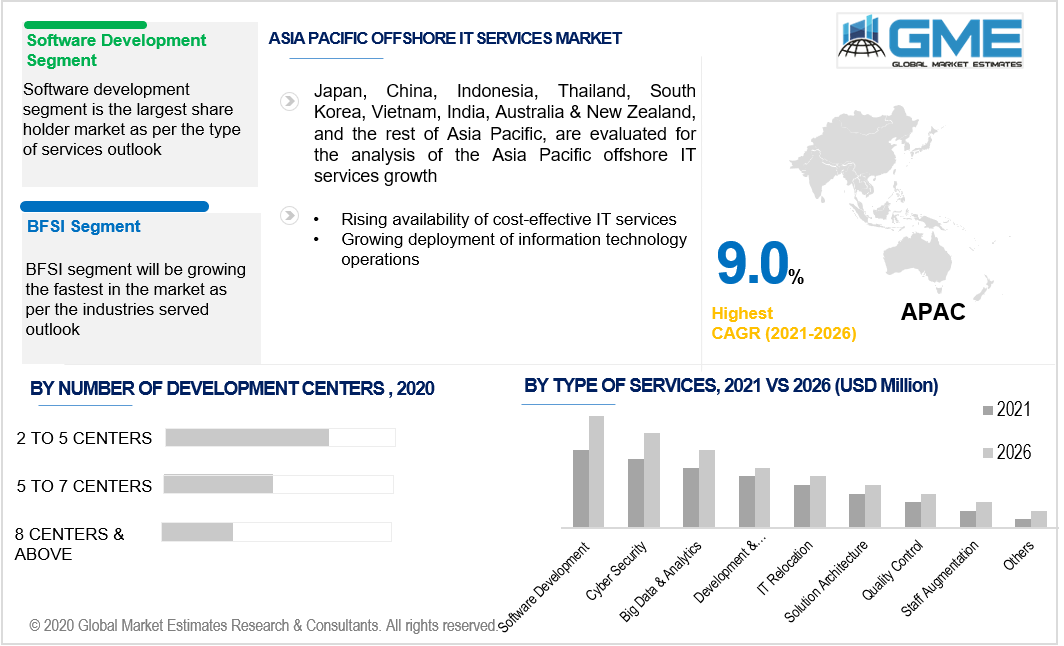
Based on the type of services the market has been segmented into quality control, cybersecurity, development & operation services, IT relocation, software development, staff augmentation, solution architecture, big data & analytics, and others. Software development includes custom application development, web application development, mobile application development. Software development is foreseen to lead because there is an uptick in the demand for software, web & mobile application from all the major business domains. Brands operating in diverse fields are adopting such personalized software and applications because individuals are more reliant on online channels and there is a revolutionary shift towards digitization. Unlike widely available off-the-shelf software and application, designed precisely to the demands of the intended customers, leads to the supremacy of this segment.
Based on the type of industries serving, the market has been categorized as BFSI, healthcare, education, travel and hospitality, telecom, retail & e-commerce, logistics, media & entertainment, and others. BFSI segment is foreseen to lead. Due to its major investments by BFSI in business intelligence, visualization, advanced analytics, enterprise performance management, automation, AI-based conversational platforms, and cybersecurity, the BFSI segment is foreseen to have the highest revenue share. Increased use of innovative technologies in the novel banking product and services development is expected to boost market development.
Based on the number of development centers the market is classified as 2 to 5 centers, 5 to 7 centers, and 8 centers and above. 2 to 5 centers are foreseen to lead. The major aim for hiring offshore IT services is to achieve budget management while enabling the business to keep concentrated on their primary competencies. Thus, 2 to 5 centers are extensively employed by organizations since it gives access to the huge IT talent pool with adaptive culture and efficient utilization of service model and cloud deployment services. Also, it enhances the overall operational efficiency of all the stakeholders under the agreement of offshore IT services.
In the global offshore services market, Europe is foreseen to predominate. Because of its early technological adoption and consistent growth in standardized process-related services and industry-specialized services throughout the region is assisting in the growth of core market players. The presence of professionals with experience in complex projects, vital research & development center for multinationals, and a high volume of Silicon Valley businesses will eventually lead to the supremacy of Europe in the global offshore IT services market.
Asia Pacific is expected to rise at the highest CAGR. The major factor of growth in the region is the exponential growth of IT companies. Asia Pacific has one of the most developed information technology businesses, as well as the greatest pool of IT professionals. As an outcome, the region has generated exceptionally talented developers, consultants, and engineers who have been recognized as the world's greatest assets. This is leading to the widespread expansion of the offshore IT services market in the APAC region.
Major players competing in the global offshore IT services market are DAXX, BairesDev, Flatworld Solutions, ValueLabs, SoftServe, DataMatics, Intellectsoft, Eleks, QBurst, 10Pearls, Saigon Technology, Geomotiv, N-iX, Confianz, and Trigent among others.
Please note: This is not an exhaustive list of companies profiled in the report.
Chapter 1 Methodology
1.1 Market Scope & Definitions
1.2 Estimates & Forecast Calculation
1.3 Historical Data Overview And Validation
1.4 Data Sources
1.4.1 Secondary
1.4.2 Primary
Chapter 2 Report Outlook
2.1 Global Offshore IT Services Industry Overview, 2016-2026
2.1.1 Industry Overview
2.1.2 Type of Services Overview
2.1.3 Industries Served Overview
2.1.4 Number of Development Centers Overview
2.1.5 Regional Overview
Chapter 3 Global Offshore IT Services Market Trends
3.1 Market Segmentation
3.2 Industry Background, 2016-2026
3.3 Market Key Trends
3.3.1 Positive Trends
3.3.1.1 Rising Adoption of Advanced Technologies
3.3.1.2 Increasing Emphasis on Developing Cost-Effective IT-Efficient Infrastructure
3.3.2 Industry Challenges
3.3.2.1 Safety and Privacy Concerns
3.4 Prospective Growth Scenario
3.4.1 Type of Services Growth Scenario
3.4.2 Industries Served Growth Scenario
3.4.3 Number of Development Centers Growth Scenario
3.5 COVID-19 Influence over Industry Growth
3.6 Porter’s Analysis
3.7 PESTEL Analysis
3.8 Value Chain & Supply Chain Analysis
3.9 Regulatory Framework
3.9.1 North America
3.9.2 Europe
3.9.3 APAC
3.9.4 LATAM
3.9.5 MEA
3.10 Technology Overview
3.11 Market Share Analysis, 2020
3.11.1 Company Positioning Overview, 2020
Chapter 4 Global Offshore IT Services Market, By Type of Services
4.1 Type of Services Outlook
4.2 Quality Control
4.2.1 Market Size, By Region, 2016-2026 (USD Million)
4.3 Cyber Security
4.3.1 Market Size, By Region, 2016-2026 (USD Million)
4.4 Development & Operation Services
4.4.1 Market Size, By Region, 2016-2026 (USD Million)
4.5 IT Relocation
4.5.1 Market Size, By Region, 2016-2026 (USD Million)
4.6 Software Development
4.6.1 Market Size, By Region, 2016-2026 (USD Million)
4.7 Staff Augmentation
4.7.1 Market Size, By Region, 2016-2026 (USD Million)
4.8 Solution Architecture
4.3.1 Market Size, By Region, 2016-2026 (USD Million)
4.9 Big Data & Analytics
4.3.1 Market Size, By Region, 2016-2026 (USD Million)
4.10 Others
4.10.1 Market Size, By Region, 2016-2026 (USD Million)
Chapter 5 Global Offshore IT Services Market, By Industries Served
5.1 Industries Served Outlook
5.2 BFSI
5.2.1 Market Size, By Region, 2016-2026 (USD Million)
5.3 Healthcare
5.3.1 Market Size, By Region, 2016-2026 (USD Million)
5.4 Education
5.4.1 Market Size, By Region, 2016-2026 (USD Million)
5.5 Travel and Hospitality
5.5.1 Market Size, By Region, 2016-2026 (USD Million)
5.6 Telecom
5.6.1 Market Size, By Region, 2016-2026 (USD Million)
5.7 Retail & E-Commerce
5.7.1 Market Size, By Region, 2016-2026 (USD Million)
5.8 Logistics
5.8.1 Market Size, By Region, 2016-2026 (USD Million)
5.9 Media & Entertainment
5.9.1 Market Size, By Region, 2016-2026 (USD Million)
5.10 Others
5.10.1 Market Size, By Region, 2016-2026 (USD Million)
Chapter 6 Global Offshore IT Services Market, By Number of Development Centers
6.1 Number of Development Centers Outlook
6.2 2 to 5 Centers
6.2.1 Market Size, By Region, 2016-2026 (USD Million)
6.3 5 to 7 Centers
6.3.1 Market Size, By Region, 2016-2026 (USD Million)
6.4 8 Centers and above
6.4.1 Market Size, By Region, 2016-2026 (USD Million)
Chapter 7 Global Offshore IT Services Market, By Region
7.1 Regional outlook
7.2 North America
7.2.1 Market Size, By Country 2016-2026 (USD Million)
7.2.2 Market Size, By Type of Services, 2016-2026 (USD Million)
7.2.3 Market Size, By Industries Served, 2016-2026 (USD Million)
7.2.4 Market Size, By Number of Development Centers, 2016-2026 (USD Million)
7.2.5 U.S.
7.2.5.1 Market Size, By Type of Services, 2016-2026 (USD Million)
7.2.5.2 Market Size, By Industries Served, 2016-2026 (USD Million)
7.2.5.3 Market Size, By Number of Development Centers, 2016-2026 (USD Million)
7.2.6 Canada
7.2.6.1 Market Size, By Type of Services, 2016-2026 (USD Million)
7.2.6.2 Market Size, By Industries Served, 2016-2026 (USD Million)
7.2.6.3 Market Size, By Number of Development Centers, 2016-2026 (USD Million)
7.3 Europe
7.3.1 Market Size, By Country 2016-2026 (USD Million)
7.3.2 Market Size, By Type of Services, 2016-2026 (USD Million)
7.3.3 Market Size, By Number of Development Centers, 2016-2026 (USD Million)
7.3.4 Market Size, By Number of Development Centers, 2016-2026 (USD Million)
7.3.5 Germany
7.3.5.1 Market Size, By Type of Services, 2016-2026 (USD Million)
7.3.5.2 Market Size, By Industries Served, 2016-2026 (USD Million)
7.3.5.3 Market Size, By Number of Development Centers, 2016-2026 (USD Million)
7.3.6 UK
7.3.6.1 Market Size, By Type of Services, 2016-2026 (USD Million)
7.3.6.2 Market Size, By Industries Served, 2016-2026 (USD Million)
7.3.6.3 Market Size, By Number of Development Centers, 2016-2026 (USD Million)
7.3.7 France
7.3.7.1 Market Size, By Type of Services, 2016-2026 (USD Million)
7.3.7.2 Market Size, By Industries Served, 2016-2026 (USD Million)
7.3.7.3 Market Size, By Number of Development Centers, 2016-2026 (USD Million)
7.3.8 Italy
7.3.8.1 Market Size, By Type of Services, 2016-2026 (USD Million)
7.3.8.2 Market Size, By Industries Served, 2016-2026 (USD Million)
7.3.8.3 Market Size, By Number of Development Centers, 2016-2026 (USD Million)
7.3.9 Spain
7.3.9.1 Market Size, By Type of Services, 2016-2026 (USD Million)
7.3.9.2 Market Size, By Industries Served, 2016-2026 (USD Million)
7.3.9.3 Market Size, By Number of Development Centers, 2016-2026 (USD Million)
7.3.10 Russia
7.3.10.1 Market Size, By Type of Services, 2016-2026 (USD Million)
7.3.10.2 Market Size, By Industries Served, 2016-2026 (USD Million)
7.3.10.3 Market Size, By Number of Development Centers, 2016-2026 (USD Million)
7.4 Asia Pacific
7.4.1 Market Size, By Country 2016-2026 (USD Million)
7.4.2 Market Size, By Type of Services, 2016-2026 (USD Million)
7.4.3 Market Size, By Industries Served, 2016-2026 (USD Million)
7.4.4 Market Size, By Number of Development Centers, 2016-2026 (USD Million)
7.4.5 China
7.4.5.1 Market Size, By Type of Services, 2016-2026 (USD Million)
7.4.5.2 Market Size, By Industries Served, 2016-2026 (USD Million)
7.4.5.3 Market Size, By Number of Development Centers, 2016-2026 (USD Million)
7.4.6 India
7.4.6.1 Market Size, By Type of Services, 2016-2026 (USD Million)
7.4.6.2 Market Size, By Industries Served, 2016-2026 (USD Million)
7.4.6.3 Market Size, By Number of Development Centers, 2016-2026 (USD Million)
7.4.7 Japan
7.4.7.1 Market Size, By Type of Services, 2016-2026 (USD Million)
7.4.7.2 Market Size, By Industries Served, 2016-2026 (USD Million)
7.4.7.3 Market Size, By Number of Development Centers, 2016-2026 (USD Million)
7.4.8 Australia
7.4.8.1 Market Size, By Type of Services, 2016-2026 (USD Million)
7.4.8.2 Market size, By Industries Served, 2016-2026 (USD Million)
7.4.8.3 Market Size, By Number of Development Centers, 2016-2026 (USD Million)
7.4.9 South Korea
7.4.9.1 Market Size, By Type of Services, 2016-2026 (USD Million)
7.4.9.2 Market Size, By Industries Served, 2016-2026 (USD Million)
7.4.9.3 Market Size, By Number of Development Centers, 2016-2026 (USD Million)
7.5 Latin America
7.5.1 Market Size, By Country 2016-2026 (USD Million)
7.5.2 Market Size, By Type of Services, 2016-2026 (USD Million)
7.5.3 Market Size, By Industries Served, 2016-2026 (USD Million)
7.5.4 Market Size, By Number of Development Centers, 2016-2026 (USD Million)
7.5.5 Brazil
7.5.5.1 Market Size, By Type of Services, 2016-2026 (USD Million)
7.5.5.2 Market Size, By Industries Served, 2016-2026 (USD Million)
7.5.5.3 Market Size, By Number of Development Centers, 2016-2026 (USD Million)
7.5.6 Mexico
7.5.6.1 Market Size, By Type of Services, 2016-2026 (USD Million)
7.5.6.2 Market Size, By Industries Served, 2016-2026 (USD Million)
7.5.6.3 Market Size, By Number of Development Centers, 2016-2026 (USD Million)
7.5.7 Argentina
7.5.7.1 Market Size, By Type of Services, 2016-2026 (USD Million)
7.5.7.2 Market Size, By Industries Served, 2016-2026 (USD Million)
7.5.7.3 Market Size, By Number of Development Centers, 2016-2026 (USD Million)
7.6 MEA
7.6.1 Market Size, By Country 2016-2026 (USD Million)
7.6.2 Market Size, By Type of Services, 2016-2026 (USD Million)
7.6.3 Market Size, By Industries Served, 2016-2026 (USD Million)
7.6.4 Market Size, By Number of Development Centers, 2016-2026 (USD Million)
7.6.5 Saudi Arabia
7.6.5.1 Market Size, By Type of Services, 2016-2026 (USD Million)
7.6.5.2 Market Size, By Industries Served, 2016-2026 (USD Million)
7.6.5.3 Market Size, By Number of Development Centers, 2016-2026 (USD Million)
7.6.6 UAE
7.6.6.1 Market Size, By Type of Services, 2016-2026 (USD Million)
7.6.6.2 Market Size, By Industries Served, 2016-2026 (USD Million)
7.6.6.3 Market Size, By Number of Development Centers, 2016-2026 (USD Million)
7.6.7 South Africa
7.6.7.1 Market Size, By Type of Services, 2016-2026 (USD Million)
7.6.7.2 Market Size, By Industries Served, 2016-2026 (USD Million)
7.6.7.3 Market Size, By Number of Development Centers, 2016-2026 (USD Million)
Chapter 8 Company Landscape
8.1 Competitive Analysis, 2020
8.2 DAXX
8.2.1 Company Overview
8.2.2 Financial Analysis
8.2.3 Strategic Positioning
8.2.4 Info Graphic Analysis
8.3 BairesDev
8.3.1 Company Overview
8.3.2 Financial Analysis
8.3.3 Strategic Positioning
8.3.4 Info Graphic Analysis
8.4 Flatworld Solutions
8.4.1 Company Overview
8.4.2 Financial Analysis
8.4.3 Strategic Positioning
8.4.4 Info Graphic Analysis
8.5 ValueLabs
8.5.1 Company Overview
8.5.2 Financial Analysis
8.5.3 Strategic Positioning
8.5.4 Info Graphic Analysis
8.6 SoftServe
8.6.1 Company Overview
8.6.2 Financial Analysis
8.6.3 Strategic Positioning
8.6.4 Info Graphic Analysis
8.7 DataMatics
8.7.1 Company Overview
8.7.2 Financial Analysis
8.7.3 Strategic Positioning
8.7.4 Info Graphic Analysis
8.8 Intellectsoft
8.8.1 Company Overview
8.8.2 Financial Analysis
8.8.3 Strategic Positioning
8.8.4 Info Graphic Analysis
8.9 Eleks
8.9.1 Company Overview
8.9.2 Financial Analysis
8.9.3 Strategic Positioning
8.9.4 Info Graphic Analysis
8.10 QBurst
8.10.1 Company Overview
8.10.2 Financial Analysis
8.10.3 Strategic Positioning
8.10.4 Info Graphic Analysis
8.11 10Pearls
8.11.1 Company Overview
8.11.2 Financial Analysis
8.11.3 Strategic Positioning
8.11.4 Info Graphic Analysis
8.12 Saigon Technology
8.12.1 Company Overview
8.12.2 Financial Analysis
8.12.3 Strategic Positioning
8.12.4 Info Graphic Analysis
8.13 Geomotiv
8.13.1 Company Overview
8.13.2 Financial Analysis
8.13.3 Strategic Positioning
8.13.4 Info Graphic Analysis
8.14 N-iX
8.14.1 Company Overview
8.14.2 Financial Analysis
8.14.3 Strategic Positioning
8.14.4 Info Graphic Analysis
8.15 Confianz
8.15.1 Company Overview
8.15.2 Financial Analysis
8.15.3 Strategic Positioning
8.15.4 Info Graphic Analysis
8.16 Trigent
8.16.1 Company Overview
8.16.2 Financial Analysis
8.16.3 Strategic Positioning
8.16.4 Info Graphic Analysis
8.17 Other Companies
8.17.1 Company Overview
8.17.2 Financial Analysis
8.17.3 Strategic Positioning
8.17.4 Info Graphic Analysis
The Global Offshore IT Services Market has been studied from the year 2019 till 2026. However, the CAGR provided in the report is from the year 2021 to 2026. The research methodology involved three stages: Desk research, Primary research, and Analysis & Output from the entire research process.

The desk research involved a robust background study which meant referring to paid and unpaid databases to understand the market dynamics; mapping contracts from press releases; identifying the key players in the market, studying their product portfolio, competition level, annual reports/SEC filings & investor presentations; and learning the demand and supply-side analysis for the Offshore IT Services Market.

The primary research activity included telephonic conversations with more than 50 tier 1 industry consultants, distributors, and end-use product manufacturers.

Finally, based on the above thorough research process, an in-depth analysis was carried out considering the following aspects: market attractiveness, current & future market trends, market share analysis, SWOT analysis of the company and customer analytics.

Frequently Asked Questions
![Global Offshore IT Services Market Size, Trends, and Analysis - Forecasts To 2026 By Type of Services (Quality Control, Cyber Security, Development & Operation Services, IT Relocation, Software Development [Custom Application Development, Web Application Development, Mobile Application Development], Staff Augmentation, Solution Architecture, Big Data & Analytics, and Others), By Industries Served (BFSI, Healthcare, Education, Travel and Hospitality, Telecom, Retail & E-Commerce, Logistics, Media & Entertainment, and Others), By Number of Development Centers (2 to 5 Centers, 5 to 7 Centers, and 8 Centers and above), By Region (North America, Asia Pacific, CSA, Europe, and the Middle East and Africa); End-User Landscape, Company Market Share Analysis & Competitor Analysis](https://www.globalmarketestimates.com/images/cat/Electronics, Semiconductors and Information & Communication Technology.png)
This FREE sample includes market data points, ranging from trend analyses to market estimates & forecasts. See for yourself.
Or view our licence options:
Tailor made solutions just for you
80% of our clients seek made-to-order reports. How do you want us to tailor yours?
OUR CLIENTS


