This report was recently updated on June 28 2025 with the latest and most recent
market numbers
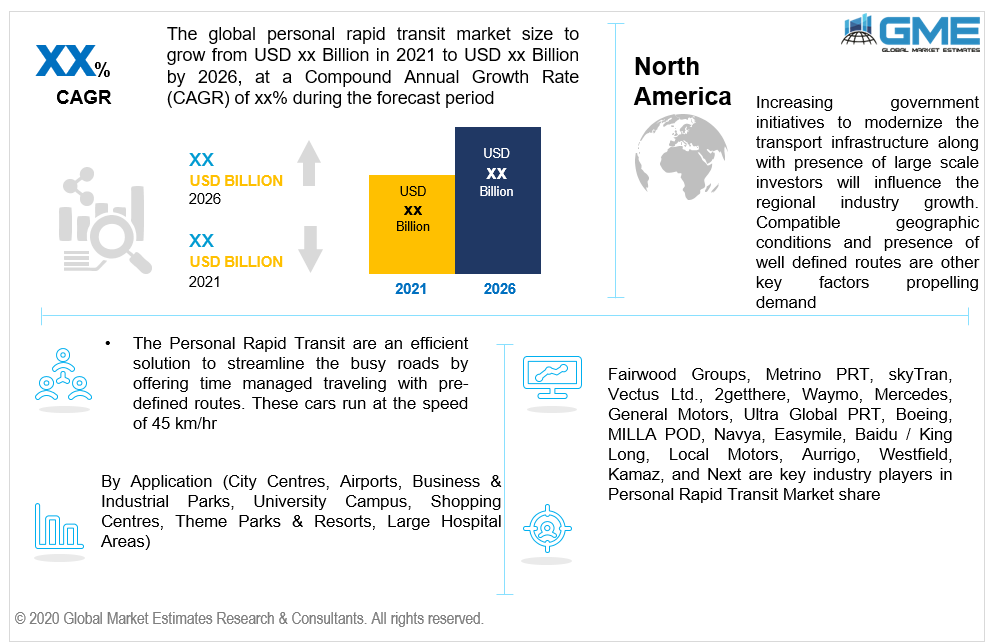
Global Personal Rapid Transit Market Size, Trends & Analysis - Forecasts to 2026 By Switching (Vehicle Switching, Track Switching), By Technology (Cloud Based, Web Based),By Application (City Centres, Airports, Business & Industrial Parks, University Campus, Shopping Centres, Theme Parks & Resorts, Large Hospital Areas), By Region (North America, Asia Pacific, Europe, Latin America, Middle East & Africa); End-User Landscape, Company Market Share Analysis, and Competitor Analysis
Increasing preference for sustainable traveling solutions to control pollution and streamline the congested traffic will drive the Personal Rapid Transit Market growth. These pod cars are highly efficient for small groups traveling consisting of 3 to 6 people at a time. Pod cars or Personal Rapid Transit are environment-friendly transportation concepts run by solar power and other renewable energy supplies. These transport facilities are noted to reduce around 50% of the carbon emission. PRT operates just like the regular rail and streetcar but is designed to travel above the roads and highway to reduce the congestion.
Increased government intervention to promote ecological transport solutions to standardize the traffic and reduce traveling time will promote the Personal Rapid Transit demand. Technologically advanced countries such as the U.S., England, UAE, Netherlands, and South Korea have already deployed the Personal Rapid Transit in their transport infrastructure. In the U.S., Morgantown has deployed these Pod taxi systems since 1975. In 2010, Masdar City, UAE launched CyberCab provided by 2getthere. In September 2013, South Korea launched SkyCube PRT developed by Vectus. The country also made operational stations for around 40 vehicles.
Personal Rapid Transitis an efficient solution to reorganize the busy roads by offering time-managed traveling with pre-defined routes. These cars run at the speed of 45 km/hr. Worsening traffic conditions due to overpopulation and the large presence of vehicles have resulted in time-consuming travels and more pollution. Inclination towards smart cities has propelled the demand for smart traveling solutions by bringing these intelligent autonomous vehicles. It is also estimated that the running cost will be around one-tenth of the traditional four-wheel cars. In 2018, UAE makes it official to launch development-focused smart transportation systems in the country. As per the Dubai Self Driving Transport Strategy, the nation plans to switch its 25% of the transport system to the automated vehicle by the end of 2030. Factors such as environment friendly, less complexity, and focused investment influenced the regional demand.
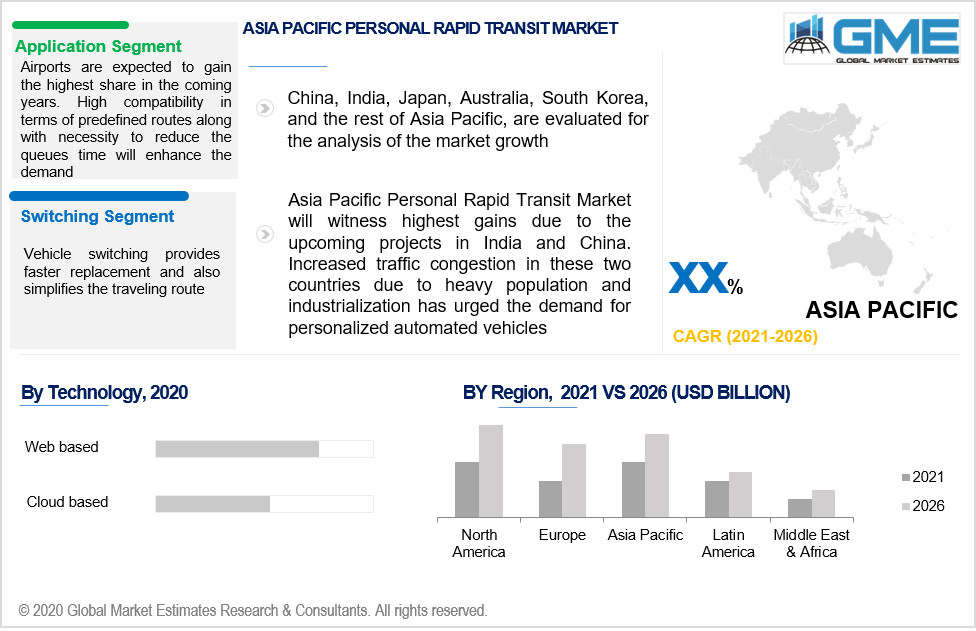
The Personal Rapid Transit runs on two switching types i.e. vehicle switching and track switching. Both the designs are made to complement the different traveling situations and needs. Vehicle switching provides faster replacement and also simplifies the traveling route. This switching makes the route less visually obtrusive and thereby reduces the malfunctions during the travel. Track switching involves the replacement of vehicle mechanisms with larger track moving components.
The Pod cars can be configured based on the client requirement which can be cloud-based or web-based. Factors such as network complexity, gradient, track length, and environmental circumstances decide the vehicle configuration types. Increasing preference for advanced systems to standardize the process will promote cloud-based connectivity in the Personal Rapid Transit Market.
City centers, business & industrial parks, shopping centers, airports, university campuses, theme parks & resorts, and large hospital areas are key application areas in the PRT industry. Increasing investment in personalized traveling solutions within a vicinity will influence the product demand. Advantages such as minimal cost, lesser traveling time, point-to-point connectivity, and privacy are key factors influencing the industry growth.
Airports are expected to gain the highest share in the coming years. High compatibility in terms of predefined routes due to strict traveling times along with the necessity to reduce the queues time will enhance the demand.
North America will dominate the industry share in the coming years. Increasing government initiatives to modernize the transport infrastructure along with the presence of large-scale investors will influence the regional industry growth. Compatible geographic conditions and the presence of well-defined routes are other key factors propelling demand.
The Asia Pacific Personal Rapid Transit Market will witness the highest gains due to the upcoming projects in India and China. Increased traffic congestion in these two countries due to heavy population and industrialization has urged the demand for personalized automated vehicles.
In India, vastly populated cities such as Delhi, Bangalore, and Gurgugram are on the verge of deploying the Pod cars system in various campuses and airports. Time-consuming traveling along with pressure from environmental factors have positively influenced the Indian PRT Market growth. Reliance industries is among the major investor in India to buy a stake and deploy pod taxi prototype.
Fairwood Groups, Metrino PRT, skyTran, Vectus Ltd., 2getthere, Waymo, Mercedes, General Motors, Ultra Global PRT, Boeing, MILLA POD, Navya, Easymile, Baidu / King Long, Local Motors, Aurrigo, Westfield, Kamaz, and Next are key industry players in Personal Rapid Transit Market share.
Please note: This is not an exhaustive list of companies profiled in the report.
Heavy investments and consistent technological advancements make the market highly competitive. Partnering with government bodies to build sustainable transport solutions are major activities witnessed in the industry. Forward integration and backward integration to gain a competitive edge.
Chapter 1 Methodology
1.1 Market scope & definitions
1.2 Estimates & forecast calculation
1.3 Historical data overview and validation
1.4 Data sources
1.4.1 Secondary
1.4.2 Primary
Chapter 2 Report Outlook
2.1 Personal Rapid Transit industry overview, 2016-2026
2.1.1 Industry overview
2.1.2 Switching overview
2.1.3 Technology overview
2.1.4 Application overview
2.1.5 Regional overview
Chapter 3 Personal Rapid Transit Market Trends
3.1 Market segmentation
3.2 Industry background, 2016-2026
3.3 Market key trends
3.3.1 Positive trends
3.3.2 Industry challenges
3.4 Prospective growth scenario
3.4.1 Technology growth scenario
3.4.2 Upcoming projects
3.4.3 Existing projects
3.4.3.1 Morgantown PRT by Boeing (U.S.)
3.4.3.2 ParkShuttle by 2getthere (Netherlands)
3.4.3.4 CyberCab by 2getthere (Abu Dhabi)
3.4.3.5 ULTra PRT by ULTra (England)
3.4.3.6 Skycube by Vectus (South Korea)
3.5 COVID-19 influence over industry growth
3.6 Porter’s analysis
3.7 PESTEL analysis
3.8 Value chain & supply chain analysis
3.9 Regulatory framework
3.9.1 North America
3.9.2 Europe
3.9.3 APAC
3.9.4 LATAM
3.9.5 MEA
3.10 Personal rapid transit manufacturing technology overview
3.10.1 Material
3.10.2 Process
3.11 Market share analysis, 2020
3.11.1 Company positioning overview, 2020
Chapter 4 Personal Rapid Transit Market, By Switching
4.1 Switching Outlook
4.2 Vehicle switching
4.2.1 Market size, by region, 2016-2026 (USD Million)
4.3 Track switching
4.3.1 Market size, by region, 2016-2026 (USD Million)
Chapter 5 Personal Rapid Transit Market, By Technology
5.1 Technology Outlook
5.2 Cloud based
5.2.1 Market size, by region, 2016-2026 (USD Million)
5.3 Web based
5.3.1 Market size, by region, 2016-2026 (USD Million)
Chapter 6 Personal Rapid Transit Market, By Application
6.1 Application Outlook
6.2 City centres
6.2.1 Market size, by region, 2016-2026 (USD Million)
6.3 Airports
6.3.1 Market size, by region, 2016-2026 (USD Million)
6.4 Business & industrial parks
6.4.1 Market size, by region, 2016-2026 (USD Million)
6.5 University campus
6.5.1 Market size, by region, 2016-2026 (USD Million)
6.6 Shopping centres
6.6.1 Market size, by region, 2016-2026 (USD Million)
6.7 Theme parks & resorts
6.7.1 Market size, by region, 2016-2026 (USD Million)
6.8 Large hospitals areas
6.8.1 Market size, by region, 2016-2026 (USD Million)
6.9 Others
6.9.1 Market size, by region, 2016-2026 (USD Million)
Chapter 7 Personal Rapid Transport Market, By Region
7.1 Regional outlook
7.2 North America
7.2.1 Market size, by country 2016-2026 (USD Million)
7.2.2 Market size, by switching, 2016-2026 (USD Million)
7.2.3 Market size, by technology, 2016-2026 (USD Million)
7.2.4 Market size, by application, 2016-2026 (USD Million)
7.2.5 U.S.
7.2.5.1 Market size, by switching, 2016-2026 (USD Million)
7.2.5.2 Market size, by technology, 2016-2026 (USD Million)
7.2.5.3 Market size, by application, 2016-2026 (USD Million)
7.2.6 Canada
7.2.6.1 Market size, by switching, 2016-2026 (USD Million)
7.2.6.2 Market size, by technology, 2016-2026 (USD Million)
7.2.6.3 Market size, by application, 2016-2026 (USD Million)
7.3 Europe
7.3.1 Market size, by country 2016-2026 (USD Million)
7.3.2 Market size, by switching, 2016-2026 (USD Million)
7.3.3 Market size, by technology, 2016-2026 (USD Million)
7.3.4 Market size, by application, 2016-2026 (USD Million)
7.3.5 Germany
7.2.5.1 Market size, by switching, 2016-2026 (USD Million)
7.2.5.2 Market size, by technology, 2016-2026 (USD Million)
7.2.5.3 Market size, by application, 2016-2026 (USD Million)
7.3.6 UK
7.3.6.1 Market size, by switching, 2016-2026 (USD Million)
7.3.6.2 Market size, by technology, 2016-2026 (USD Million)
7.3.6.3 Market size, by application, 2016-2026 (USD Million)
7.3.7 France
7.3.7.1 Market size, by switching, 2016-2026 (USD Million)
7.3.7.2 Market size, by technology, 2016-2026 (USD Million)
7.3.7.3 Market size, by application, 2016-2026 (USD Million)
7.3.8 Netherland
7.3.8.1 Market size, by switching, 2016-2026 (USD Million)
7.3.8.2 Market size, by technology, 2016-2026 (USD Million)
7.3.8.3 Market size, by application, 2016-2026 (USD Million)
7.3.9 Spain
7.3.9.1 Market size, by switching, 2016-2026 (USD Million)
7.3.9.2 Market size, by technology, 2016-2026 (USD Million)
7.3.9.3 Market size, by application, 2016-2026 (USD Million)
7.3.10 Russia
7.3.10.1 Market size, by switching, 2016-2026 (USD Million)
7.3.10.2 Market size, by technology, 2016-2026 (USD Million)
7.3.10.3 Market size, by application, 2016-2026 (USD Million)
7.4 Asia Pacific
7.4.1 Market size, by country 2016-2026 (USD Million)
7.4.2 Market size, by switching, 2016-2026 (USD Million)
7.4.3 Market size, by technology, 2016-2026 (USD Million)
7.4.4 Market size, by application, 2016-2026 (USD Million)
7.4.5 China
7.4.5.1 Market size, by switching, 2016-2026 (USD Million)
7.4.5.2 Market size, by technology, 2016-2026 (USD Million)
7.4.5.3 Market size, by application, 2016-2026 (USD Million)
7.4.6 India
7.4.6.1 Market size, by switching, 2016-2026 (USD Million)
7.4.6.2 Market size, by technology, 2016-2026 (USD Million)
7.4.6.3 Market size, by application, 2016-2026 (USD Million)
7.4.7 Japan
7.4.7.1 Market size, by switching, 2016-2026 (USD Million)
7.4.7.2 Market size, by technology, 2016-2026 (USD Million)
7.4.7.3 Market size, by application, 2016-2026 (USD Million)
7.4.8 Australia
7.4.8.1 Market size, by switching, 2016-2026 (USD Million)
7.4.8.2 Market size, by technology, 2016-2026 (USD Million)
7.4.8.3 Market size, by application, 2016-2026 (USD Million)
7.4.9 South Korea
7.4.9.1 Market size, by switching, 2016-2026 (USD Million)
7.4.9.2 Market size, by technology, 2016-2026 (USD Million)
7.4.9.3 Market size, by application, 2016-2026 (USD Million)
7.5 Latin America
7.5.1 Market size, by country 2016-2026 (USD Million)
7.5.2 Market size, by switching, 2016-2026 (USD Million)
7.5.3 Market size, by technology, 2016-2026 (USD Million)
7.5.4 Market size, by application, 2016-2026 (USD Million)
7.5.5 Brazil
7.5.5.1 Market size, by switching, 2016-2026 (USD Million)
7.5.5.2 Market size, by technology, 2016-2026 (USD Million)
7.5.5.3 Market size, by application, 2016-2026 (USD Million)
7.5.6 Mexico
7.5.6.1 Market size, by switching, 2016-2026 (USD Million)
7.5.6.2 Market size, by technology, 2016-2026 (USD Million)
7.5.6.3 Market size, by application, 2016-2026 (USD Million)
7.5.7 Argentina
7.5.7.1 Market size, by switching, 2016-2026 (USD Million)
7.5.7.2 Market size, by technology, 2016-2026 (USD Million)
7.5.7.3 Market size, by application, 2016-2026 (USD Million)
7.6 MEA
7.6.1 Market size, by country 2016-2026 (USD Million)
7.6.2 Market size, by switching, 2016-2026 (USD Million)
7.6.3 Market size, by technology, 2016-2026 (USD Million)
7.6.4 Market size, by application, 2016-2026 (USD Million)
7.6.5 Saudi Arabia
7.6.5.1 Market size, by switching, 2016-2026 (USD Million)
7.6.5.2 Market size, by technology, 2016-2026 (USD Million)
7.6.5.3 Market size, by application, 2016-2026 (USD Million)
7.6.6 UAE
7.6.6.1 Market size, by switching, 2016-2026 (USD Million)
7.6.6.2 Market size, by technology, 2016-2026 (USD Million)
7.6.6.3 Market size, by application, 2016-2026 (USD Million)
7.6.7 South Africa
7.6.7.1 Market size, by switching, 2016-2026 (USD Million)
7.6.7.2 Market size, by technology, 2016-2026 (USD Million)
7.6.7.3 Market size, by application, 2016-2026 (USD Million)
Chapter 8 Company Landscape
8.1 Competitive analysis, 2020
8.2 Fairwood Groups
8.2.1 Company overview
8.2.2 Financial analysis
8.2.3 Strategic positioning
8.2.4 Info graphic analysis
8.3 Metrino PRT
8.3.1 Company overview
8.3.2 Financial analysis
8.3.3 Strategic positioning
8.3.4 Info graphic analysis
8.4 skyTran
8.4.1 Company overview
8.4.2 Financial analysis
8.4.3 Strategic positioning
8.4.4 Info graphic analysis
8.5 Vectus Ltd.
8.5.1 Company overview
8.5.2 Financial analysis
8.5.3 Strategic positioning
8.5.4 Info graphic analysis
8.6 2getthere
8.6.1 Company overview
8.6.2 Financial analysis
8.6.3 Strategic positioning
8.6.4 Info graphic analysis
8.7 Waymo (Formerly Google)
8.7.1 Company overview
8.7.2 Financial analysis
8.7.3 Strategic positioning
8.7.4 Info graphic analysis
8.8 Mercedes
8.8.1 Company overview
8.8.2 Financial analysis
8.8.3 Strategic positioning
8.8.4 Info graphic analysis
8.9 General Motors
8.9.1 Company overview
8.9.2 Financial analysis
8.9.3 Strategic positioning
8.9.4 Info graphic analysis
8.10 Ultra Global PRT
8.10.1 Company overview
8.10.2 Financial analysis
8.10.3 Strategic positioning
8.10.4 Info graphic analysis
8.11 Boeing
8.11.1 Company overview
8.11.2 Financial analysis
8.11.3 Strategic positioning
8.11.4 Info graphic analysis
8.12 MILLA POD
8.12.1 Company overview
8.12.2 Financial analysis
8.12.3 Strategic positioning
8.12.4 Info graphic analysis
8.13 Navya
8.13.1 Company overview
8.13.2 Financial analysis
8.13.3 Strategic positioning
8.13.4 Info graphic analysis
8.14 Easymile
8.14.1 Company overview
8.14.2 Financial analysis
8.14.3 Strategic positioning
8.14.4 Info graphic analysis
8.15 Baidu / King Long
8.15.1 Company overview
8.15.2 Financial analysis
8.15.3 Strategic positioning
8.15.4 Info graphic analysis
8.16 Local Motors
8.16.1 Company overview
8.16.2 Financial analysis
8.16.3 Strategic positioning
8.16.4 Info graphic analysis
8.17 Aurrigo
8.17.1 Company overview
8.17.2 Financial analysis
8.17.3 Strategic positioning
8.17.4 Info graphic analysis
8.18 Westfield
8.18.1 Company overview
8.18.2 Financial analysis
8.18.3 Strategic positioning
8.18.4 Info graphic analysis
8.19 Kamaz
8.19.1 Company overview
8.19.2 Financial analysis
8.19.3 Strategic positioning
8.19.4 Info graphic analysis
8.20 Next
8.20.1 Company overview
8.20.2 Financial analysis
8.20.3 Strategic positioning
8.20.4 Info graphic analysis
The Global Personal Rapid Transit Market has been studied from the year 2019 till 2026. However, the CAGR provided in the report is from the year 2021 to 2026. The research methodology involved three stages: Desk research, Primary research, and Analysis & Output from the entire research process.

The desk research involved a robust background study which meant referring to paid and unpaid databases to understand the market dynamics; mapping contracts from press releases; identifying the key players in the market, studying their product portfolio, competition level, annual reports/SEC filings & investor presentations; and learning the demand and supply-side analysis for the Personal Rapid Transit Market.

The primary research activity included telephonic conversations with more than 50 tier 1 industry consultants, distributors, and end-use product manufacturers.

Finally, based on the above thorough research process, an in-depth analysis was carried out considering the following aspects: market attractiveness, current & future market trends, market share analysis, SWOT analysis of the company and customer analytics.


This FREE sample includes market data points, ranging from trend analyses to market estimates & forecasts. See for yourself.
Or view our licence options:
Tailor made solutions just for you
80% of our clients seek made-to-order reports. How do you want us to tailor yours?
OUR CLIENTS


