This report was recently updated on August 20 2025 with the latest and most recent
market numbers
Global Plant Based Bioactives Market Size, Trends & Analysis - Forecasts to 2026 By Source (Fruits & Vegetables, Plants, Legumes), By Application (Flavonoids, Phenolic Acids, Alkaloids, Saponins, Polysaccharides ),By End-Use (Functional Foods & Beverage, Dietary Supplements, Animal Nutrition, Personal Care), By Region (North America, Asia Pacific, Europe, Latin America, Middle East & Africa); End-User Landscape, Company Market Share Analysis, and Competitor Analysis
Growing health concerns pertaining to the excessive use of inorganic compounds in food, medicine, and personal care industry have reinforced the adoption of Plant Based Bioactives. Increasing consumer awareness accompanied by a preference for a healthy lifestyle in taking a balanced diet will stimulate the industry growth in the coming years.
Change in buying habits has reinforced industry providers to work on more sustainable products for better consumer reach. With the advent of the consumer-centric market and the presence of a large number of manufacturers, it became essential to produce goods that are aligned with the consumer viewpoint.
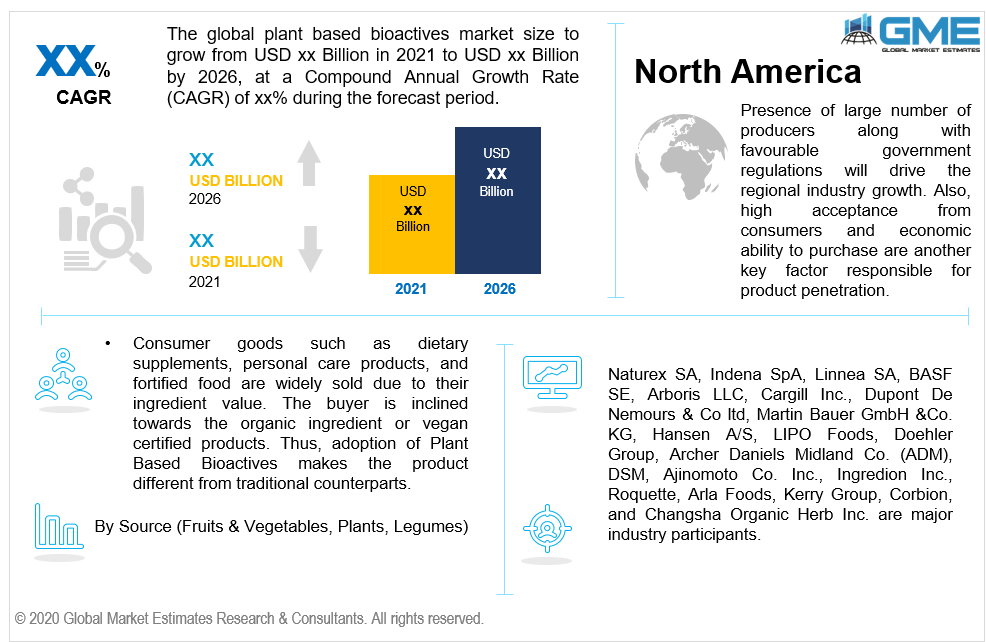
Consumer goods such as dietary supplements, personal care products, and fortified food are widely sold due to their ingredient value. The buyer is inclined towards the organic ingredient or vegan certified products. Thus, the adoption of Plant Based Bioactives makes the product different from its traditional counterparts.
Key influential factors such as the increasing geriatric population along with the rising number of incidences of chronic diseases have triggered consumers to take health supplements, which will result in Plant Based Bioactive Market growth. Also, the introduction of antioxidant and vitamin-enriched shakes and smoothies has propelled the demand for bio-based functional food and dietary supplements.
Other health factors such as diabetes, obesity, high blood pressure, and anxiety issues among the young population due to hectic lifestyle have induced the intake of dietary supplements. In addition, the support from doctors to prescribe the herbal-based protein powder and nutraceuticals as a part of daily consumption will inculcate the Plant Based Bioactives ingredient penetration.
Scientific evidence has proved that plant based bioactive used in functional food and other dietary supplements have resulted in positive effects on human health. Concerns such as inflation, allergy, and toxins were effectively reduced with the consumption of these ingredient-based products. Increased healthcare industry-focused towards prevention before treatment has encouraged the research & development of organic ingredients.
Fruits & vegetables, plants, and legumes are major identified sources in the Plant Based Bioactives industry. Growing demand for vegan products either for consumption or non-consumption applications has propelled the usage of Plant Based Bioactives in the functional food and personal care industry.
Legumes and fruits & vegetables are the major contributing sources in the industry due to their high efficiency and availability. These sources are enriched with antioxidant properties which positively react with the human body on consumption. Soy is one of the most enriched legume and is widely used as an ingredient in functional food.
Fruits & vegetables are further sub segmented into carrots, broccoli, citrus fruits, tomatoes, and leafy vegetables. These sources are organic and hold a high potential for further usage as an ingredient in various applications. Fruits & vegetable extracts also have high penetration in the personal care industry. Increasing demand for different fragrant and properties creams, lotion, and shampoo has instigated demand for organic personal care products.
Plant Based Bioactives applications include but are not limited to flavonoids, carotenoids, phenolic acids, alkaloids,saponins, and polysaccharides. These ingredients are capable to modulatethe human metabolic processes and reflect positive responses such as receptor activity inhibition, antioxidant effect, enzyme induction and gene expression inhibition.
Strengthening the immune system, slowing cancer cell growth, and preventing human body from damage due to oxidation are major causes to use these sources as an integral ingredient in various products. Carotenoids is among the major contributor in application segment due to its positive impact on reducing the risk of cataract, Alzheimer, heart disease, stroke, and age related diseases.
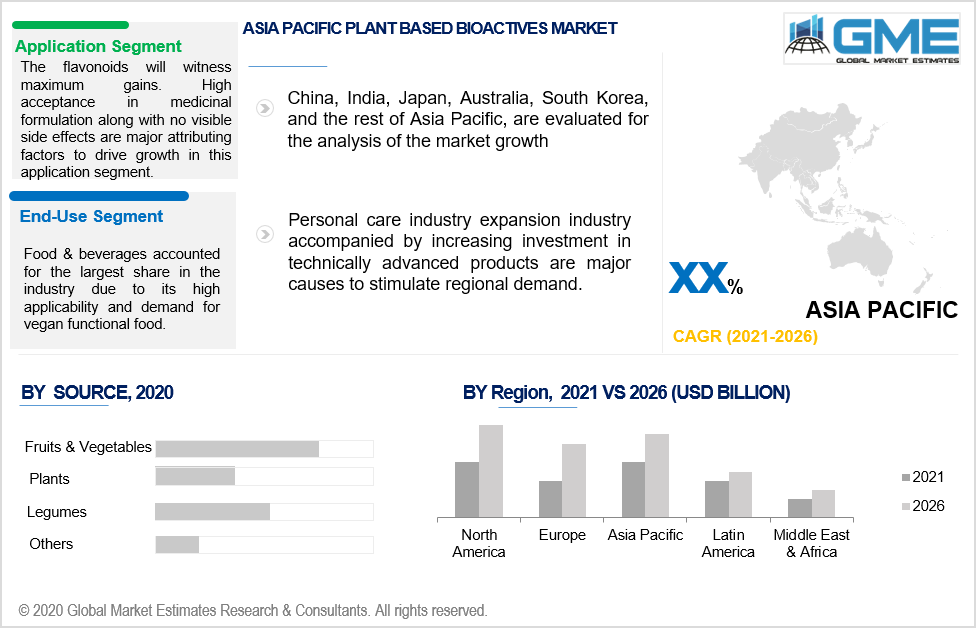
The flavonoids are expected to witness maximum gains during the forecast period. High acceptance in medicinal formulation along with no visible side effects are major attributing factors to drive growth in this application segment.
Functional food & beverages, dietary supplements, animal nutrition, and personal care are major contributing sectors in the industry. Food & beverages accounted for the largest share in the industry due to its high applicability and demand for vegan functional food. Key influencing factors such as rising trend for healthy consumption habits and preference for vegan products over animal derivatives have proliferated the penetration in this segment.
Dietary supplements are projected to witness the highest gains in the coming year. Nutraceutical industry expansion along with surging demand for immunity boosters has urged the product demand in dietary supplements. Demand in the personal care segment is highly influenced by the wide availability of these ingredients with diversified beneficial properties. It has become a trend among consumers to use organic ingredients in personal care products to attain sustainable and long-term results.
North America will witness the largest share in the coming years. The presence of large number of producers along with favorable government regulations will drive the regional industry growth. Also, high acceptance from consumers and economic ability to purchase is another key factor responsible for product penetration.
Europe Plant Based Bioactives Market is highly inclined by rising need to boost immunity among young and geriatric population. The region has a high number population suffering from heart diseases, alzhemiers, and diabetes. The UK, Germany, Italy, and Spain will be key contributing countries in the region.
Asia Pacific is projected to witness the highest gains up to 2026. Personal care industry expansion industry accompanied by increasing investment in technically advanced products are major causes to stimulate regional demand.
Naturex SA, IndenaSpA, Linnea SA, BASF SE, Arboris LLC, Cargill Inc., Dupont De Nemours & Co ltd, Martin Bauer GmbH &Co. KG, Hansen A/S, LIPO Foods, Doehler Group, Archer Daniels Midland Co. (ADM), DSM, Ajinomoto Co. Inc., Ingredion Inc., Roquette, Arla Foods, Kerry Group, Corbion, and Changsha Organic Herb Inc. are major industry participants.
Please note: This is not an exhaustive list of companies profiled in the report.
Chapter 1 Methodology
1.1 Market scope & definitions
1.2 Estimates & forecast calculation
1.3 Historical data overview and validation
1.4 Data sources
1.4.1 Secondary
1.4.2 Primary
Chapter 2 Report Outlook
2.1 Plant based bioactives industry overview, 2016-2026
2.1.1 Industry overview
2.1.2 Source overview
2.1.3 Application overview
2.1.4 End-Use overview
2.1.5 Regional overview
Chapter 3 Plant Based Bioactives Market Trends
3.1 Market segmentation
3.2 Industry background, 2016-2026
3.3 Market key trends
3.3.1 Positive trends
3.3.2 Industry challenges
3.4 Prospective growth scenario
3.4.1 Application growth scenario
3.4.2 End-Use growth scenario
3.5 COVID-19 influence over industry growth
3.6 Porter’s analysis
3.7 PESTEL analysis
3.8 Value chain & supply chain analysis
3.9 Regulatory framework
3.9.1 North America
3.9.2 Europe
3.9.3 APAC
3.9.4 LATAM
3.9.5 MEA
3.10 Technology overview
3.11 Market share analysis, 2020
3.11.1 Company positioning overview, 2020
Chapter 4 Plant Based Bioactives Market, By Source
4.1 Source Outlook
4.2 Fruits & Vegetables
4.2.1 Market size, by region, 2016-2026 (USD Million)
4.3 Plants
4.3.1 Market size, by region, 2016-2026 (USD Million)
4.4 Legumes
4.4.1 Market size, by region, 2016-2026 (USD Million)
4.5 Others
4.5.1 Market size, by region, 2016-2026 (USD Million)
Chapter 5 Plant Based Bioactives Market, By Application
5.1 Application Outlook
5.2 Flavonoids
5.2.1 Market size, by region, 2016-2026 (USD Million)
5.3 Phenolic Acids
5.3.1 Market size, by region, 2016-2026 (USD Million)
5.4 Alkaloids
5.4.1 Market size, by region, 2016-2026 (USD Million)
5.5 Saponins
5.5.1 Market size, by region, 2016-2026 (USD Million)
5.6 Polysaccharides
5.6.1 Market size, by region, 2016-2026 (USD Million)
5.7 Others
5.7.1 Market size, by region, 2016-2026 (USD Million)
Chapter 6 Plant Based Bioactives Market, By End-Use
6.1 End-Use Outlook
6.2 Functional Foods & Beverage
6.2.1 Market size, by region, 2016-2026 (USD Million)
6.3 Dietary Supplements
6.3.1 Market size, by region, 2016-2026 (USD Million)
6.4 Animal Nutrition
6.4.1 Market size, by region, 2016-2026 (USD Million)
6.5 Personal Care
6.5.1 Market size, by region, 2016-2026 (USD Million)
6.6 Others
6.6.1 Market size, by region, 2016-2026 (USD Million)
Chapter 7 Plant Based Bioactives Market, By Region
7.1 Regional outlook
7.2 North America
7.2.1 Market size, by country 2016-2026 (USD Million)
7.2.2 Market size, by source, 2016-2026 (USD Million)
7.2.3 Market size, by application, 2016-2026 (USD Million)
7.2.4 Market size, by end-use, 2016-2026 (USD Million)
7.2.5 U.S.
7.2.5.1 Market size, by source, 2016-2026 (USD Million)
7.2.5.2 Market size, by application, 2016-2026 (USD Million)
7.2.5.3 Market size, by end-use, 2016-2026 (USD Million)
7.2.6 Canada
7.2.6.1 Market size, by source, 2016-2026 (USD Million)
7.2.6.2 Market size, by application, 2016-2026 (USD Million)
7.2.6.3 Market size, by end-use, 2016-2026 (USD Million)
7.3 Europe
7.3.1 Market size, by country 2016-2026 (USD Million)
7.3.2 Market size, by source, 2016-2026 (USD Million)
7.3.3 Market size, by application, 2016-2026 (USD Million)
7.3.4 Market size, by end-use, 2016-2026 (USD Million)
7.3.5 Germany
7.2.5.1 Market size, by source, 2016-2026 (USD Million)
7.2.5.2 Market size, by application, 2016-2026 (USD Million)
7.2.5.3 Market size, by end-use, 2016-2026 (USD Million)
7.3.6 UK
7.3.6.1 Market size, by source, 2016-2026 (USD Million)
7.3.6.2 Market size, by application, 2016-2026 (USD Million)
7.3.6.3 Market size, by end-use, 2016-2026 (USD Million)
7.3.7 France
7.3.7.1 Market size, by source, 2016-2026 (USD Million)
7.3.7.2 Market size, by application, 2016-2026 (USD Million)
7.3.7.3 Market size, by end-use, 2016-2026 (USD Million)
7.3.8 Italy
7.3.8.1 Market size, by source, 2016-2026 (USD Million)
7.3.8.2 Market size, by application, 2016-2026 (USD Million)
7.3.8.3 Market size, by end-use, 2016-2026 (USD Million)
7.3.9 Spain
7.3.9.1 Market size, by source, 2016-2026 (USD Million)
7.3.9.2 Market size, by application, 2016-2026 (USD Million)
7.3.9.3 Market size, by end-use, 2016-2026 (USD Million)
7.3.10 Russia
7.3.10.1 Market size, by source, 2016-2026 (USD Million)
7.3.10.2 Market size, by application, 2016-2026 (USD Million)
7.3.10.3 Market size, by end-use, 2016-2026 (USD Million)
7.4 Asia Pacific
7.4.1 Market size, by country 2016-2026 (USD Million)
7.4.2 Market size, by source, 2016-2026 (USD Million)
7.4.3 Market size, by application, 2016-2026 (USD Million)
7.4.4 Market size, by end-use, 2016-2026 (USD Million)
7.4.5 China
7.4.5.1 Market size, by source, 2016-2026 (USD Million)
7.4.5.2 Market size, by application, 2016-2026 (USD Million)
7.4.5.3 Market size, by end-use, 2016-2026 (USD Million)
7.4.6 India
7.4.6.1 Market size, by source, 2016-2026 (USD Million)
7.4.6.2 Market size, by application, 2016-2026 (USD Million)
7.4.6.3 Market size, by end-use, 2016-2026 (USD Million)
7.4.7 Japan
7.4.7.1 Market size, by source, 2016-2026 (USD Million)
7.4.7.2 Market size, by application, 2016-2026 (USD Million)
7.4.7.3 Market size, by end-use, 2016-2026 (USD Million)
7.4.8 Australia
7.4.8.1 Market size, by source, 2016-2026 (USD Million)
7.4.8.2 Market size, by application, 2016-2026 (USD Million)
7.4.8.3 Market size, by end-use, 2016-2026 (USD Million)
7.4.9 South Korea
7.4.9.1 Market size, by source, 2016-2026 (USD Million)
7.4.9.2 Market size, by application, 2016-2026 (USD Million)
7.4.9.3 Market size, by end-use, 2016-2026 (USD Million)
7.5 Latin America
7.5.1 Market size, by country 2016-2026 (USD Million)
7.5.2 Market size, by source, 2016-2026 (USD Million)
7.5.3 Market size, by application, 2016-2026 (USD Million)
7.5.4 Market size, by end-use, 2016-2026 (USD Million)
7.5.5 Brazil
7.5.5.1 Market size, by source, 2016-2026 (USD Million)
7.5.5.2 Market size, by application, 2016-2026 (USD Million)
7.5.5.3 Market size, by end-use, 2016-2026 (USD Million)
7.5.6 Mexico
7.5.6.1 Market size, by source, 2016-2026 (USD Million)
7.5.6.2 Market size, by application, 2016-2026 (USD Million)
7.5.6.3 Market size, by end-use, 2016-2026 (USD Million)
7.5.7 Argentina
7.5.7.1 Market size, by source, 2016-2026 (USD Million)
7.5.7.2 Market size, by application, 2016-2026 (USD Million)
7.5.7.3 Market size, by end-use, 2016-2026 (USD Million)
7.6 MEA
7.6.1 Market size, by country 2016-2026 (USD Million)
7.6.2 Market size, by source, 2016-2026 (USD Million)
7.6.3 Market size, by application, 2016-2026 (USD Million)
7.6.4 Market size, by end-use, 2016-2026 (USD Million)
7.6.5 Saudi Arabia
7.6.5.1 Market size, by source, 2016-2026 (USD Million)
7.6.5.2 Market size, by application, 2016-2026 (USD Million)
7.6.5.3 Market size, by end-use, 2016-2026 (USD Million)
7.6.6 UAE
7.6.6.1 Market size, by source, 2016-2026 (USD Million)
7.6.6.2 Market size, by application, 2016-2026 (USD Million)
7.6.6.3 Market size, by end-use, 2016-2026 (USD Million)
7.6.7 South Africa
7.6.7.1 Market size, by source, 2016-2026 (USD Million)
7.6.7.2 Market size, by application, 2016-2026 (USD Million)
7.6.7.3 Market size, by end-use, 2016-2026 (USD Million)
Chapter 8 Company Landscape
8.1 Competitive analysis, 2020
8.2 Naturex SA
8.2.1 Company overview
8.2.2 Financial analysis
8.2.3 Strategic positioning
8.2.4 Info graphic analysis
8.3 Indena SpA
8.3.1 Company overview
8.3.2 Financial analysis
8.3.3 Strategic positioning
8.3.4 Info graphic analysis
8.4 Linnea SA
8.4.1 Company overview
8.4.2 Financial analysis
8.4.3 Strategic positioning
8.4.4 Info graphic analysis
8.5 BASF SE
8.5.1 Company overview
8.5.2 Financial analysis
8.5.3 Strategic positioning
8.5.4 Info graphic analysis
8.6 Arboris LLC
8.6.1 Company overview
8.6.2 Financial analysis
8.6.3 Strategic positioning
8.6.4 Info graphic analysis
8.7 Cargill Inc.
8.7.1 Company overview
8.7.2 Financial analysis
8.7.3 Strategic positioning
8.7.4 Info graphic analysis
8.8 Dupont De Nemours & Co ltd
8.8.1 Company overview
8.8.2 Financial analysis
8.8.3 Strategic positioning
8.8.4 Info graphic analysis
8.9 Martin Bauer GmbH &Co. KG
8.9.1 Company overview
8.9.2 Financial analysis
8.9.3 Strategic positioning
8.9.4 Info graphic analysis
8.10 Hansen A/S
8.10.1 Company overview
8.10.2 Financial analysis
8.10.3 Strategic positioning
8.10.4 Info graphic analysis
8.11 LIPO Foods
8.11.1 Company overview
8.11.2 Financial analysis
8.11.3 Strategic positioning
8.11.4 Info graphic analysis
8.12 Doehler Group
8.12.1 Company overview
8.12.2 Financial analysis
8.12.3 Strategic positioning
8.12.4 Info graphic analysis
8.13 Archer Daniels Midland Co. (ADM)
8.13.1 Company overview
8.13.2 Financial analysis
8.13.3 Strategic positioning
8.13.4 Info graphic analysis
8.14 DSM
8.14.1 Company overview
8.14.2 Financial analysis
8.14.3 Strategic positioning
8.14.4 Info graphic analysis
8.15 Ajinomoto Co. Inc.
8.15.1 Company overview
8.15.2 Financial analysis
8.15.3 Strategic positioning
8.15.4 Info graphic analysis
8.16 Ingredion Inc.
8.16.1 Company overview
8.16.2 Financial analysis
8.16.3 Strategic positioning
8.16.4 Info graphic analysis
8.17 Roquette
8.17.1 Company overview
8.17.2 Financial analysis
8.17.3 Strategic positioning
8.17.4 Info graphic analysis
8.18 Arla Foods
8.18.1 Company overview
8.18.2 Financial analysis
8.18.3 Strategic positioning
8.18.4 Info graphic analysis
8.19 Kerry Group
8.19.1 Company overview
8.19.2 Financial analysis
8.19.3 Strategic positioning
8.19.4 Info graphic analysis
8.20 Corbion
8.20.1 Company overview
8.20.2 Financial analysis
8.20.3 Strategic positioning
8.20.4 Info graphic analysis
8.21 Changsha Organic Herb Inc.
8.21.1 Company overview
8.21.2 Financial analysis
8.21.3 Strategic positioning
8.21.4 Info graphic analysis
The Global Plant Based Bioactives Market has been studied from the year 2019 till 2026. However, the CAGR provided in the report is from the year 2021 to 2026. The research methodology involved three stages: Desk research, Primary research, and Analysis & Output from the entire research process.

The desk research involved a robust background study which meant referring to paid and unpaid databases to understand the market dynamics; mapping contracts from press releases; identifying the key players in the market, studying their product portfolio, competition level, annual reports/SEC filings & investor presentations; and learning the demand and supply-side analysis for the Plant Based Bioactives Market.

The primary research activity included telephonic conversations with more than 50 tier 1 industry consultants, distributors, and end-use product manufacturers.

Finally, based on the above thorough research process, an in-depth analysis was carried out considering the following aspects: market attractiveness, current & future market trends, market share analysis, SWOT analysis of the company and customer analytics.

This FREE sample includes market data points, ranging from trend analyses to market estimates & forecasts. See for yourself.
Or view our licence options:
Tailor made solutions just for you
80% of our clients seek made-to-order reports. How do you want us to tailor yours?
OUR CLIENTS


