This report was recently updated on August 24 2025 with the latest and most recent
market numbers
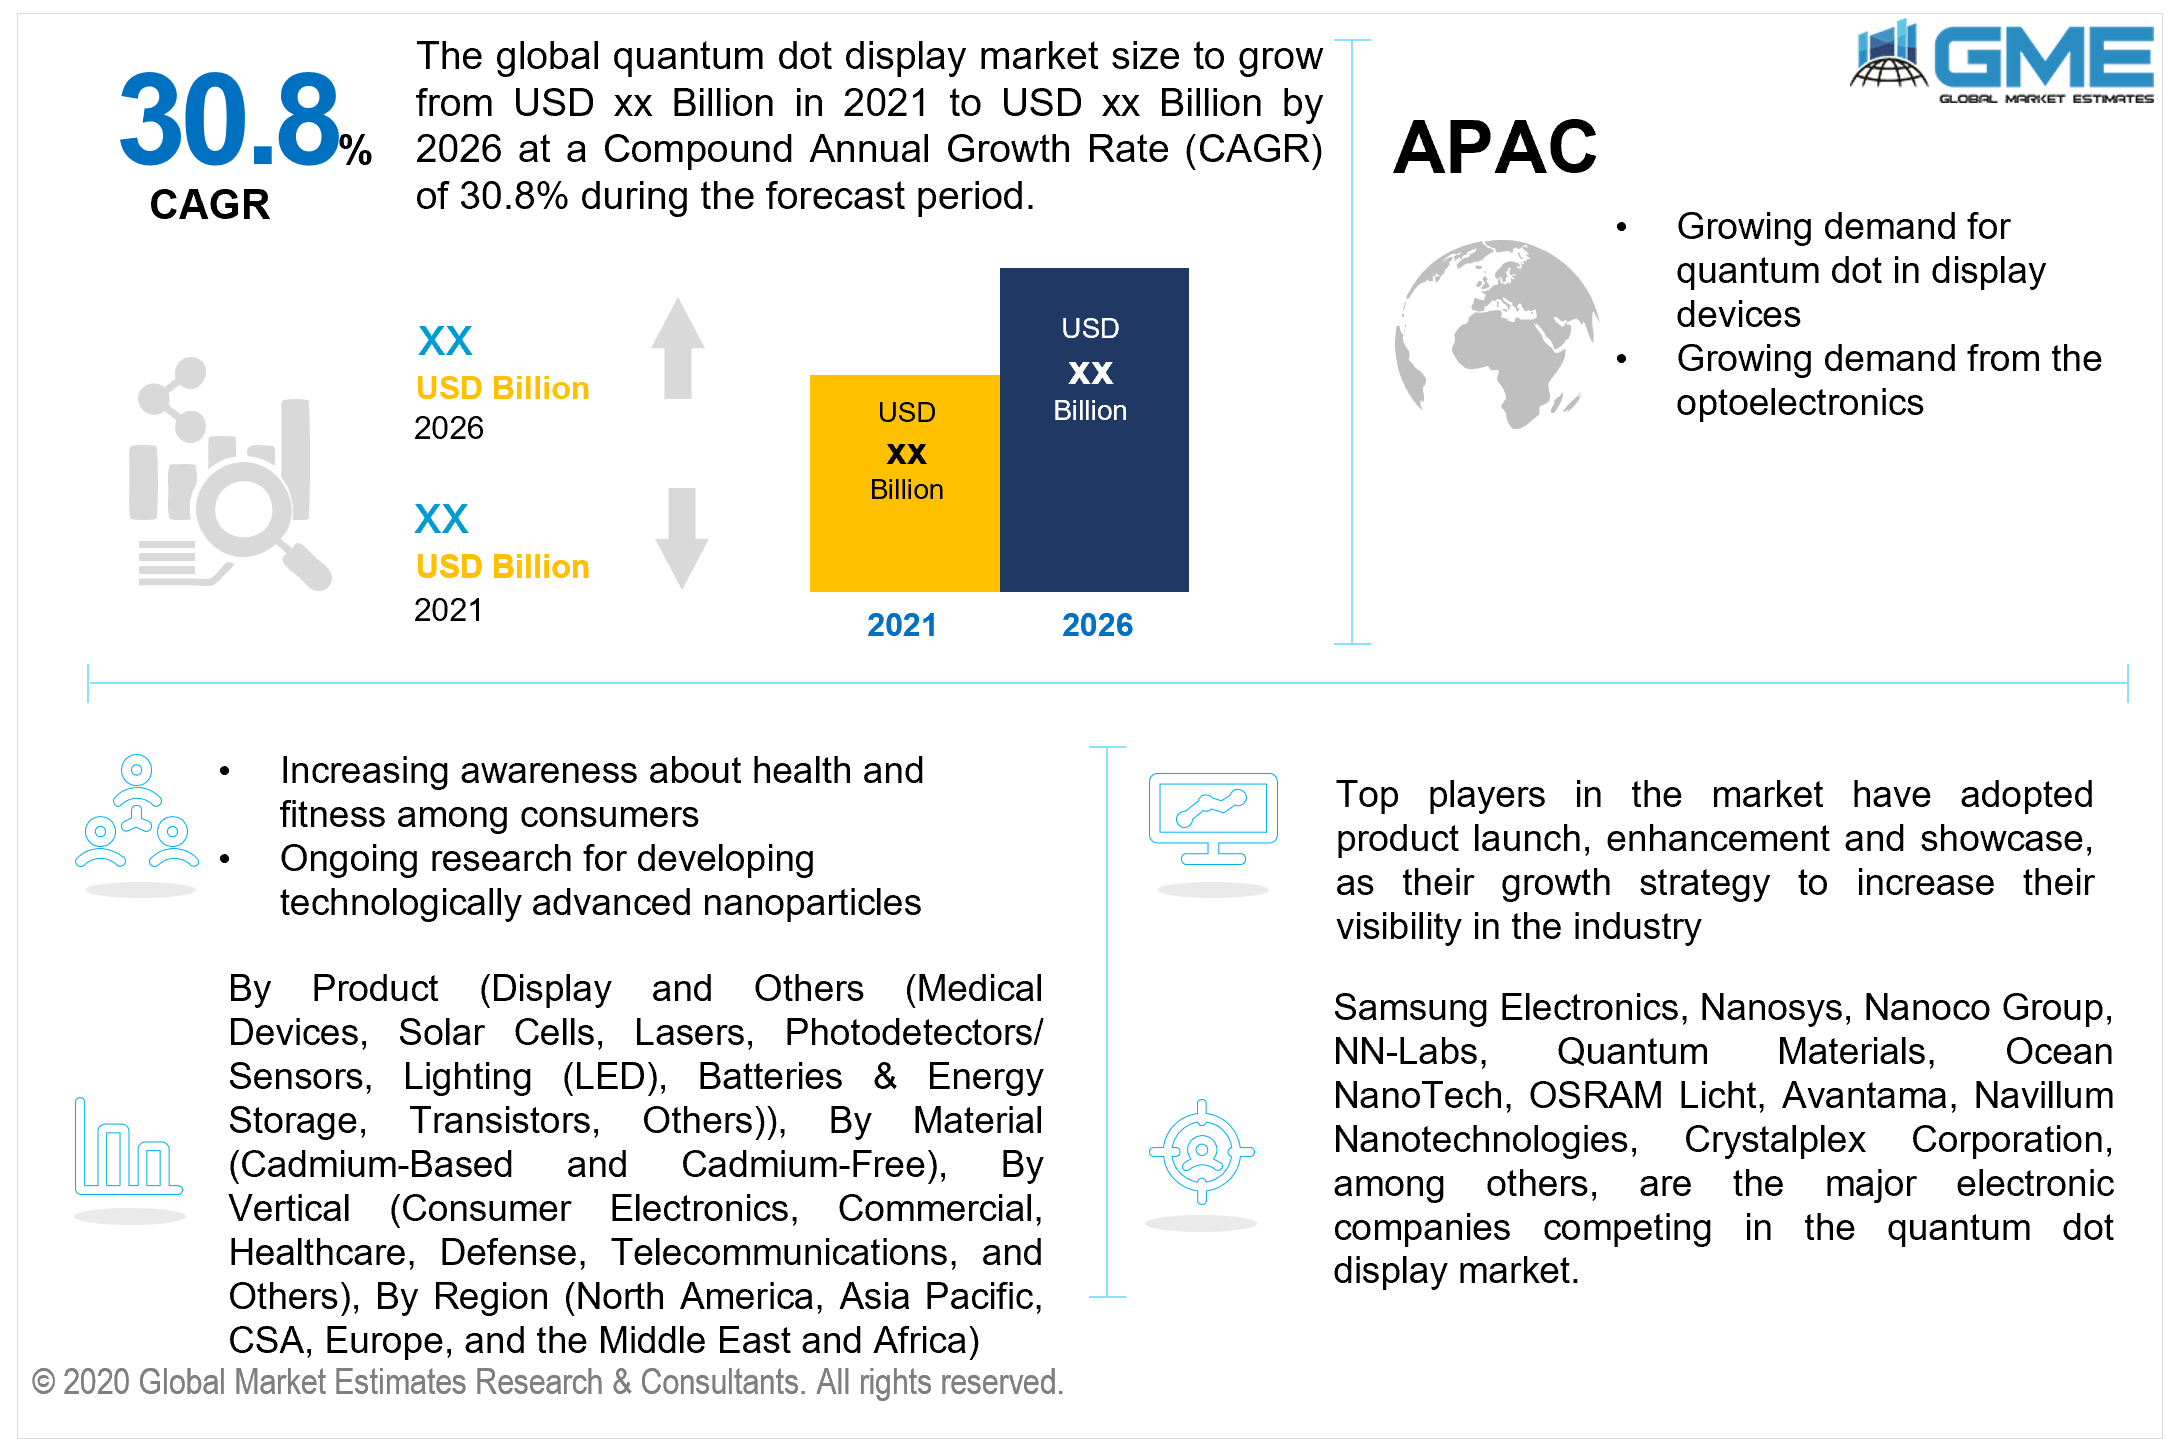
Global Quantum Dot Display Market Size, Trends, and Analysis - Forecasts To 2026 By Product (Display and Others (Medical Devices, Solar Cells, Lasers, Photodetectors/ Sensors, Lighting (LED), Batteries & Energy Storage, Transistors, Others)), By Material (Cadmium-Based and Cadmium-Free), By Vertical (Consumer Electronics, Commercial, Healthcare, Defense, Telecommunications, and Others), By Region (North America, Asia Pacific, CSA, Europe, and the Middle East and Africa); End-User Landscape, Company Market Share Analysis & Competitor Analysis
Some of the main factors driving the growth of the quantum dots display market entail a spike in the deployment of energy-efficient alternatives, a boost in demand for augmented display technologies, a spike in the popularity of consumer electronics devices, an expansion in investments in the healthcare industry, and an improvement in people's lifestyles. Factors like the shift in trend for the adoption of renewable technologies, rising technological advancements, increasing disposable income, growing interest in cadmium-free quantum dots, high demand for quantum dots in display devices, and novel product developments are leading to advancement in demand for quantum dot display.
Moreover, growing demand for smart electronic devices, increasing investments, the boom in the construction industry, rising adoption of a quantum dot in LED lighting, rising funding for research, increasing awareness regarding conserving energy, improved lifestyle of people, increasing government initiatives, rapid urbanization, increased investment for research & development of electronic devices, rise in awareness level regarding advanced display technologies, growing knowledge about energy competent solutions is leading to higher adoption of quantum dot display. However, some factors restrict or hinder the growth of the market which includes unexpected changes in social, political, and economic circumstances, the declining volume of shipments, lack of knowledge, use of toxic material, development of alternative technologies, high investment cost, lack of awareness in developing countries, lack of raw material, high competition restricted reimbursements, lack of training, and high import duty.
Product feature like cost-effectiveness, color efficacy, longer lifespan of the product, low impact on the environment, enhanced resolution quality, lower price & maintenance, better brightness, effective alternative to biological imaging, minimal re-engineering of LCD panels, low turn-on voltage, and high resolution RGB array pattering is presumed to increase demand for the quantum dot display market. As top-tier manufacturers are struggling to identify any other differentiating element in LCD panels, the sector contains significant development prospects. They want to take advantage of QLED TVs ahead of the competition by creating and releasing quantum dot display technologies.
As per the product, the market is categorized as display and others. Others include medical devices, solar cells, lasers, photodetectors/ sensors, lighting (led), batteries & energy storage, transistors, and others. The category of the display is foreseen to be the largest shareholder over the forecast period. With several benefits, quantum dot displays are regarded as the next-generation display technology. Flat-panel TV displays, digital cameras, cellphones, gaming systems, and personal digital assistant (PDA) gadgets are among the emerging applications that use quantum dots. LEDs with quantum dot luminophores appear promise in the creation of next-generation displays, and as a result, display devices account for a significant portion of the quantum dot market.
According to the material analysis, the two segments are cadmium-based, cadmium-free. The cadmium-free is foreseen to be the market leader due to characteristics like the low-priced, highly accurate, reduced risks concerning toxicity, enhanced productivity, superior safety, and sustainability, reduced electricity consumption, and low maintenance cost. Cadmium-free quantum dots are a secure and more ecological solution for producers and consumers, providing the color benefits of the technology without the dangers of toxicity or significant regulatory limits. Cadmium-free quantum dots have the capability not just for displays, but also for a wide range of other applications such as lighting, photovoltaic panels, and biomedicine.
According to the vertical analysis, the six segments are consumer electronics, commercial, healthcare, defense, telecommunications, others. The consumer electronics segment is predicted to be the largest shareholder in terms of revenue growth in the market. Because of their minimal power consumption excellent efficiency, and great quality, quantum dots are rapidly being employed in consumer electronics. Quantum dots are used in a variety of consumer gadgets, including smartwatches, LCD & LED televisions, image mapping, high-vision cameras, and wearable devices. Numerous consumer electronics corporations have begun to incorporate quantum dot technologies into their products since this technology has the potential to significantly enhance display performance in terms of the color spectrum, color accuracy, and battery consumption. Furthermore, the distinctive properties of quantum dots, including high brightness, pure color, and wavelength tenability, allow display developers to create a spectrum of light to enhance both the efficiency and color quality of any display, resulting in an astonishing new customer experience. As a consequence, throughout the forecast period, the consumer vertical is likely to occupy a significant part of the quantum dot market.
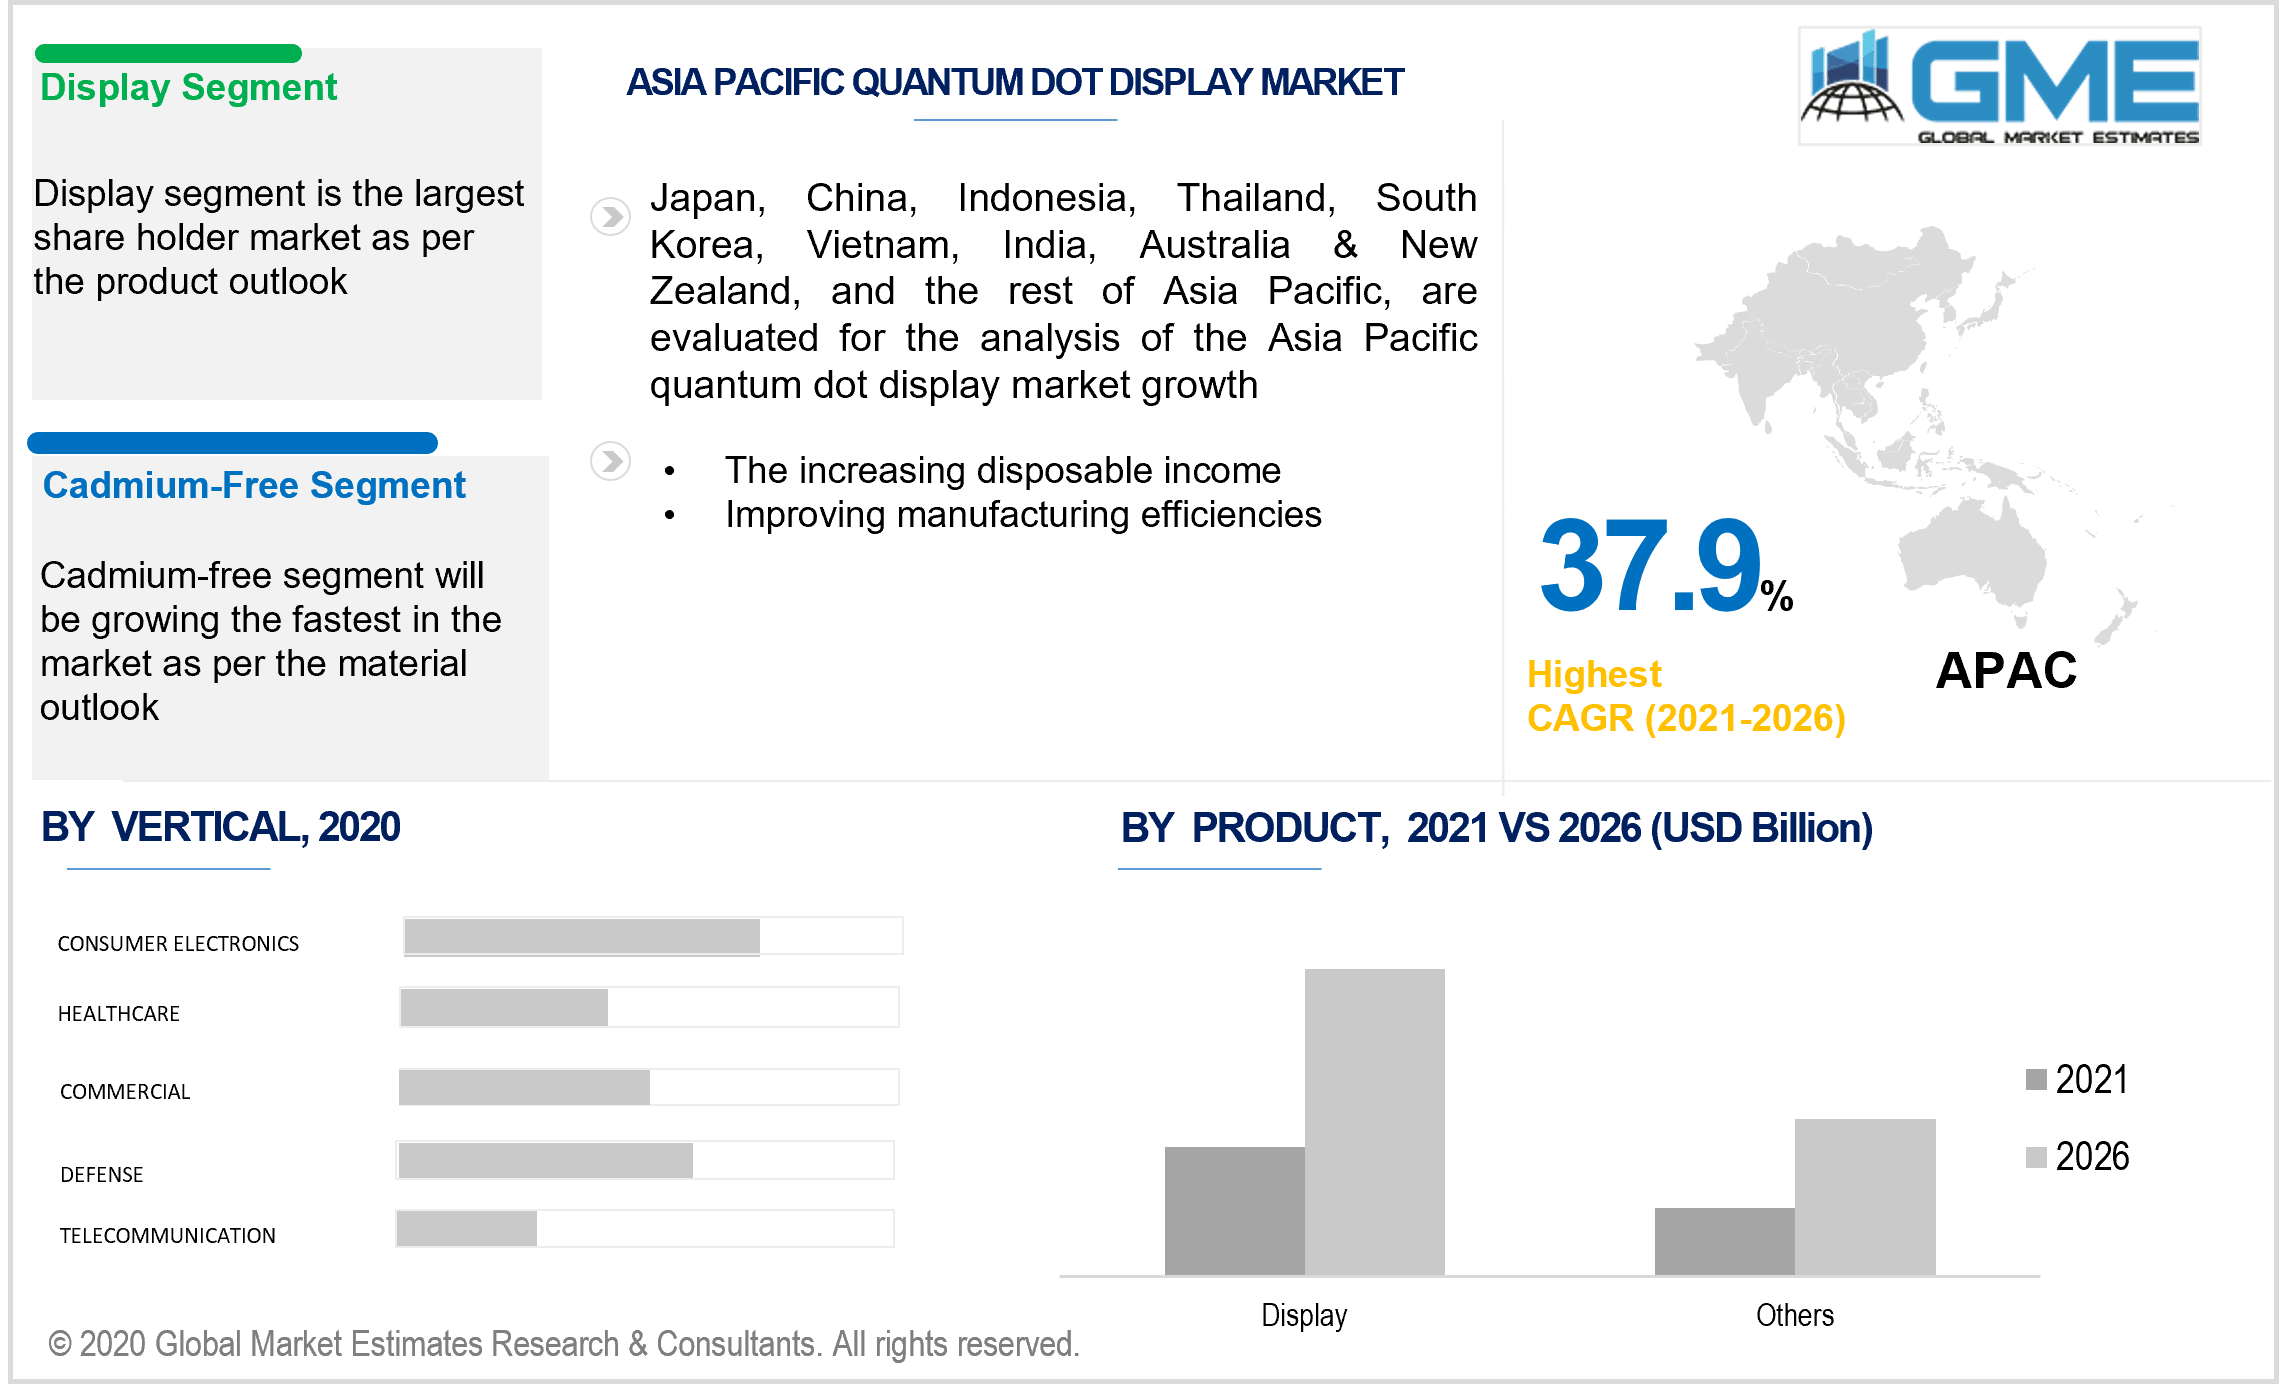
As per the geographical analysis, the market of quantum dot display can be classified into North America (the US, Canada, and Mexico), Asia Pacific (India, China, Japan, Malaysia, Singapore, and the Rest of Asia Pacific), Europe (Germany, United Kingdom, Italy, France, Spain, Netherlands, and Rest of Europe), Middle East & Africa and Central & South America. The market for North America is foreseen to be dominant. Because of the early adoption of QD technology, some nations are projected to integrate significant demand and necessity for QLEDs. Increased population consciousness of health and fitness is expected to increase the regional demand for QDs in bio-imaging and medicinal applications. The United States is expected to draw significant corporate investment and high-quality research activity for the development of technically superior nano-particles and their implementation into display systems. The worldwide quantum dot (QD) display market in the Asia Pacific region is expected to develop significantly in the future years due to increased demand and recognition from the optoelectronics sector division in the area. The presence of a large volume of electronic display suppliers in areas such as Japan and China has had a positive influence on the growth of the regional market. Taiwan, China, and Korea are presumed to include high-quality networks and inexpensive labor costs, which are likely to provide significant expansion chances and possibilities for various multinationals to invest and establish quantum dot display companies focused on research & development projects.
Samsung Electronics, Nanosys, Nanoco Group, NN-Labs, Quantum Materials, Ocean NanoTech, OSRAM Licht, Avantama, Navillum Nanotechnologies, Crystalplex Corporation, among others, are the major electronic companies competing in the quantum dot display market.
Please note: This is not an exhaustive list of companies profiled in the report.
Chapter 1 Methodology
1.1 Market Scope & Definitions
1.2 Estimates & Forecast Calculation
1.3 Historical Data Overview And Validation
1.4 Data Sources
1.4.1 Secondary
1.4.2 Primary
Chapter 2 Report Outlook
2.1 Global Quantum Dot Display Industry Overview, 2019-2026
2.1.1 Industry Overview
2.1.2 Product Overview
2.1.3 Material Overview
2.1.4 Vertical Overview
2.1.5 Regional Overview
Chapter 3 Global Quantum Dot Display Market Trends
3.1 Market Segmentation
3.2 Industry Background, 2019-2026
3.3 Market Key Trends
3.3.1 Positive Trends
3.3.1.1 The minimal re-engineering of LCD panels
3.3.1.2 The low impact on the environment
3.3.2 Industry Challenges
3.3.2.1 High Investment Cost
3.4 Prospective Growth Scenario
3.4.1 Product Growth Scenario
3.4.2 Material Growth Scenario
3.4.3 Vertical Growth Scenario
3.5 COVID-19 Influence over Industry Growth
3.6 Porter’s Analysis
3.7 PESTEL Analysis
3.8 Value Chain & Supply Chain Analysis
3.9 Regulatory Framework
3.9.1 North America
3.9.2 Europe
3.9.3 APAC
3.9.4 LATAM
3.9.5 MEA
3.10 Technology Overview
3.11 Market Share Analysis, 2020
3.11.1 Company Positioning Overview, 2020
Chapter 4 Global Quantum Dot Display Market, By Product
4.1 Product Outlook
4.2 Display
4.2.1 Market Size, By Region, 2019-2026 (USD Million)
4.3 Others
4.3.1 Market Size, By Region, 2019-2026 (USD Million)
Chapter 5 Global Quantum Dot Display Market, By Material
5.1 Material Outlook
5.2 Cadmium-Based
5.2.1 Market Size, By Region, 2019-2026 (USD Million)
5.3 Cadmium-Free
5.3.1 Market Size, By Region, 2019-2026 (USD Million)
Chapter 6 Global Quantum Dot Display Market, By Vertical
6.1 Vertical Outlook
6.2 Consumer Electronics
6.2.1 Market Size, By Region, 2019-2026 (USD Million)
6.3 Commercial
6.3.1 Market Size, By Region, 2019-2026 (USD Million)
6.4 Healthcare
6.4.1 Market Size, By Region, 2019-2026 (USD Million)
6.5 Defence
6.5.1 Market Size, By Region, 2019-2026 (USD Million)
6.6 Telecommunications
6.6.1 Market Size, By Region, 2019-2026 (USD Million)
Chapter 7 Global Quantum Dot Display Market, By Region
7.1 Regional outlook
7.2 North America
7.2.1 Market Size, By Country 2019-2026 (USD Million)
7.2.2 Market Size, By Product, 2019-2026 (USD Million)
7.2.3 Market Size, By Material, 2019-2026 (USD Million)
7.2.4 Market Size, By Vertical, 2019-2026 (USD Million)
7.2.5 U.S.
7.2.5.1 Market Size, By Product, 2019-2026 (USD Million)
7.2.5.2 Market Size, By Material, 2019-2026 (USD Million)
7.2.5.3 Market Size, By Vertical, 2019-2026 (USD Million)
7.2.6 Canada
7.2.6.1 Market Size, By Product, 2019-2026 (USD Million)
7.2.6.2 Market Size, By Material, 2019-2026 (USD Million)
7.2.6.3 Market Size, By Vertical, 2019-2026 (USD Million)
7.3 Europe
7.3.1 Market Size, By Country 2019-2026 (USD Million)
7.3.2 Market Size, By Product, 2019-2026 (USD Million)
7.3.3 Market Size, By Material, 2019-2026 (USD Million)
7.3.4 Market Size, By Vertical, 2019-2026 (USD Million)
7.3.5 Germany
7.3.5.1 Market Size, By Product, 2019-2026 (USD Million)
7.3.5.2 Market Size, By Material, 2019-2026 (USD Million)
7.3.5.3 Market Size, By Vertical, 2019-2026 (USD Million)
7.3.6 UK
7.3.6.1 Market Size, By Product, 2019-2026 (USD Million)
7.3.6.2 Market Size, By Material, 2019-2026 (USD Million)
7.3.6.3 Market Size, By Vertical, 2019-2026 (USD Million)
7.3.7 France
7.3.7.1 Market Size, By Product, 2019-2026 (USD Million)
7.3.7.2 Market Size, By Material, 2019-2026 (USD Million)
7.3.7.3 Market Size, By Vertical, 2019-2026 (USD Million)
7.3.8 Italy
7.3.8.1 Market Size, By Product, 2019-2026 (USD Million)
7.3.8.2 Market Size, By Material, 2019-2026 (USD Million)
7.3.8.3 Market Size, By Vertical, 2019-2026 (USD Million)
7.3.9 Spain
7.3.9.1 Market Size, By Product, 2019-2026 (USD Million)
7.3.9.2 Market Size, By Material, 2019-2026 (USD Million)
7.3.9.3 Market Size, By Vertical, 2019-2026 (USD Million)
7.3.10 Russia
7.3.10.1 Market Size, By Product, 2019-2026 (USD Million)
7.3.10.2 Market Size, By Material, 2019-2026 (USD Million)
7.3.10.3 Market Size, By Vertical, 2019-2026 (USD Million)
7.4 Asia Pacific
7.4.1 Market Size, By Country,2019-2026 (USD Million)
7.4.2 Market Size, By Product, 2019-2026 (USD Million)
7.4.3 Market Size, By Material, 2019-2026 (USD Million)
7.4.4 Market Size, By Vertical, 2019-2026 (USD Million)
7.4.5 China
7.4.5.1 Market Size, By Product, 2019-2026 (USD Million)
7.4.5.2 Market Size, By Material, 2019-2026 (USD Million)
7.4.5.3 Market Size, By Vertical, 2019-2026 (USD Million)
7.4.6 India
7.4.6.1 Market Size, By Product, 2019-2026 (USD Million)
7.4.6.2 Market Size, By Material, 2019-2026 (USD Million)
7.4.6.3 Market Size, By Vertical, 2019-2026 (USD Million)
7.4.7 Japan
7.4.7.1 Market Size, By Product, 2019-2026 (USD Million)
7.4.7.2 Market Size, By Material, 2019-2026 (USD Million)
7.4.7.3 Market Size, By Vertical, 2019-2026 (USD Million)
7.4.8 Australia
7.4.8.1 Market Size, By Product, 2019-2026 (USD Million)
7.4.8.2 Market size, By Material, 2019-2026 (USD Million)
7.4.8.3 Market Size, By Vertical, 2019-2026 (USD Million)
7.4.9 South Korea
7.4.9.1 Market Size, By Product, 2019-2026 (USD Million)
7.4.9.2 Market Size, By Material, 2019-2026 (USD Million)
7.4.9.3 Market Size, By Vertical, 2019-2026 (USD Million)
7.5 Latin America
7.5.1 Market Size, By Country 2019-2026 (USD Million)
7.5.2 Market Size, By Product, 2019-2026 (USD Million)
7.5.3 Market Size, By Material, 2019-2026 (USD Million)
7.5.4 Market Size, By Vertical, 2019-2026 (USD Million)
7.5.5 Brazil
7.5.5.1 Market Size, By Product, 2019-2026 (USD Million)
7.5.5.2 Market Size, By Material, 2019-2026 (USD Million)
7.5.5.3 Market Size, By Vertical, 2019-2026 (USD Million)
7.5.6 Mexico
7.5.6.1 Market Size, By Product, 2019-2026 (USD Million)
7.5.6.2 Market Size, By Material, 2019-2026 (USD Million)
7.5.6.3 Market Size, By Vertical, 2019-2026 (USD Million)
7.5.7 Argentina
7.5.7.1 Market Size, By Product, 2019-2026 (USD Million)
7.5.7.2 Market Size, By Material, 2019-2026 (USD Million)
7.5.7.3 Market Size, By Vertical, 2019-2026 (USD Million)
7.6 MEA
7.6.1 Market Size, By Country 2019-2026 (USD Million)
7.6.2 Market Size, By Product, 2019-2026 (USD Million)
7.6.3 Market Size, By Material, 2019-2026 (USD Million)
7.6.4 Market Size, By Vertical, 2019-2026 (USD Million)
7.6.5 Saudi Arabia
7.6.5.1 Market Size, By Product, 2019-2026 (USD Million)
7.6.5.2 Market Size, By Material, 2019-2026 (USD Million)
7.6.5.3 Market Size, By Vertical, 2019-2026 (USD Million)
7.6.6 UAE
7.6.6.1 Market Size, By Product, 2019-2026 (USD Million)
7.6.6.2 Market Size, By Material, 2019-2026 (USD Million)
7.6.6.3 Market Size, By Vertical, 2019-2026 (USD Million)
7.6.7 South Africa
7.6.7.1 Market Size, By Product, 2019-2026 (USD Million)
7.6.7.2 Market Size, By Material, 2019-2026 (USD Million)
7.6.7.3 Market Size, By Vertical, 2019-2026 (USD Million)
Chapter 8 Company Landscape
8.1 Competitive Analysis, 2020
8.2 Samsung Electronics
8.2.1 Company Overview
8.2.2 Financial Analysis
8.2.3 Strategic Positioning
8.3 Nanosys
8.3.1 Company Overview
8.3.2 Financial Analysis
8.3.3 Strategic Positioning
8.3.4 Info Graphic Analysis
8.4 Nanoco Group
8.4.1 Company Overview
8.4.2 Financial Analysis
8.4.3 Strategic Positioning
8.4.4 Info Graphic Analysis
8.5 NN-Labs
8.5.1 Company Overview
8.5.2 Financial Analysis
8.5.3 Strategic Positioning
8.5.4 Info Graphic Analysis
8.6 Quantum Materials
8.6.1 Company Overview
8.6.2 Financial Analysis
8.6.3 Strategic Positioning
8.6.4 Info Graphic Analysis
8.7 Ocean NanoTech
8.7.1 Company Overview
8.7.2 Financial Analysis
8.7.3 Strategic Positioning
8.7.4 Info Graphic Analysis
8.8 OSRAM Licht
8.8.1 Company Overview
8.8.2 Financial Analysis
8.8.3 Strategic Positioning
8.8.4 Info Graphic Analysis
8.9 Avantama
8.9.1 Company Overview
8.9.2 Financial Analysis
8.9.3 Strategic Positioning
8.9.4 Info Graphic Analysis
8.10 Navillum Nanotechnologies
8.10.1 Company Overview
8.10.2 Financial Analysis
8.10.3 Strategic Positioning
8.10.4 Info Graphic Analysis
8.11 Crystalplex Corporation
8.11.1 Company Overview
8.11.2 Financial Analysis
8.11.3 Strategic Positioning
8.11.4 Info Graphic Analysis
8.12 Other Companies
8.12.1 Company Overview
8.12.2 Financial Analysis
8.12.3 Strategic Positioning
8.12.4 Info Graphic Analysis
The Global Quantum Dot Display Market has been studied from the year 2019 till 2026. However, the CAGR provided in the report is from the year 2021 to 2026. The research methodology involved three stages: Desk research, Primary research, and Analysis & Output from the entire research process.

The desk research involved a robust background study which meant referring to paid and unpaid databases to understand the market dynamics; mapping contracts from press releases; identifying the key players in the market, studying their product portfolio, competition level, annual reports/SEC filings & investor presentations; and learning the demand and supply-side analysis for the Quantum Dot Display Market.

The primary research activity included telephonic conversations with more than 50 tier 1 industry consultants, distributors, and end-use product manufacturers.

Finally, based on the above thorough research process, an in-depth analysis was carried out considering the following aspects: market attractiveness, current & future market trends, market share analysis, SWOT analysis of the company and customer analytics.

Frequently Asked Questions

This FREE sample includes market data points, ranging from trend analyses to market estimates & forecasts. See for yourself.
Or view our licence options:
Tailor made solutions just for you
80% of our clients seek made-to-order reports. How do you want us to tailor yours?
OUR CLIENTS


