This report was recently updated on August 20 2025 with the latest and most recent
market numbers
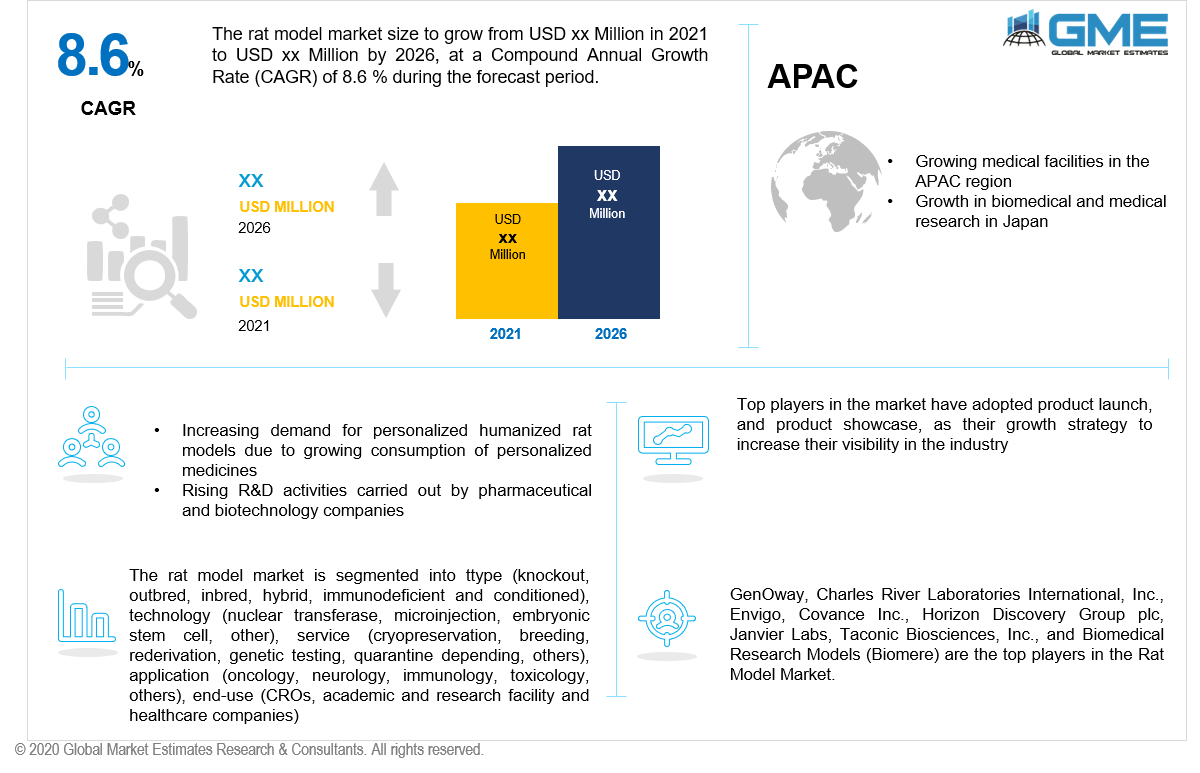
Global Rat Model Market Size, Trends & Analysis - Forecasts to 2026 By Type (Knockout, Outbred, Inbred, Hybrid, Immunodeficient and Conditioned), By Technology (Nuclear transferase, Microinjection, Embryonic stem cell, Other), By Service (Cryopreservation, Breeding, Rederivation, Genetic testing, Quarantine depending, Others), By Application (Oncology, Neurology, Immunology, Toxicology, Others), By End-Use (CROs, Academic and research facility and Healthcare companies), By Region (North America, Asia Pacific, CSA, Europe, and the Middle East and Africa); End-User Landscape, Company Market Share Analysis & Competitor Analysis
Rats are an important research tool for both fundamental and practical research in the area of biomedical sciences, and they are rapidly evolving. Rats are at the top of the list as a paradigm for translating processes behind human illness progression, owing to the increased collection of gene technologies, genome sequencing, and biological preservation. The rat model has numerous benefits over the mouse and other comparable creatures as a model of human illness. The rat is a good model for heart disease, particularly stroke and hypertension. The physiology of the rat model is easier to identify, and a body of data has accumulated over time, which will take many years to recreate in the mouse. Furthermore, in many situations, physiology is more like that of a human being. The use of embryonic stem cell (ESC) technology in combination with insertional and chemical mutagenesis has expanded the range of rat models that may be used.
The rat is an excellent model for heart disease, particularly stroke and hypertension. The physiology of the rat model is easier to track, and a body of data has accumulated over time that will take years to recreate in the mouse. Furthermore, in many situations, physiology is more similar to that of a human being. The use of embryonic stem cell (ESC) technology in combination with insertional and chemical mutagenesis has expanded the range of rat models that can be used.
The expanding use of the mouse model not only in fundamental research but also in the applied sector of drug development and discovery is a major driver driving the global rat model market forward. The creation of new therapeutic techniques for the treatment of various human illnesses, target discovery and verification, drug screening and lead optimization, and toxicity and safety screening are all examples of rat model uses in pharmaceutical research, which is driving up demand for rat models. Advancement in technology increased R&D activities will also fuel the market to rise during the predicted years.
Based on the type, the rat model market can be segmented as knockout, outbred, inbred, hybrid, immunodeficient, and conditioned. For research purposes, ranges of rat models are available, including immunodeficient, genetically engineered, or inculcated rats. Attributed to the prevalence of genetic diversity among the strain that may be seen for at least four generations, the outbred type will have the majority of the share. Such models enable in-depth study and aid in the prediction of individual animal sensitivities to the same treatment.
This sort of model is typically provided by corporate breeding businesses and is not created in-house by pharmaceutical companies, resulting in the bulk of the shares being held by the latter. There are some sorts of models, however, that are gaining prominence over outbreeding models. Knockout, hybrid, and conditioned rats are among them.
Based on the technology, the rat model market is divided into nuclear transferase, microinjection, and embryonic stem cell, among others. CRISPR technology (Other Technologies) is being more widely used in rat-based studies as the need for trained and genetically modified animals grows. This technology type will be dominating the market during the predicted timeframe. Additional methods like vector-mediated gene transfer, biolistic, and Zinc Finger Nuclease are included in the other portion.
Based on the service, the rat model market is classified as cryopreservation, breeding, rederivation, genetic testing, and quarantine depending, among others. Breeding is the most popular and biggest service, accounting for nearly a quarter of the total income. During the foreseeable period, breeding is expected to be the most popular activity. However, combining several services with breeding, including a quarantine facility, is projected to help other areas flourish.
Based on the application, the rat model market is segmented into oncology, neurology, immunology, and toxicology, among others. Over the projection period, the existence of different Contract Research Organizations (CROs) providing toxicity testing and safety assessment services is likely to boost the market, making it the biggest sector
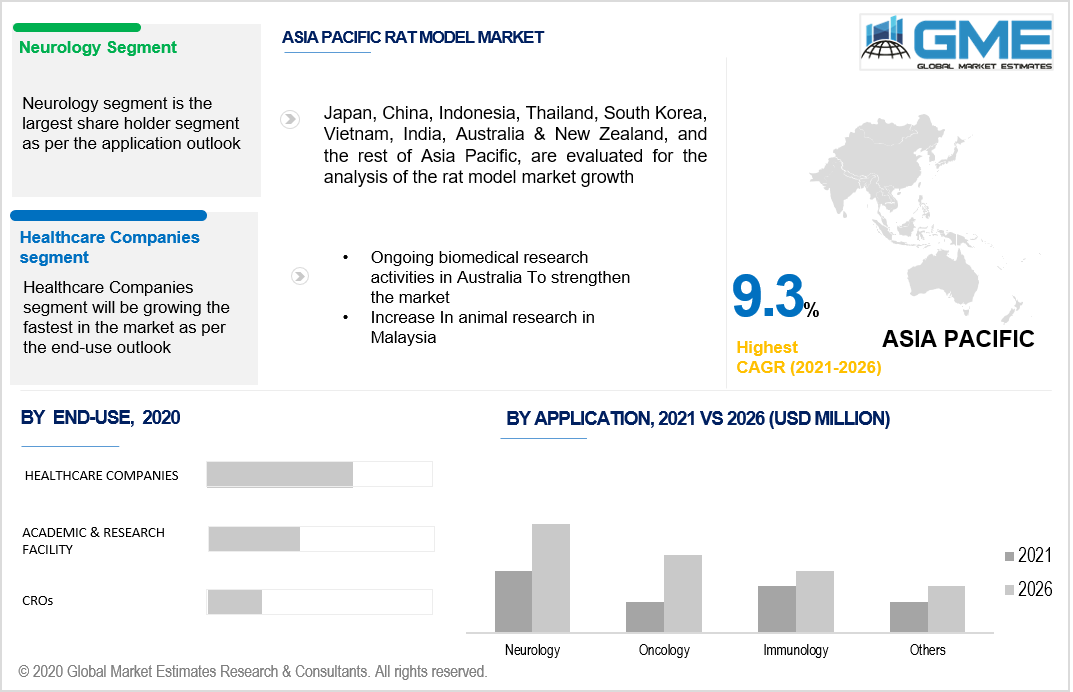
The increased frequency of disorders like Alzheimer's, stroke, and Parkinson's disease is predicted to make neurological disorders a profitable market for pharmaceutical companies. This segment will be dominating the market during the predicted years.
Based on the end-use, the rat model market is segmented into CROs, academic and research facility and healthcare companies. The majority of the market is expected to be held by healthcare firms. The rise of CROs is likely to be aided by the expanding number of new CROs and the growing frequency of outsourcing research operations. As a result, this category is expected to increase at the quickest rate over the projection period.
As per the geographical analysis, the market can be classified into North America (the US, Canada, and Mexico), Asia Pacific (India, China, Japan, Malaysia, Singapore, and Rest of Asia Pacific), Europe (Germany, United Kingdom, Italy, France, Spain, Netherlands, and Rest of Europe), Middle East & Africa and Central & South America. North America will dominate the rat model market. The region's supremacy is attributed in large part to the region's substantial research operations for the creation of pharmaceuticals and biologics, as well as the presence of significant pharmaceutical and biotechnology businesses. In the worldwide rat model market, Europe held the second-largest proportion. Germany was Europe's most powerful nation.
During the projection period, the APAC region is predicted to be the fastest expanding market for the rat model. This rapid expansion is partly owing to an increase in the number of universities and contract research organizations in Japan, China, Australia, and India, all of which present significant prospects for rat model manufacturers. Because of increased investments in biomedical research, greater awareness, and a flexible regulatory environment, the market in Latin America and the Rest of the World is expected to develop significantly.
GenOway, Charles River Laboratories International, Inc., Envigo, Covance Inc., Horizon Discovery Group plc, Janvier Labs, Taconic Biosciences, Inc., and Biomedical Research Models (Biomere) are the top players in the Rat Model Market.
Please note: This is not an exhaustive list of companies profiled in the report.
Chapter 1 Methodology
1.1 Market Scope & Definitions
1.2 Estimates & Forecast Calculation
1.3 Historical Data Overview and Validation
1.4 Data Sources
1.4.1 Secondary
1.4.2 Primary
Chapter 2 Report Outlook
2.1 Global Rat Model Industry Overview, 2016-2026
2.1.1 Type Overview
2.1.2 Technology Overview
2.1.3 Service Overview
2.1.4 Application Overview
2.1.5 End-Use Overview
2.1.6 Regional Overview
Chapter 3 Global Rat Model Market Trends
3.1 Market Segmentation
3.2 Industry Background, 2016-2026
3.3 Market Key Trends
3.3.1 Positive Trends
3.3.1.1 Increasing demand for personalized humanized rat models due to growing consumption of personalized medicines
3.3.1.2 Rising R&D activities carried out by pharmaceutical and biotechnology companies
3.3.2 Industry Challenges
3.3.2.1 Development of methods alternative to animal testing
3.4 Prospective Growth Scenario
3.4.1 Technology Growth Scenario
3.4.2 Type Growth Scenario
3.5 COVID-19 Influence over Industry Growth
3.6 Porter’s Analysis
3.7 PESTEL Analysis
3.8 Value Chain & Supply Chain Analysis
3.9 Regulatory Framework
3.9.1 North America
3.9.2 Europe
3.9.3 APAC
3.9.4 LATAM
3.9.5 MEA
3.10 Technology Overview
3.11 Market Share Analysis, 2020
3.11.1 Company Positioning Overview, 2020
Chapter 4 Global Rat Model Market, By Type
4.1 Type Outlook
4.2 Knockout
4.2.1 Market Size, By Region, 2016-2026 (USD Million)
4.3 Outbred
4.3.1 Market Size, By Region, 2016-2026 (USD Million)
4.4 Inbred
4.4.1 Market Size, By Region, 2016-2026 (USD Million)
4.5 Immunodeficient
4.5.1 Market Size, By Region, 2016-2026 (USD Million)
4.6 Hybrid
4.6.1 Market Size, By Region, 2016-2026 (USD Million)
4.7 Conditioned
4.7.1 Market Size, By Region, 2016-2026 (USD Million)
Chapter 5 Global Rat Model Market, By Technology
5.1 Technology Outlook
5.2 Nuclear transferase
5.2.1 Market Size, By Region, 2016-2026 (USD Million)
5.3 Microinjection
5.3.1 Market Size, By Region, 2016-2026 (USD Million)
5.4 Embryonic stem cell
5.4.1 Market Size, By Region, 2016-2026 (USD Million)
5.5 Others
5.5.1 Market Size, By Region, 2016-2026 (USD Million)
Chapter 6 Global Rat Model Market, By Service
6.1 Service Outlook
6.2 Cryopreservation
6.2.1 Market Size, By Region, 2016-2026 (USD Million)
6.3 Breeding
6.3.1 Market Size, By Region, 2016-2026 (USD Million)
6.4 Rederivation
6.4.1 Market Size, By Region, 2016-2026 (USD Million)
6.5 Genetic testing
6.5.1 Market Size, By Region, 2016-2026 (USD Million)
6.6 Quarantine depending
6.6.1 Market Size, By Region, 2016-2026 (USD Million)
6.7 Others
6.7.1 Market Size, By Region, 2016-2026 (USD Million)
Chapter 7 Global Rat Model Market, By Application
7.1 Application Outlook
7.2 Neurology
7.2.1 Market Size, By Region, 2016-2026 (USD Million)
7.3 Immunology
7.3.1 Market Size, By Region, 2016-2026 (USD Million)
7.4 Toxicology
7.4.1 Market Size, By Region, 2016-2026 (USD Million)
7.5 Oncology
7.5.1 Market Size, By Region, 2016-2026 (USD Million)
7.6 Others
7.6.1 Market Size, By Region, 2016-2026 (USD Million)
Chapter 8 Global Rat Model Market, By End-Use
8.1 End-Use Outlook
8.2 Healthcare companies
8.2.1 Market Size, By Region, 2016-2026 (USD Million)
8.3 CROs
8.3.1 Market Size, By Region, 2016-2026 (USD Million)
8.4 Academic and research Institutes
8.4.1 Market Size, By Region, 2016-2026 (USD Million)
Chapter 9 Global Rat Model Market, By Region
9.1 Regional outlook
9.2 North America
9.2.1 Market Size, By Country 2016-2026 (USD Million)
9.2.2 Market Size, By Type, 2016-2026 (USD Million)
9.2.3 Market Size, By Technology, 2016-2026 (USD Million)
9.2.4 Market Size, By Service, 2016-2026 (USD Million)
9.2.5 Market Size, By Application, 2016-2026 (USD Million)
9.2.6 Market Size, By End-Use, 2016-2026 (USD Million)
9.2.7 U.S.
9.2.7.1 Market Size, By Type, 2016-2026 (USD Million)
9.2.7.2 Market Size, By Technology, 2016-2026 (USD Million)
9.2.7.3 Market Size, By Service, 2016-2026 (USD Million)
9.2.7.4 Market Size, By Application, 2016-2026 (USD Million)
9.2.7.5 Market Size, By End-Use, 2016-2026 (USD Million)
9.2.8 Canada
9.2.8.1 Market Size, By Type, 2016-2026 (USD Million)
9.2.8.2 Market Size, By Technology, 2016-2026 (USD Million)
9.2.8.3 Market Size, By Service, 2016-2026 (USD Million)
9.2.8.4 Market Size, By Application, 2016-2026 (USD Million)
9.2.8.5 Market Size, By End-Use, 2016-2026 (USD Million)
9.3 Europe
9.3.1 Market Size, By Country 2016-2026 (USD Million)
9.3.2 Market Size, By Type, 2016-2026 (USD Million)
9.3.3 Market Size, By Technology, 2016-2026 (USD Million)
9.3.4 Market Size, By Service, 2016-2026 (USD Million)
9.3.5 Market Size, By Application, 2016-2026 (USD Million)
9.3.6 Market Size, By End-Use, 2016-2026 (USD Million)
9.3.7 Germany
9.3.7.1 Market Size, By Type, 2016-2026 (USD Million)
9.3.7.2 Market Size, By Technology, 2016-2026 (USD Million)
9.3.7.3 Market Size, By Service, 2016-2026 (USD Million)
9.3.7.4 Market Size, By Application, 2016-2026 (USD Million)
9.3.7.5 Market Size, By End-Use, 2016-2026 (USD Million)
9.3.8 UK
9.3.8.1 Market Size, By Type, 2016-2026 (USD Million)
9.3.8.2 Market Size, By Technology, 2016-2026 (USD Million)
9.3.8.3 Market Size, By Service, 2016-2026 (USD Million)
9.3.8.4 Market Size, By Application, 2016-2026 (USD Million)
9.3.8.5 Market Size, By End-Use, 2016-2026 (USD Million)
9.3.9 France
9.3.9.1 Market Size, By Type, 2016-2026 (USD Million)
9.3.9.2 Market Size, By Technology, 2016-2026 (USD Million)
9.3.9.3 Market Size, By Service, 2016-2026 (USD Million)
9.3.9.4 Market Size, By Application, 2016-2026 (USD Million)
9.3.9.5 Market Size, By End-Use, 2016-2026 (USD Million)
9.3.10 Italy
9.3.10.1 Market Size, By Type, 2016-2026 (USD Million)
9.3.10.2 Market Size, By Technology, 2016-2026 (USD Million)
9.3.10.3 Market Size, By Service, 2016-2026 (USD Million)
9.3.10.4 Market Size, By Application, 2016-2026 (USD Million)
9.3.10.5 Market Size, By End-Use, 2016-2026 (USD Million)
9.3.11 Spain
9.3.11.1 Market Size, By Type, 2016-2026 (USD Million)
9.3.11.2 Market Size, By Technology, 2016-2026 (USD Million)
9.3.11.3 Market Size, By Service, 2016-2026 (USD Million)
9.3.11.4 Market Size, By Application, 2016-2026 (USD Million)
9.3.11.5 Market Size, By End-Use, 2016-2026 (USD Million)
9.3.12 Russia
9.3.12.1 Market Size, By Type, 2016-2026 (USD Million)
9.3.12.2 Market Size, By Technology, 2016-2026 (USD Million)
9.3.12.3 Market Size, By Service, 2016-2026 (USD Million)
9.3.12.4 Market Size, By Application, 2016-2026 (USD Million)
9.3.12.5 Market Size, By End-Use, 2016-2026 (USD Million)
9.4 Asia Pacific
9.4.1 Market Size, By Country 2016-2026 (USD Million)
9.4.2 Market Size, By Type, 2016-2026 (USD Million)
9.4.3 Market Size, By Technology, 2016-2026 (USD Million)
9.4.4 Market Size, By Service, 2016-2026 (USD Million)
9.4.5 Market Size, By Application, 2016-2026 (USD Million)
9.4.6 Market Size, By End-Use, 2016-2026 (USD Million)
9.4.7 China
9.4.7.1 Market Size, By Type, 2016-2026 (USD Million)
9.4.7.2 Market Size, By Technology, 2016-2026 (USD Million)
9.4.7.3 Market Size, By Service, 2016-2026 (USD Million)
9.4.7.4 Market Size, By Application, 2016-2026 (USD Million)
9.4.7.5 Market Size, By End-Use, 2016-2026 (USD Million)
9.4.8 India
9.4.8.1 Market Size, By Type, 2016-2026 (USD Million)
9.4.8.2 Market Size, By Technology, 2016-2026 (USD Million)
9.4.8.3 Market Size, By Service, 2016-2026 (USD Million)
9.4.8.4 Market Size, By Application, 2016-2026 (USD Million)
9.4.8.5 Market Size, By End-Use, 2016-2026 (USD Million)
9.4.9 Japan
9.4.9.1 Market Size, By Type, 2016-2026 (USD Million)
9.4.9.2 Market Size, By Technology, 2016-2026 (USD Million)
9.4.9.3 Market Size, By Service, 2016-2026 (USD Million)
9.4.9.4 Market Size, By Application, 2016-2026 (USD Million)
9.4.9.5 Market Size, By End-Use, 2016-2026 (USD Million)
9.4.10 Australia
9.4.10.1 Market Size, By Type, 2016-2026 (USD Million)
9.4.10.2 Market size, By Technology, 2016-2026 (USD Million)
9.4.10.3 Market Size, By Service, 2016-2026 (USD Million)
9.4.10.4 Market Size, By Application, 2016-2026 (USD Million)
9.4.10.5 Market Size, By End-Use, 2016-2026 (USD Million)
9.4.11 South Korea
9.4.11.1 Market Size, By Type, 2016-2026 (USD Million)
9.4.11.2 Market Size, By Technology, 2016-2026 (USD Million)
9.4.11.3 Market Size, By Service, 2016-2026 (USD Million)
9.4.11.4 Market Size, By Application, 2016-2026 (USD Million)
9.4.11.5 Market Size, By End-Use, 2016-2026 (USD Million)
9.5 Latin America
9.5.1 Market Size, By Country 2016-2026 (USD Million)
9.5.2 Market Size, By Type, 2016-2026 (USD Million)
9.5.3 Market Size, By Technology, 2016-2026 (USD Million)
9.5.4 Market Size, By Service, 2016-2026 (USD Million)
9.5.5 Market Size, By Application, 2016-2026 (USD Million)
9.5.6 Market Size, By End-Use, 2016-2026 (USD Million)
9.5.7 Brazil
9.5.7.1 Market Size, By Type, 2016-2026 (USD Million)
9.5.7.2 Market Size, By Technology, 2016-2026 (USD Million)
9.5.7.3 Market Size, By Service, 2016-2026 (USD Million)
9.5.7.4 Market Size, By Application, 2016-2026 (USD Million)
9.5.7.5 Market Size, By End-Use, 2016-2026 (USD Million)
9.5.8 Mexico
9.5.8.1 Market Size, By Type, 2016-2026 (USD Million)
9.5.8.2 Market Size, By Technology, 2016-2026 (USD Million)
9.5.8.3 Market Size, By Service, 2016-2026 (USD Million)
9.5.8.4 Market Size, By Application, 2016-2026 (USD Million)
9.5.8.5 Market Size, By End-Use, 2016-2026 (USD Million)
9.5.9 Argentina
9.5.9.1 Market Size, By Type, 2016-2026 (USD Million)
9.5.9.2 Market Size, By Technology, 2016-2026 (USD Million)
9.5.9.3 Market Size, By Service, 2016-2026 (USD Million)
9.5.9.4 Market Size, By Application, 2016-2026 (USD Million)
9.5.9.5 Market Size, By End-Use, 2016-2026 (USD Million)
9.6 MEA
9.6.1 Market Size, By Country 2016-2026 (USD Million)
9.6.2 Market Size, By Type, 2016-2026 (USD Million)
9.6.3 Market Size, By Technology, 2016-2026 (USD Million)
9.6.4 Market Size, By Service, 2016-2026 (USD Million)
9.6.5 Market Size, By Application, 2016-2026 (USD Million)
9.6.6 Market Size, By End-Use, 2016-2026 (USD Million)
9.6.7 Saudi Arabia
9.6.7.1 Market Size, By Type, 2016-2026 (USD Million)
9.6.7.2 Market Size, By Technology, 2016-2026 (USD Million)
9.6.7.3 Market Size, By Service, 2016-2026 (USD Million)
9.6.7.4 Market Size, By Application, 2016-2026 (USD Million)
9.6.7.5 Market Size, By End-Use, 2016-2026 (USD Million)
9.6.8 UAE
9.6.8.1 Market Size, By Type, 2016-2026 (USD Million)
9.6.8.2 Market Size, By Technology, 2016-2026 (USD Million)
9.6.8.3 Market Size, By Service, 2016-2026 (USD Million)
9.6.8.4 Market Size, By Application, 2016-2026 (USD Million)
9.6.8.5 Market Size, By End-Use, 2016-2026 (USD Million)
9.6.9 South Africa
9.6.9.1 Market Size, By Type, 2016-2026 (USD Million)
9.6.9.2 Market Size, By Technology, 2016-2026 (USD Million)
9.6.9.3 Market Size, By Service, 2016-2026 (USD Million)
9.6.9.4 Market Size, By Application, 2016-2026 (USD Million)
9.6.9.5 Market Size, By End-Use, 2016-2026 (USD Million)
Chapter 10 Company Landscape
10.1 Competitive Analysis, 2020
10.2 Charles River Laboratories (CRL)
10.2.1 Company Overview
10.2.2 Financial Analysis
10.2.3 Strategic Positioning
10.2.4 Info-Graphic Analysis
10.3 Envigo/Harlan Laboratories, Inc.
10.3.1 Company Overview
10.3.2 Financial Analysis
10.3.3 Strategic Positioning
10.3.4 Info-Graphic Analysis
10.4 Taconic Biosciences, Inc
10.4.1 Company Overview
10.4.2 Financial Analysis
10.4.3 Strategic Positioning
10.4.4 Info-Graphic Analysis
10.5 genOway S.A.
10.5.1 Company Overview
10.5.2 Financial Analysis
10.5.3 Strategic Positioning
10.5.4 Info-Graphic Analysis
10.6 Javier Labs
10.6.1 Company Overview
10.6.2 Financial Analysis
10.6.3 Strategic Positioning
10.6.4 Info-Graphic Analysis
10.7 Transpogen Biopharmaceutical, Inc.
10.7.1 Company Overview
10.7.2 Financial Analysis
10.7.3 Strategic Positioning
10.7.4 Info-Graphic Analysis
10.8 Transviragen, Inc.
10.8.1 Company Overview
10.8.2 Financial Analysis
10.8.3 Strategic Positioning
10.8.4 Info-Graphic Analysis
10.9 Biomedical Research Models, Inc.
10.9.1 Company Overview
10.9.2 Financial Analysis
10.9.3 Strategic Positioning
10.9.4 Info-Graphic Analysis
10.10 Covance
10.10.1 Company Overview
10.10.2 Financial Analysis
10.10.3 Strategic Positioning
10.10.4 Info-Graphic Analysis
10.11 Horizon Discovery Group Plc.
10.11.1 Company Overview
10.11.2 Financial Analysis
10.11.3 Strategic Positioning
10.11.4 Info-Graphic Analysis
10.12 Other Companies
10.12.1 Company Overview
10.12.2 Financial Analysis
10.12.3 Strategic Positioning
10.12.4 Info-Graphic Analysis
The Global Rat Model Market has been studied from the year 2019 till 2026. However, the CAGR provided in the report is from the year 2021 to 2026. The research methodology involved three stages: Desk research, Primary research, and Analysis & Output from the entire research process.

The desk research involved a robust background study which meant referring to paid and unpaid databases to understand the market dynamics; mapping contracts from press releases; identifying the key players in the market, studying their product portfolio, competition level, annual reports/SEC filings & investor presentations; and learning the demand and supply-side analysis for the Rat Model Market.

The primary research activity included telephonic conversations with more than 50 tier 1 industry consultants, distributors, and end-use product manufacturers.

Finally, based on the above thorough research process, an in-depth analysis was carried out considering the following aspects: market attractiveness, current & future market trends, market share analysis, SWOT analysis of the company and customer analytics.


This FREE sample includes market data points, ranging from trend analyses to market estimates & forecasts. See for yourself.
Or view our licence options:
Tailor made solutions just for you
80% of our clients seek made-to-order reports. How do you want us to tailor yours?
OUR CLIENTS


